Materials Sciences and Applications
Vol.3 No.11(2012), Article ID:24926,9 pages DOI:10.4236/msa.2012.311114
The Effect of Several Service and Weathering Parameters on Tensile Properties of PVC Pipe Materials
![]()
1Faculty of Material Engineering, University of Babylon, Babylon, Iraq; 2Materials and Engineering Research Institute, Sheffield Hallam University, Sheffield, UK.
Email: A.Hashim@shu.ac.uk
Received May 16th, 2012; revised July 28th, 2012; accepted August 29th, 2012
Keywords: PVC; Mechanical Properties; Material Treatments; Stabilization; PVC
ABSTRACT
For water and sewer pipes, PVC is considered to be one of the best row materials. Due to its physical, chemical and industrial significant properties, PVC is commercially invited to be in the first position. Many other traditional raw materials; e.g. iron, concrete, polyethylene and vitrified clay (VC), are coming in second position. This work is conducted to study the tensile properties of two different types of PVC raw materials (named as gray and white) for water pipe manufacturing by implementing different test conditions. The samples were prepared by cutting off the pipe to an individual cross sectional size rings. Afterward, they were softened smoothly by heating the ring samples to obtain flat standard tensile test specimen. The influence of strain rate (crosshead speed), temperature and UV radiation on the tensile properties of PVC pipe’s row material were investigated. The selected experimental test temperatures are (28˚C, 50˚C and 70˚C), the selected crosshead speeds are (5, 50 and 100 mm/min) and the UV treatment exposure times are (168, 408, 744 and 1080) hours. The result shows that the gray PVC pipes have tensile strength greater than white PVC pipes. The yield stress and modulus of elasticity are directly proportion to strain rate and inversely proportion to the treatment temperature of both PVC samples. However, the fracture strain was increased with temperature and decreased with strain rate. UV treatment didn’t show a significant effect on the yield stress and modulus of elasticity. This is an indication of PVC long time stability.
1. Introduction
Since early 20th century, Poly(vinyl chloride) (PVC) as a raw industry compounds were widely used for exterior applications. These applications include piping system for various purposes [1]. PVC pipes can be structured to have good weathering and service characteristics which are required in many environmental sites. This includes colour retention, physical property retention, and dimensional stability. To certify an acceptable long time performance of using PVC pipe externally, good understanding of PVC degradation mechanisms and the effect of sunlight are essential.
Weather conditions, sun, temperature variation, rain and snow all affect the long time performance of PVC exterior pipes. Within this long time, white PVC is converted to yellow and the colour compounds will fade. Toughness and flexibility of PVC may be adversely affected by outdoor exposure. Ultraviolet sunlight absorbed by the chemical structure is sufficient to break most of the chemical bonds in polymer [1].
Many scientific and commercial articles have pointed that PVC pipes are one of the most significant raw materials in pipe industry and plumbing [2].
PVC offers a host of properties that have made it the dominant water and sewer utility pipe raw material. Those properties are: corrosion resistance/durability, strength, water quality, superior flow and superior strength-toweight ratio [3,4]. In 2002, global piping market issued the demands on the pipe raw materials according to the ranking of material pipes. PVC was occupying 39% of that market as shown in Figure 1.
In this case of pipe material, material tensile stress is the parameter that indicating pipe weather resistivity. Studies on tensile properties of polymeric materials have been numerously conducted. Wang et al., studied tensile properties of extruded short E-glass fiber reinforced polyamide-6 composite sheet at different temperatures (21.5˚C, 50˚C, 75˚C, 100˚C) and different strain rates (0.05/min, 0.5/min, 5/min). It was found that the elastic modulus and tensile strength of the composite increased with strain rate and decreased with temperature [5]. ShihKai Cheng and Chuh-Yung Chen considered the me
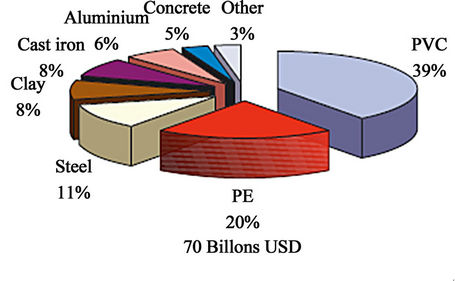
Figure 1. Global piping market 2002/Ranking of materials [5].
chanical properties and strain-rate effect of neat PMMA and EVA/PMMA blends. An obvious transition occurred while the EVA/PMMA blends are investigated at room temperature over the strain rates of four decades (from 1.6 × 10⁻⁴ to 0.16 s–1). On the other hand, the neat PMMA remains brittle over the entire range of strain rates [6]. Mohammadian-Gezaz et al., studied the effects of blending and processing conditions, such as sheet temperature and strain rate on the hot tensile properties and rheological properties of ternary blends of PP/HDPE/ EPDM. It has been determined that the elastic modulus, load yield and the post yield modulus decreased in comparison with original PP [7]. J. Fiedler et al., premeditated UV degradation of Polychloroprene by testing tensile bars exposed to UV radiation at 350 nm for different period of time. The result showed that the elongation of the tensile bars decreased significantly with the increasing of the duration of UV radiation. The tensile strength of polychloroprene specimen decreases with the increasing of radiation [8].
The research work in this paper aims to study the tensile properties of two different PVC pipe materials under different conditions such as strain rate (crosshead speed), temperature and UV radiation.
2. Experimental Work
The specimens for tensile testing programmer are prepared from 4 inches extruded pipes which are manufactured according to the formulations (gray and white profiles) shown in Table 1.
Rings were cut off from the pipe (as illustrated in Figure 2), slit and straightened between metal plates after smooth heating treatment for 30 minutes at 70˚C in an electric oven. The specimens for tensile tests were then machined from the straightened plates according to the ASTM D638-03 standard method of test for tensile properties of plastics by using milling machine. The sample dimensions are due to ASTM D638-03, as shown Figure 3.
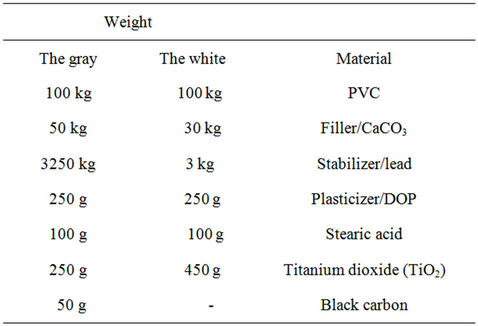
Table 1. Illustrates the two profiles which are used in the study.
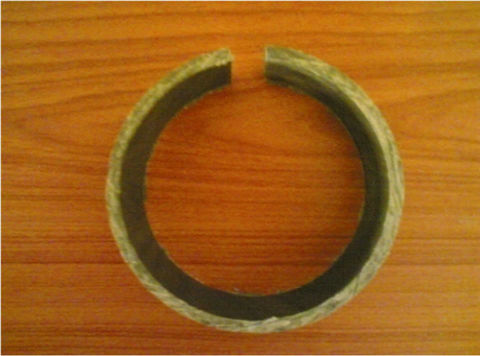
Figure 2. The ring cuts off from PVC pipe.

Figure 3. Geometry and dimensions of the tensile specimen used in the study.
Tests were carried out on the samples at each of these temperatures: 28˚C, 50˚C and 70˚C and at crosshead speeds of 5, 50 and 100 mm/min. Instron1195 machine is used to performed tensile test with environmental chamber fabricated for this purpose. Figures 4(a) and (b), illustrates Instron1195 machine and the environmental chamber. As well as the tests that were carried out on samples that were exposed to UV for three different period of times (168, 408, 744 and 1080 h) at crosshead speeds of 5 mm/min. Samples for tensile test are exposed to
 (a)
(a)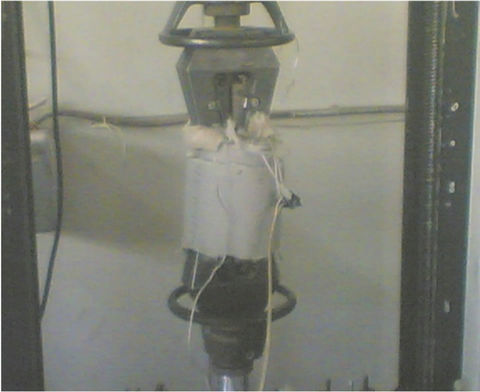 (b)
(b)
Figure 4. Instron 1195 universal testing machine equipped with environmental chamber.
UV-radiation from UV source of 16 watt (380 KJ×mol–1) and wave length of 375 - 380 nm. Surface examinations, color change and tensile are determined as a function of a time.
Nikon, Eclipse, ME 600 L, connected to the digital camera (Nikon Digital Camera DXM 1200 F). The camera was used to examine the surface fracture after tensile stress, temperature and strain rate testes. It was also used to observe the effect of UV exposure on the surface layer of PVC pipe materials.
3. Results and Discussion
3.1. The Effect of Strain Rate and Temperature
Effects of temperature on the tensile property of the two types have been achieved by annealing the samples into three levels of temperatures (28˚C, 50˚C and 70˚C). 28˚C and 50˚C levels of temperature were chosen to cover the worldwide summer range of temperature. 70˚C annealed temperatures was chosen to speed up the heat treatment and aging following the Sturik description for heat treatment [9]. Struik described the time needed to reach thermodynamic equilibrium at the annealing temperature Ta is given by the relation [9]:
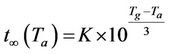
where K is a constant and Tg is the glass transition temperature.
Following Struik calculation, the endothermic peak could be achieved within one hour of annealing at the speeding up temperature of 70˚C. This value can be used to determine the time needed to observe the endothermic peak.


This irregular estimation indicates that the physical ageing cannot be expected for the outer service life of PVC products unless the product is used at temperatures close to Tg or UV affect takes into account.
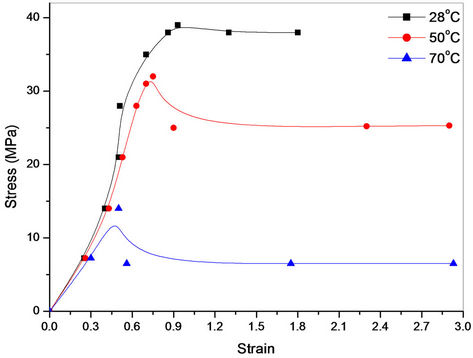
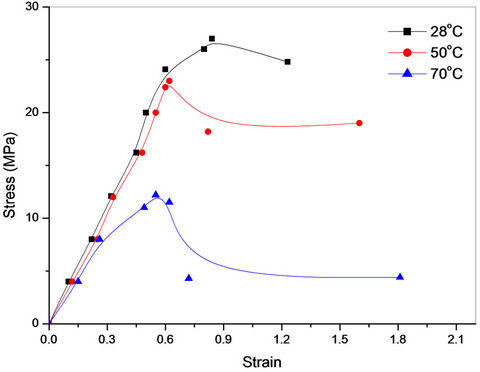
The annealed samples were tested by applying different crosshead speeds (5, 50 and 100 mm/min). Figures 5(a)-(c) shows the experimental stress-strain variation for the gray profile by using the three crosshead speed mentioned above.
The experimental output of the white profile is illustrated in Figure 6. Figure 6 shows stress-strain curves measured at the same crosshead speed following the same procedure of the gray profile, 5, 50 and 100 mm/min, respectively.
Three important regions can clearly determine from Figures 5 and 6; the elastic region, yield stress and the deformation. From the experimental observation, these curves can be discussed due to the following properties:
3.1.1. Elastic Region
In this region, it can be seen that the elastic modulus depend inversely on the temperature and directly proportional to the crosshead speed. PVC profile material transits from one phase to another phase smoothly and gradually as most of plastics showing the same familiar properties of flexibility.
The high flexibility in the PVC chain plays the major role of the tensile test and the phase transformation.
 (a)
(a)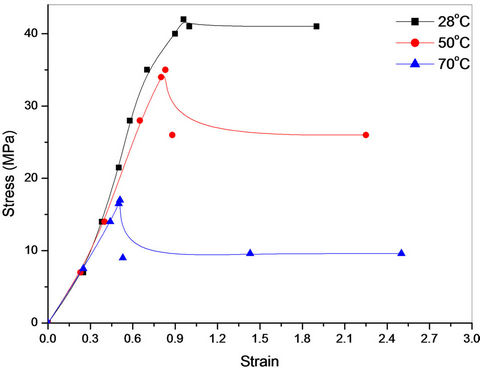 (b)
(b)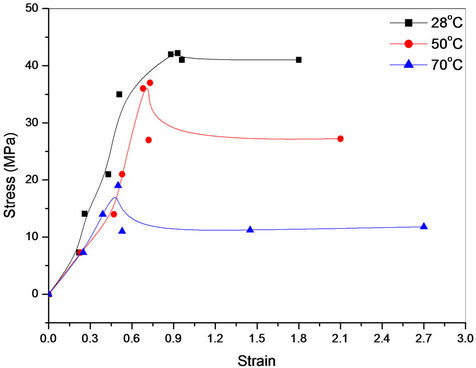 (c)
(c)
Figure 5. Gray profile stress-strain curves (a) at 5 mm/min, (b) 50 mm/min and (c) 100 mm/min.
When the crosshead speed increases, the sample is fractured quickly due to the reduce in material toughness and inefficient time to plastic deformation. As a result the
 (a)
(a)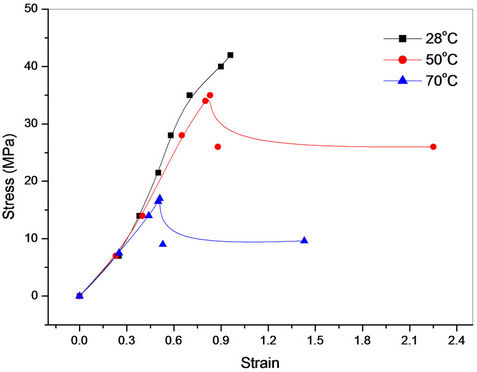 (b)
(b)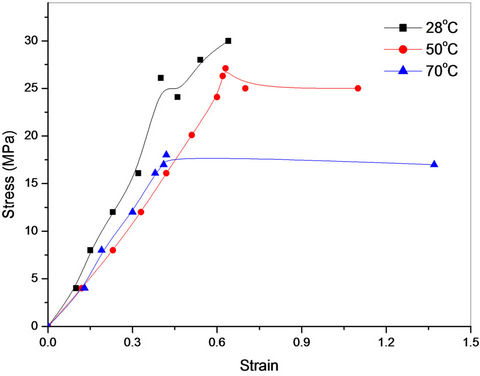 (c)
(c)
Figure 6. White profile stress-strain curves (a) at 5 mm/min, (b) 50 mm/min and (c) 100 mm/min.
elastic modulus is increased.
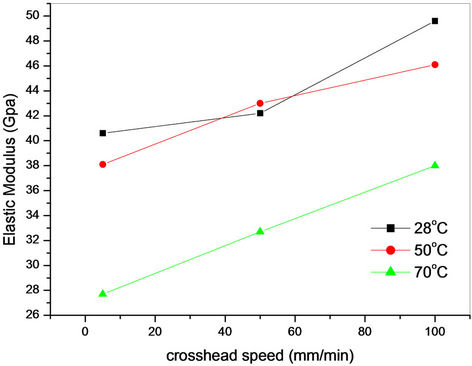
The Elastic Modulus which was calculated from the elastic region of each curve is varied within very short range (e.g. from 40 - 49 GPa for the Gray and 37 - 53 GPa for White) due to the crosshead speed, as shown in Figures 7 (a) and (b). The Elastic Modulus is reduced to 27.7 GPa for the gray profile and 22.7 GPa for white profile when the annealed temperature was increased to 70˚C. Figure 7 also shows that both of the two profiles are not experiencing big differences in Elastic Modulus.
3.1.2. Yield Stress
Yield strength is another important engineering parameter. It defines the stress at which plastic deformation begins. It can be seen that the tensile yield stress increases with crosshead speed and decreased with temperature. However, it decreases with increasing temperatures at all crosshead speeds. The reason behind this behavior is that the Vader walls forces between PVC molecules becomes weaker, therefore it increases molecular mobility and plastic deformation.
 (a)
(a)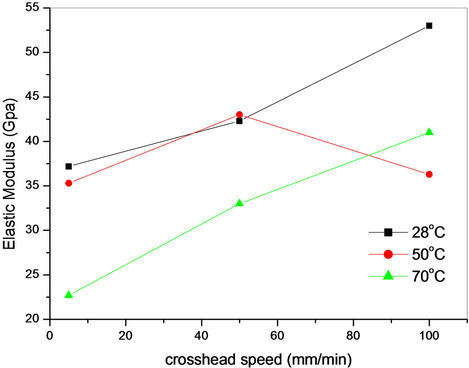 (b)
(b)
Figure 7. Elastic Modulus vs. crosshead speed (a) for gray profile and (b) for white profile.
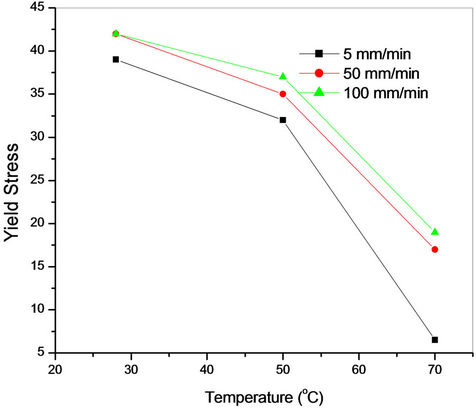
The resultant yield stress have been determined and plotted in Figures 8(a) and (b). The crosshead speed of 5 mm/min and 50 mm/min shows that the maximum yield stress is achieved around the annealing temperature of 28˚C.
From the comparison between Figures 8(a) and (b), observe that the yield strength of Gray has higher Elastic Modulus than the White and this referred to the percentage of CaCO3 filler and the Black Carbon additive. The ratio of the filler and additive is 1:0.5:0.0025 (PVC: CaCO3:C) for the Gray, whereas 1:0.3:0.0045 for the White. This means that the filler and additive improves the hardness of the PVC. In the normal weather, summer temperature (28˚C to 50˚C) the difference of 0.2 in the filler and an extra 200 g of additive between the two profiles are improving the yield stress from 24 GPa to
 (a)
(a)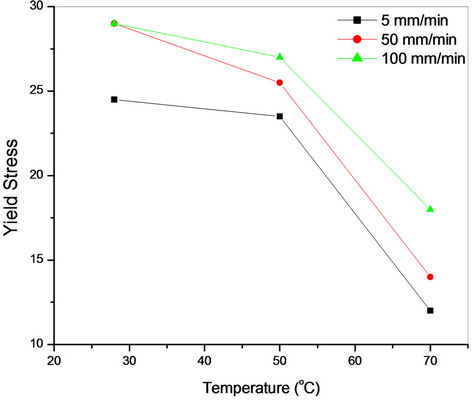 (b)
(b)
Figure 8. The resultant yield stress due to the temperature (a) for gray profile and (b) for white profile.
about 40 GPa at the average temperature of 28˚C and from 32 GPa to 23 GPa at the other side of the world summer’s higher temperature of 50˚C.
3.2. Effect of UV Radiation on Tensile Properties of PVC Profiles
Long summer day light contains high dose of UV which highly affects the outdoor PVC applications. Sunlight associate with UV wave length of 375 - 380 nm. The PVC mechanical properties will vary after a long period of UV exposure. The effect of UV exposure on the tensile properties of the tensile samples for the time periods of (168, 408, 720 and 1080 h) have been discussed in the previous section and will also be presented in this section.
The profiles are exposed to UV-radiation from UV source of 16 watt (380 KJ×mol–1) and wave length of 375 - 380 nm. Figures 9 and 10 illustrate stress-strain curves for the gray and white profiles respectively.
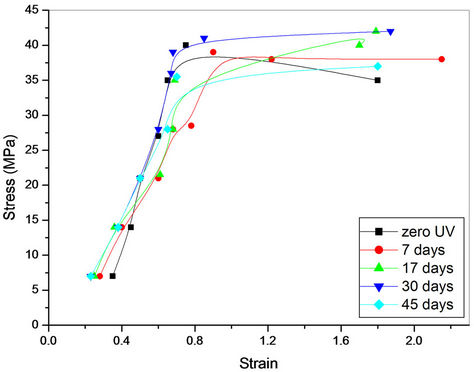
Figure 9. Stress-strain curves for the gray profile at different times of UV does.
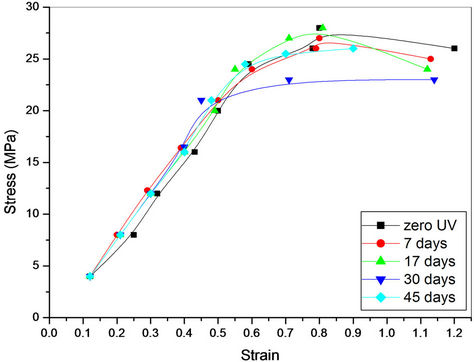
Figure 10. Stress-strain curves for the gray profile at different times of UV does.
3.2.1. Elastic Modulus
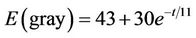
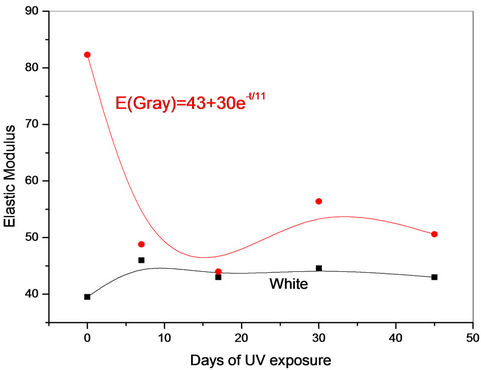
The resultants Elastic Modulus with the yield stress from Figures 9 and 10 are calculated. Variation in the Elastic Modulus and Yield Stress is shown in Figure 11. It can be seen that there is a variation in the Elastic Modulus for the two profiles due to the effect of the UV is different. The first period of exposure is the most effective period of time for both of the profiles. The is improved from 39 MPa to about 46 MPa within the first 7 days, then it is stabilized on 43 MPa. Whereas,  is reduced dramatically from 82 MPa to 48 MPa within the same period of time, then it is fluctuated around the average of 52 MPa but it is not stable.
  for this individual case and affect is following the model equation below, as shown in Figure 11(a):
UV increases the cross-linking between the chain of the white profile which as a result will increase the solidity of the material and the elastic Modulus. On other hand, the elasticity of the gray profile decreased due to the effect of UV which is strongly breaking the chain and decreased the solidity within short period of time. Correspondingly the cross linkage is reduced and that serves to enhance the elasticity.
3.2.2. Yield Stress
Figure 11(b) shows that the yield stress decreases linearly with the UV exposure time for both types. Because of the creation of cross-linking caused by UV radiation, the material is enabling the plastic deformation and as a result the yield stress is increased. Many cracks took place in the sample that was exposed to UV for long period of time which caused weakness in the bonds and therefore the material needs small stress in order to yield.
The yield/UV exposure days (Y/UVD) decreasing rate of the two profiles is not similar. The Gray is showing lower rate of  which means that the yield stress is decreased by 1 MPa every ≈36 days ≈ 864 h. On the other hand, the white profile is decreased by 1 MPa every ≈21 days ≈ 504 h. We have to declare that the exposure time is an artificial time with full intensity, it is not a real time. So it has to be converting to a real time by using the following equation:
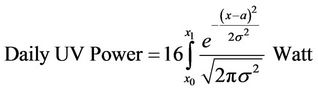
where a = 12 (the mid of the day), x0 is the sun rise, x1 is the sun set and s is the deviation from 12 due to the time of the year.

Our calculation shows that real UV exposure power (daily UV power) is about one quarter to one third of the
 (a)
(a) (b)
(b)
Figure 11. The UV effect on the (a) elastic modulus (b) yield stress.
artificial power. In this case the yield stress (gray) is decreased by 1 MPa every ≈ 110 - 150 days and the white profile is decreased by 1 MPa every ≈ 65 - 85 days of real day time.
It can be determined that the fracture strain decreases with the increasing of the UV exposure time, due to the cross-linking and cracks, the material breaks directly after its yield and the elongation is reduced as a result.
The white profile was more affected by UV than the gray one. This is due to absence of carbon black and the lower content of TiO2.
3.3. Optical Microscopy
According to Figure 12, we can observe the changes in the original color of the gray experimental samples. PVC deteriorates by releasing hydrogen chloride HCl and replacing the signal covalent bonds by conjugated double bonds which gives a yellow-brownish color and the sur-


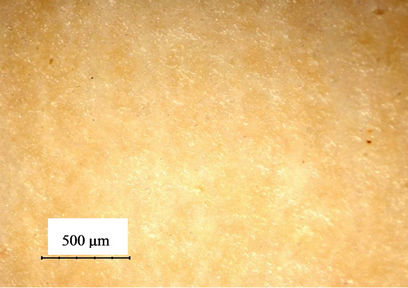
Figure 12. Effect of UV on surface of the gray pipe (a) after 7 days (b) after 45 days (magnification 500×).
face burning start to be appeared. The microscopic images are showing tiny features appeared on the surface morphology. This possibly can be a suitable evidence for the cross linking due to the effect of the UV exposure after 45 days. As we mentioned before 45 days of full UV exposure is about 140 - 180 days of real summer exposure time. Dark and light areas can also observe. Those areas show that the surface roughness is getting higher. The length of the dark stripes increased to be in some places about 500 mm. Stripes within this value are indicating the weakest points and the probability of establishing a crack is very high. The density of the dark stripes per square area is increased after UV exposure.
Over all comparison between the two images is demonstrated clearly the variation in the surface colour, surface roughness and the deep effect of the UV ray and the variation in the mechanical properties of gray profile as a result.
Figures 13(a) and (b) are microscopic images of the white profile after exposed to 7 and 45 days. The profile colour has been changed from white to off white-creamy within the first 7 days of exposure time where the UV dose is about and the real time period of this dose is about 21 - 30 summer days. This new colour is referred to as the Titanium Dioxide (TiO2) additive (450 g).
Titanium dioxide is widely and extensively used in plastics industry and other applications because of its UV resistant properties where it acts as a UV absorber, effi-
 (a)
(a)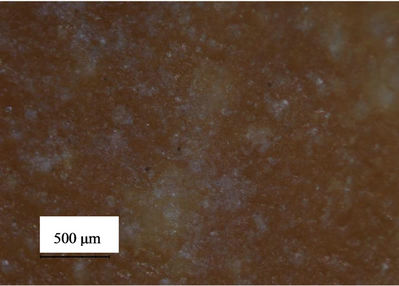 (b)
(b)
Figure 13. Effect of UV on the surface of the white pipe (a) after 7 days (b) after 45 days (magnification 500×).
ciently transforming destructive UV light energy into heat.
Titanium dioxide is found in almost every external PVC application as a physical blocker due to its high refractive index, its strong UV light absorbing capability and its resistance to discolouration under ultraviolet light. This UV blocker is believed to cause less chemical irritation than other UV absorbing materials. There is a possibility for the titanium dioxide to create radicals in due to the absorbing of the UV energy. These radicals may change the chemical bonds of the PVC and its additives which cause damage afterwards to the PVC profile. The volumetric and percentage of this damage is related to the TiO2 percentage in the whole structure of the PVC, but it will be the weakest point which cause a crack defect afterwards and a fault in the mechanical properties of the white PVC profile.
45 days continued, UV lighting has changed the white profile colour to be darker, almost brown possibly because of the effect of TiO2 free radicals on the CaCO3 filler.
4. Conclusions
According to experimental output results of this study, the following conclusions are obtained:
1) The yield stress and elastic modulus decrease with increasing temperatures at all crosshead speeds, while they increased when the crosshead speed increased at all testing temperatures.
2) The elastic modulus for the gray profile is decreased dramatically within the first 7 days of UV radiation exposure time, which shows permanent changes in the profile structure, with a negative affect on the mechanical properties. However, the reduction in Elastic Modulus and Yield strength may represent as lower hardness and higher flexibility. This is possibly more acceptable in some individual outdoor applications, most likely in the hot countries. On the other hand, the white profile is more stabile.
3) The fracture strain will increased with increasing temperature at all crosshead speeds. The largest increase is at 70˚C due to the ductility of material.
4) The spectroscopy exam shows that there is a hug changes in the surface morphology and colour of the gray profile where the fracture strain will decrease with increasing time of UV exposure. While the fracture strain decreased with increasing time of UV radiation.
5. Acknowledgements
The authors gratefully acknowledge the support from Iraqi Ministry of Higher Education and Scientific Research and the University of Babylon, Iraq. The authors would also like to thanks Education Scheme for Training and Developments (ES4TD) British Company for their own great scientific support.
REFERENCES
- E. W. Charles, C. A. Daniels and J. W. Summers, “PVC Handbook,” Hanser Gardner Publications, Cincinnati, 2005.
- R. J. Phillips, “In Pursuit of the Perfect Pipe,” Journal of Failure Analysis and Prevention, Vol. 4, 2004, pp. 8-11.
- “PVC The Choice When Performance Counts,” 2004. www.uni-bell.org
- D. A. Chasis, “Plastic Piping System,” 2nd Edition, Industrial Press, New York, 1988.
- Z. Wang, Z. Yuanxin and P. K. Yuanxin Mallick, “Effects of Temperature and Strain Rate on the Tensile Behavior of Short Fiber Reinforced Polyamide-6,” Polymer Composites, Vol. 23, 2002, pp. 858-871. doi:10.1002/pc.10484
- S. Cheng and C. Chen, “Mechanical Properties and Strain-Rate Effect of EVA/PMMA in Situ Polymerization Blends,” European Polymer Journal, Vol. 40, 2004, pp. 1239-1248. doi:10.1016/j.eurpolymj.2003.11.022
- S. Mohammadian-Gezaz, I. Ghasemi, M. Karrabi and H. Azizi, “Investigation on the Thermoformability of Polyolefin Blends by Hot Tensile and Rheological Tests,” Polymer Testing, Vol. 25, 2006, pp. 504-511. doi:10.1016/j.polymertesting.2006.02.002
- J. Fiedler, L. LaCasse, C. M. Liu, M. Muñiz and K. Reader, “UV Degradation of Polychloroprene Used in Waterski Boot Bindings,” 2007.
- L. C. E. Struik, “Physical Ageing in Amorphous Polymers and Other Materials,” Elsevier Scientific Publishing Company, Amsterdam, 1977.