Journal of Behavioral and Brain Science
Vol.2 No.4(2012), Article ID:25213,8 pages DOI:10.4236/jbbs.2012.24054
Neurobehavioral and Hemodynamic Evaluation of Cognitive Shifting in Children with Autism Spectrum Disorder
1Graduate School of Arts and Sciences, The University of Tokyo, Tokyo, Japan
2Department of Developmental Disorders, National Institute of Mental Health, National Center of Neurology and Psychiatry (NCNP), Tokyo, Japan
3Department of Children, Saitama Jyunshin College, Saitama, Japan
4Department of School Education, Joetsu University of Education, Niigata, Japan
5Department of Child Neurology, NCNP Hospital, Tokyo, Japan
Email: a_yasumura@ardbeg.c.u-tokyo.ac.jp, khiraki@idea.c.u-tokyo.ac.jp
Received September 24, 2012; revised October 16, 2012; accepted October 31, 2012
Keywords: Autism Spectrum Disorder; Executive Function; Cognitive Shifting; Frontal Lobe Function; Near-Infrared Spectroscopy
ABSTRACT
The restrictive, stereotyped behavior in autism spectrum disorder (ASD) is considered to be related to deficits in executive function. In particular, cognitive shifting in executive function is deeply related to stereotyped behavior in ASD. Previous investigations have clarified that the lateral prefrontal cortex is involved in cognitive shifting when flexible changes in attention were needed. However, a few studies have revealed a direct association between cognitive shifting tasks and lateral prefrontal cortex activity in children with ASD. We examined cognitive shifting in 7- to 12-year-old children with ASD and typically developing children using the dimensional change card sort task. In addition, using near-infrared spectroscopy, we examined prefrontal brain activity in conjunction with cognitive shifting. The autistic children provided fewer correct answers and slower reaction times in the task than typically developing children. Furthermore, the autistic children displayed a decline in right lateral prefrontal cortex activity during the task compared with typically developing children. In addition, a negative correlation was observed between the severity of autism and brain activity during the task. These results suggest that the activity and physiological indices used in this study may be useful for identifying the symptoms of ASD and discriminating ASD from other disabilities.
1. Introduction
Autism spectrum disorder (ASD) is a developmental disorder characterized by restricted, repeated, and stereotyped interest and behavior [1]. Many studies indicate that restricted interest and repeated behavior in ASD are related to deficits in executive function [2-4]. Executive functions control high-level cognitive ability that facilitates the inhibition of incorrect behavior and involves the selection of appropriate behavior [4]. There are six domains of executive function: inhibition, working memory, sentence memory, planning, fluency, and shifting [5].
Many researchers have found that scores of executive function tests are low for subjects with ASD [5,10]. For example, in the Tower of Hanoi test, which assesses planning ability, and the Wisconsin Card Sorting Test (WCST), which assesses cognitive shifting, children with autism had lower scores than children with typical development or attention deficit/hyperactivity disorder [9,11]. Therefore, it has been shown that deficits in executive function tasks are specific signs of ASD. However, Lopez et al. performed a covariance analysis of the scores of shifting and planning using intelligence quotient (IQ) as the covariate and observed that children with ASD had worse shifting task scores than typically developing children (TDC), although planning task scores were not significantly different between these groups of children. Therefore, it appears that the planning task score was affected by IQ. Because shifting function is an important ability that is connected with change in the mental state, deficits in this domain may be linked to the persistent and repeated behavior seen in ASD [8].
In WCST, the subject needs to change his/her response according to the shape, color, or number, following the feedback from the experimenter. However, WCST is slightly problematic because it requires additional cognitive processes, and thus, it does not solely measure cognitive shifting. Conversely, the dimensional change card sort (DCCS) task is specific for cognitive shifting and has simple instructions; thus, permitting its use in individuals across a wide range of ages [12]. In a previous research, 3-year-old children tended to similarly respond to a stimulus as they responded to a previous stimulus. This symptom was similar to lack of flexibility observed in patients with frontal region damage. However, 5-yearold children could alter their responses according to changes in the rules [13]. Therefore, the DCCS task can reflect the developmental changes in executive functions and characteristics of disabilities. Thus, we believe that the DCCS task can detect lack of flexibility such as that observed in persistent and repeated behavior.
During selective response tasks that require cognitive shifting, activities of the dorsolateral prefrontal cortex, ventrolateral prefrontal cortex, and anterior cingulate cortex were determined to be lower in autistic adults than in normal adults. Furthermore, by examining the network comprising the prefrontal cortex (PFC) and other domains using factor analysis, it was reported that the activity of the interval region comprising PFC and the parietal lobe and the functional connection between the hemispheres are low. Based on these findings, the specificity of executive function in the adult brain stem was believed to differ between autistic and normal individuals.
In this study, we evaluated cognitive shifting function in autistic children during the DCCS task. In addition, we clarified the specifics of brain activities, particularly those in PFC, which is thought to be the domain associated with the deficits in ASD, using near-infrared spectroscopy (NIRS). NIRS is noninvasive, does not require children to be in a fixed position, and can be used for young children [14,15].
2. Materials and Methods
2.1. Subjects
The ASD group consisted of 14 subjects (mean age ± standard deviation, 9.56 ± 1.44 years; 8 boys and 6 girls; all but two were right-handed) with Asperger’s syndrome or high-functioning autism (Table 1). Pediatric neurologists made the diagnoses based on DSM-IV-TR criteria [1]. IQs of the diagnostic group were evaluated using the Wechsler Intelligence Scale for Children, Third Edition. No individual’s full IQ was lower than 80. TDC (9 boys and 11 girls, 9.15 ± 1.64 years; all but three were righthanded) were recruited as controls and paid volunteers. All subjects had normal or corrected vision and no history of neurological disorders. All subjects from both groups and their mothers provided written informed consent before the experiment. The experimental protocol was approved by the Ethics Committee of the National Center of Neurology and Psychiatry.
All subjects completed Raven’s Colored Progressive Matrices test (RCPM) [16] to determine their nonverbal intelligence. In addition, we measured their language abilities regarding sentence comprehension using the Kaufman assessment battery for children (K-ABC). Moreover, the Pervasive Developmental Disorders Autism Society Japan Rating Scale (PARS) [17] test was conducted by interviewing the mother of each subject in the TDC and ASD groups to verify ASD severity in each subject. The PARS test consisted of two categories: questions about clinical conditions during infancy (PARS infant) and questions about current clinical conditions (PARS present).
Age, the K-ABC (comprehension) score, and the RCPM score were not significantly different between the groups (age: t(32) = 0.76, not significant (n.s.): p > 0.05; reading comprehension: t(32) = 0.90, n.s.; RCPM: t(32) = 0.31, n.s.; Table 1). However, a significant main effect was observed between the groups for the two PARS subscores (PARS infant: t(32) = 9.87, p < 0.001, PARS present: t(32) = 11.52, p < 0.001; Table 1).

Table 1. Characteristics of the participating groups. Comparisons of the typically developing children (TDC) and autistic spectrum disorder (ASD) groups were performed using Student’s t-test (two-tailed).
2.2. Behavioral Task and Data Analysis
The subjects performed a task using a personal computer (PC). The subjects sat 50 cm away from PC [15-inch liquid crystal display (LCD) screen]. The background of the display was gray. The detailed procedures are as follows.
2.2.1. Baseline Task
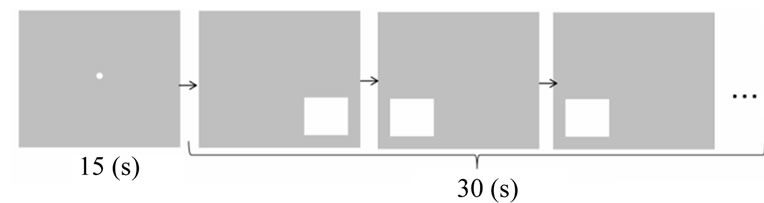
A white square was shown on the right or left lower side of the 15-inch LCD screen, and the subjects indicated on which side of the screen the square appeared by pressing a button corresponding to that side of the screen. The next square appeared randomly 1 s after the subjects pressed the button. A 15-s rest period was allowed before beginning a task. During the rest period, a small white circle was shown in the center of the screen, and the subjects were instructed to only watch the white circle closely. The task time was 30 s.
2.2.2. DCCS Task
We used “border version” of the DCCS task to evaluate cognitive shifting in the subjects. In this task, the subjects must frequently alternate their responses according to the color or shape as the rule changes [12].
Specifically, three cards were displayed in the form of a pyramid on the same screen. On each white card, a diamond or star shape was presented in red or blue. The subjects were required to select which of the two cards at the bottom of the pyramid (selection cards) matched the card at the top of the pyramid (reference card) according to the given rule (shape or color; Figure 1). The color and shape of the two selection cards differed from those of the reference card. If the reference card was hemmed in black, correct response was to select the selection card that matched the reference card in shape. When no black hemming was shown, then the correct response was to select the selection card that matched the reference card in color. The reference and selection cards were displayed on the screen until the subject responded, and the next set of cards appeared randomly 0.5 s after the subject pressed a button. The subjects were allowed a 15-s rest period before conducting the trial. During the rest period, the subjects stared at a small white circle on the screen, as described for the baseline task. The task time was 30 s.
The DCCS and baseline tasks were performed twice, but alternatively (i.e., baseline task, DCCS task, baseline task, and DCCS task). In addition, before the actual task, the subjects underwent a practice trial (5-s rest period followed by a 20-s trial). We provided feedback to the subjects during the practice trial and confirmed that they completely understood the instructions. During the actual task, feedback was not provided and the subjects’ response and reaction times were recorded automatically.
The number of correct answers and errors, reaction time of correct responses, and percentage of correct answers were evaluated for each trial. In addition, the correlations between these variables and age, intelligence, and the numerical PARS scores were calculated.
The assumptions for parametric testing were checked and appeared to be violated for all dependent measures. For all behavioral measures, nonparametric Mann-Whitney U tests were applied. A significance level of p < 0.05 (two-sided) was adopted for all analyses.
2.3. Near-Infrared Spectroscopy Recording and Analysis
While the subjects performed the task, we simultaneously recorded the activity of the lateral PFC, as measured by changes in oxygenated hemoglobin (ΔHbO2) using a multi-channel NIRS equipment (OEG-16; Spectratech Inc., Tokyo, Japan). In this system, near-infrared laser diodes with two wavelengths (approximately 770 and 840 nm) were used to emit the near-infrared light. The re-emitted light was detected using avalanche photodiodes located 30 mm from the emitters with a temporal resolution of 655 ms, thereby measuring ΔHbO2 at a depth of approximately 3 cm below the scalp. In our system, six emitters and six detectors were placed at alternate points on a 2 × 6 grid (Figure 2). This configuration enabled us to detect signals from 16 channels of bilateral frontal regions (Figure 2). The center of the probe matrix was placed on Fpz (International 10 - 20 system), and the bottom left and bottom right corners were located around F7 and F8, respectively, according to a previous report [18]. The detected signal was sent to a data collection computer, which was different from the task-control computer. The timing of each trial event, such as the on-
 (a)
(a) (b)
(b)
Figure 1. Illustration of the protocol of the baseline (a) and dimensional change card sort (DCCS) (b) tasks. In the baseline task, the participants have to indicate the side of the screen on which the white square appeared. In the DCCS task, if the upper card was hemmed in black, the participants had to select the lower card with the same shape as that printed on the upper card and if the upper card was not hemmed in black, they had to select the lower card of the same color as that of the upper card.

Figure 2. Near-infrared spectroscopy (NIRS) settings. The NIRS probe was attached to the prefrontal area. The center of the probe matrix was placed on Fpz (International 10 - 20 system), and the bottom left and bottom right corners were located around F7 and F8, respectively.
set of the sample cue, was transmitted to the data collection computer from the task-control computer through a local area network with UDP communication. A bandpass filter was set for the NIRS data at 0.01 - 0.1 Hz during the task using fast Fourier transform to reject artifacts caused by minor subject movements. To increase the signal-to-noise ratio, data from each channel were converted into a z-score because raw data cannot be compared directly across subjects and channels [14]. The z-score was calculated using the mean and standard deviation of ΔHbO2 during the last 6 s of the rest period. Consequently, the mean and standard deviation were adjusted to a z-score of 0 and 1, respectively, for every channel. Subjects whose scores were more than two standard deviations away from the mean were excluded because of the possibility of motion artifacts.
3. Results
3.1. Behavioral Results
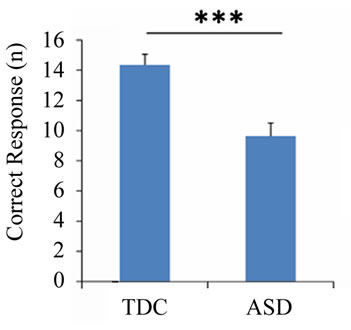
Regarding the DCCS task, the number of correct answers (U = 37.0, p < 0.001) and the reaction time (U = 213.0, p = 0.011) differed significantly between the ASD and TDC groups, although difference was not observed in the number of errors (U = 128.5, p = 0.685) (Figure 3). There was no significant difference in the percentage of correct answers (U = 128.5, p = 0.687), and the percentage exceeded 75% in both groups. In addition, the number of correct answers was negatively correlated with both PARS (infant) (r = −0.511, p = 0.002) and PARS (present) (r = −0.518, p = 0.002) (Figure 4).
3.2. Near-Infrared Spectroscopy
To compare the changes in brain blood flow, we utilized Student’s t-test for each channel. Initially, we examined the differences in brain activity between the baseline and DCCS tasks to assess changes in brain activity in the two groups. Activation was recognized in 10 of 16 channels (ch 1, ch 3, ch 4, ch 6, ch 9, ch 10, ch 12, ch 13, ch 14, and ch 15) during the DCCS task in the TDC group (p < 0.05; upper panel of Figure 5). In contrast, only three channels (ch 6, ch 12, and ch 13) were activated in the ASD group (lower panel of Figure 5).We examined the differences in the mean change in brain activity during the baseline task between the ASD and TDC groups. No significant difference was observed in any channel between the two groups. However, we observed significant (p < 0.05) decreases in activity in ch 4 and ch 5 in the ASD group compared with the TDC group during the DCCS task (Figure 6). Furthermore, we examined the correlation between brain activity and behavior indices. Ch 4 was selected as the region of interest (ROI) because remarkable differences were observed in this channel between the two groups during the DCCS task. As a result, the numerical values for PARS and the activity in ROI using the mean z-scores throughout DCCS task were negatively correlated (infant; r = −0.553, p = 0.040, present; r = −0.714, p = 0.004) in the ASD group (Figure 7).
4. Discussion
4.1. Behavioral Tasks
In the DCCS task, the ASD group provided significantly fewer correct answers and exhibited slower reaction times than the TDC group. In addition, albeit without significance, the ASD group tended to have more prolonged higher numbers of incorrect responses. Consequently, a decline in cognitive shifting was suggested in autistic children, and these findings were consistent with
 (a)
(a)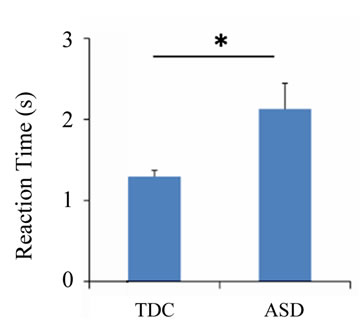 (b)
(b)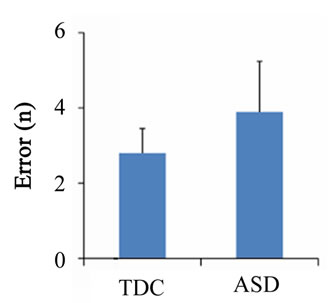 (c)
(c) (d)
(d)
Figure 3. Behavioral results of the dimensional change card sort task. The number of correct answers (a), reaction time (b), number of errors (c), and percentage of correct responses (d) for each group during the task. Error bars indicate the standard error. *p < 0.05; **p < 0.01.
 (a)
(a)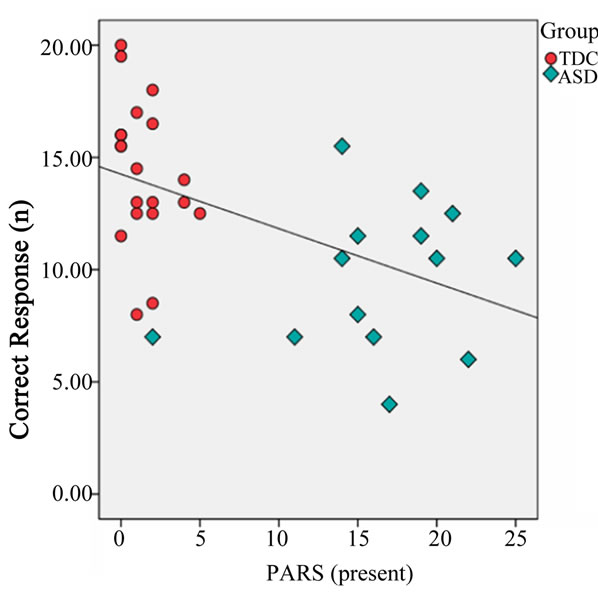 (b)
(b)
Figure 4. Correlation between the number of correct responses and the Pervasive Developmental Disorders Autism Society Japan Rating Scale (PARS infant) (a) and PARS (present) (b). TDC, typically developing children (red circle); ASD, autism spectrum disorder (blue diamond). The x-axis indicates infant score on PARS (a). The x-axis indicates the present score on PARS (b). The y-axis indicates the number of correct response (a, b).
those of previous studies [19,20].
This DCCS task requires the subjects to change their responses frequently according to the stimulus. Thus, it is believed that the correct answers and reaction times reflect the clinical features of persistent and stereotyped behavior in ASD. Moreover, the children grasped the rules of the task because both groups had accuracy rates of >75%.
In other words, the autistic children understood the rules of the task, but their ability of cognitive shifting was determined to be low. Compared with TDC, they tended to require more time to shift to the new rule, thus resulting in a longer reaction time and greater number of incorrect responses.

Figure 5. Time course of near-infrared spectroscopy topography using the mean z-scores from all subjects. The numbers on the first image on the second row indicate the locations of the channels. The left side of the figure indicates brain activities during the baseline task; typically developing children (TDC, upper) and autism spectrum disorder (ASD, lower). The right side of the figure indicates brain activities during the dimensional change card sort task; TDC (upper) and ASD (lower).

Figure 6. Temporal changes in oxygenated hemoglobin (ΔHbO2) levels in the prefrontal area during the baseline and dimensional change card sort tasks (ch 4). Data are presented as the mean for typically developing children (TDC; red line) and autistic spectrum disorder (ASD; blue line) groups.
A negative correlation was observed between the number of correct answers in the DCCS tasks and the severity of ASD as measured by PARS (infant and present). That is, cognitive shifting is likely to be low when ASD severity is high.
Therefore, we used the DCCS task to evaluate cognitive shifting. We believe that we could minimize working memory and specifically evaluate cognitive shifting because the present task uses two classifications (color and
 (a)
(a) (b)
(b)
Figure 7. Correlation of the brain activity in the region of interest (ROI) (ch 4) with the Pervasive Developmental Disorders Autism Society Japan Rating Scale (PARS infant) (a) and PARS (present) (b). ASD, autism spectrum disorder (blue diamond). The x-axis indicates the infant score on PARS (a). The x-axis indicates the present score on PARS (b). The y-axis indicates the brain activity in ROI (a, b).
shape), unlike WCST, which uses three classifications (color, shape, and number) [21]. In addition, language impairment is observed in some instances of ASD [22], but the DCCS task removes this influence because of its simple instructions and rules.
4.2. Executive Function and Theory of Mind
Cognitive shifting is believed to be associated with “theory of mind” (ToM) that shows lack of sociality [23-25]. ToM, which was proposed by Baron-Cohen et al. [26], is the ability of an individual to infer the mental state of others and understand that other people have different beliefs and desires. Baron-Cohen et al. created a task called “Surrey and Ann” and verified whether children could distinguish “phenomenon” from “thinking”. In this task, autistic children had a lower passage rate than TDC [23-25]. Therefore, we need to examine the connection between the DCCS task and the ToM problem; clarify how cognitive shifting is related to various ASD characteristics, excluding stereotyped and persistent behavior; and utilize these findings in ASD treatment.
4.3. Brain Activity
During the baseline task, difference in brain activity was not observed between the ASD and TDC groups, but during the DCCS task, the difference was observed in ch 4 and ch 5. Its domain corresponded to the right lateral prefrontal cortex (LPFC). In a previous investigation, the right LPFC was believed to be responsible for cognitive shifting [13]. In addition, negative correlations were observed between this domain and the two PARS indices (infant and present ASD severity). Thus, it was suggested that the activity of the right LPFC is correlated with ASD severity. In other words, this domain may be related to the stereotyped and persistent behavior seen in ASD.
In addition, using topography, we detected decreased activation of this domain in autistic children during the DCCS task, but not during the baseline task. The right LPFC was reported to be less activated in infants who could not complete the DCCS task [13]. Right LPFC activation was lower in the subjects of this study despite their mean age of 9 years. In fact, right LPFC activation was lower in the study population than in autistic adults [27]. Thus, because improvements in right LPFC activity may not occur during the natural development of autistic individuals, new methods of improving stereotyped and persistent behavior that target other brain areas are required.
4.4. Near-Infrared Spectroscopy System
We used NIRS to measure brain function in this study. The usefulness of NIRS was established by studies of frontal lobe function in children and adults during WCST, and it is believed to have some advantages over functional magnetic resonance imaging (fMRI) [28-31].
However, NIRS detects hemodynamic changes only at the brain surface (approximately 2 cm beneath the skull). Thus, subcortical responses cannot be addressed using NIRS. Moreover, NIRS has a relatively low spatial resolution compared with fMRI; therefore, precise analyses are limited. Despite these shortcomings, NIRS is increasingly becoming a key modality in developmental neuroscience studies involving newborns [32], preschool children [31], and school-aged children [14] because of its excellent safety and robustness against body movements. We believe that the power of executive function can be predicted using NIRS in children who are unable to identify all language characters.
5. Conclusion
Reduced cognitive shifting during the DCCS task was observed in children with ASD compared with TDC. In addition, decreased activity in the right LPFC was identified as a factor potentially responsible for the decline in cognitive shifting. According to these findings, it appears that DCCS is suitable for differentiating the symptoms of ASD from those of other disorders.
6. Acknowledgements
This work was supported in part by the TMC Young Investigator Fellowship and an Intramural Research Grant (22 - 6; Clinical Research for Diagnostic and Therapeutic Innovations in Developmental Disorders) for Neurological and Psychiatric Disorders of National Center of Neurology and Psychiatry (NCNP). This study was also supported by a Grant for Strategic Research Program for Brain Sciences (SSPBS: Project E) by the MEXT (Mizusawa H and Inagaki M), Japan. We thank the parents and children who participated in the study. We also thank the organizers of after-school care program of the Sukage Nursery.
REFERENCES
- American Psychiatric Association, “Diagnostic and Statistical Manual of Mental Disorders,” 4th Edition, American Psychiatric Association, Washington DC, 2000.
- B. A. Boyd, M. McBee, T. Holtzclaw, G. T. Baranek and J. W. Bodfish, “Relationships among Repetitive Behaviors, Sensory Features, and Executive Functions in High Functioning Autism,” Research in Autism Spectrum Disorders, Vol. 3, No. 4, 2009, pp. 959-966. doi:10.1016/j.rasd.2009.05.003
- F. Happe and A. Ronald, “The ‘Fractionable Autism Triad’: A Review of Evidence from Behavioural, Genetic, Cognitive and Neural Research,” Neuropsychology Review, Vol. 18, No. 4, 2008, pp. 287-304. doi:10.1007/s11065-008-9076-8
- E. L. Hill, “Executive Dysfunction in Autism,” Trends in Cognitive Sciences, Vol. 8, No.1, 2004, pp. 26-32. doi:10.1016/j.tics.2003.11.003
- B. F. Pennington and S. Ozonoff, “Executive Functions and Developmental Psychopathology,” Journal of Child Psychology and Psychiatry, and Allied Disciplines, Vol. 37, No. 1, 1996, pp. 51-87. doi:10.1111/j.1469-7610.1996.tb01380.x
- H. M. Geurts, S. Vertie, J. Oosterlaan, H. Roeyers and J. A. Sergeant, “How Specific Are Executive Functioning Deficits in Attention Deficit Hyperactivity Disorder and Autism?” Journal of Child Psychology and Psychiatry, Vol. 45, No. 4, 2004, pp. 836-854. doi:10.1111/j.1469-7610.2004.00276.x
- F. Happe, R. Booth, R. Charlton and C. Hughes, “Executive Function Deficits in Autism Spectrum Disorders and Attention-Deficit/Hyperactivity Disorder: Examining Profiles across Domains and Ages,” Brain and Cognition, Vol. 61, 2006, No.1, pp. 25-39. doi:10.1016/j.bandc.2006.03.004
- B. R. Lopez, A. J. Lincoln, S. Ozonoff and Z. Lai, “Examining the Relationship between Executive Functions and Restricted, Repetitive Symptoms of Autistic Disorder,” Journal of Autism and Developmental Disorders, Vol. 35, No. 4, 2005, pp. 445-460. doi:10.1007/s10803-005-5035-x
- S. Ozonoff and J. Jensen, “Brief Report: Specific Executive Function Profiles in Three Neurodevelopmental Disorders,” Journal of Autism and Developmental Disorders, Vol. 29, No. 2, 1999, pp. 171-177. doi:10.1023/A:1023052913110
- S. Ozonoff, D. L. Strayer, W. M. McMahon and F. Filloux, “Executive Function Abilities in Autism and Tourette Syndrome: An Information Processing Approach,” Journal of Child Psychology and Psychiatry, and Allied Disciplines, Vol. 35, No. 6, 1994, pp. 1015-1032. doi:10.1111/j.1469-7610.1994.tb01807.x
- ,H. M. Geurts, S. Verte, J. Oosterlaan, H. Roeyers and J. A. Sergeant, “How Specific Are Executive Functioning Deficits in Attention Deficit Hyperactivity Disorder and Autism?” Journal of Child Psychology and Psychiatry, Vol. 45, No. 4, 2004, pp. 836-854. doi:10.1111/j.1469-7610.2004.00276.x
- P. D. Zelazo, “The Dimensional Change Card Sort (DCCS): A Method of Assessing Executive Function in Children,” Nature Protocols, Vol. 1, No. 1, 2006, pp. 297-301. doi:10.1038/nprot.2006.46
- Y. Moriguchi and K. Hiraki, “NEURAL ORIGIN of Cognitive Shifting in Young Children,” Proceedings of the National Academy of Sciences of the United States of America, Vol. 106, No. 14, 2009, pp. 6017-6021. doi:10.1073/pnas.0809747106
- G. Matsuda and K. Hiraki, “Sustained Decrease in Oxygenated Hemoglobin during Video Games in the Dorsal Prefrontal Cortex: A NIRS Study of Children,” Neuroimage, Vol. 29, No. 3, 2006, pp. 706-711. doi:10.1016/j.neuroimage.2005.08.019
- S. Shimada and K. Hiraki, “Infant’s Brain Responses to Live and Televised Action,” Neuroimage, Vol. 32, No. 2, 2006, pp. 930-939. doi:10.1016/j.neuroimage.2006.03.044
- J. Raven, “Coloured Progressive Matrices: Sets A, Ab, B,” OPP Ltd., Oxford, 1976.
- C. PARS, “Pervasive Developmental Disorders Autism Society Japan Rating Scale [in Japanese],” Spectrum-Shuppansha, Tokyo, 2008.
- Y. Kita, A. Gunji, Y. Inoue, T. Goto, K. Sakihara, et al., “Self-Face Recognition in Children with Autism Spectrum Disorders: A Near-Infrared Spectroscopy Study,” Brain Development, Vol. 33, No. 6, 2011, pp. 494-503. doi:10.1016/j.braindev.2010.11.007
- G. S. Dichter, K. J. Radonovich, L. M. Turner-Brown, K. S. L. Lam, T. N. Holtzclaw, et al., “Performance of Children with Autism Spectrum Disorders on the DimensionChange Card Sort Task,” Journal of Autism and Developmental Disorders, Vol. 40, No. 4, 2010, pp. 448-456. doi:10.1007/s10803-009-0886-1
- L. Van Eylen, B. Boets, J. Steyaert, K. Evers, J. Wagemans, et al., “Cognitive Flexibility in Autism Spectrum Disorder: Explaining the Inconsistencies?” Research in Autism Spectrum Disorders, Vol. 5, No. 4, 2011, pp. 1390- 1401. doi:10.1016/j.rasd.2011.01.025
- T. D. Watson, A. Azizian and N. K. Squires, “Eventrelated Potential Correlates of Extradimensional and Intradimensional Set-Shifts in a Modified Wisconsin Card Sorting Test,” Brain Research, Vol. 1092, No. 1, 2006, pp. 138-151. doi:10.1016/j.brainres.2006.03.098
- M. M. Kjelgaard and H. Tager-Flusberg, “An Investigation of Language Impairment in Autism: Implications for Genetic Subgroups,” Language and Cognitive Processes, Vol. 16, No. 2-3, 2001, pp. 287-308. doi:10.1080/01690960042000058
- D. Frye, P. D. Zelazo and T. Palfai, “Theory of Mind and Rule-Based Reasoning,” Cognitive Development, Vol. 10, No. 4, 1995, pp. 483-527. doi:10.1016/0885-2014(95)90024-1
- J Russell, “Agency: Its Role in Mental Development?” 1st Edition, Psychology Press, Hove, 1996.
- P. D. Zelazo, S. Jacques, J. A. Burack and D. Frye, “The Relation between Theory of Mind and Rule Use: Evidence from Persons with Autism-Spectrum Disorders,” Infant and Child Development, Vol. 11, No. 2, 2002, pp. 171-195. doi:10.1002/icd.304
- S. Baron-Cohen, A. M. Leslie and U. Frith, “Does the Autistic Child Have a ‘Theory of Mind’?” Cognition, Vol. 21, No. 1, 1985, pp. 37-46. doi:10.1016/0010-0277(85)90022-8
- K. M. Shafritz, G. S. Dichter, G. T. Baranek and A. Belger, “The Neural Circuitry Mediating Shifts in Behavioral Response and Cognitive Set in Autism,” Biological Psychiatry, Vol. 63, No. 10, 2008, pp. 974-980. doi:10.1016/j.biopsych.2007.06.028
- M. Sanefuji, Y. Takada, N. Kimura, H. Torisu, R. Kira, Y. Ishizaki and T. Hara, “Strategy in Short-Term Memory for Pictures in Childhood: A Near-Infrared Spectroscopy Study,” Neuroimage, Vol. 54, No. 3, 2011, pp. 2394-2400. doi:10.1016/j.neuroimage.2010.09.090
- M. L. Schroeter, S. Zysset, M. Wahl and D. Y. von Cramon, “Prefrontal Activation Due to Stroop Interference Increases during Development—An Event-Related fNIRS Study,” Neuroimage, Vol. 23, No. 4, 2004, pp. 1317-1325. doi:10.1016/j.neuroimage.2004.08.001
- S. Sumitani, T. Tanaka, S. Y. Tayoshi, K. Ota, N. Kameoka, et al., “Activation of the Prefrontal Cortex during the Wisconsin Card Sorting Test as Measured by Multichannel Near-Infrared Spectroscopy,” Neuropsychobiology, Vol. 53, No. 2, 2006, pp. 70-76. doi:10.1159/000091722
- S. Tsujimoto, T. Yamamoto, H. Kawaguchi, H. Koizumi and T. Sawaguchi, “Prefrontal Cortical Activation Associated with Working Memory in Adults and Preschool Children: An Event-Related Optical Topography Study,” Cerebral Cortex, Vol. 14, No. 7, 2004, pp. 703-712. doi:10.1093/cercor/bhh030
- Y. Otsuka, E. Nakato, S. Kanazawa, M. K. Yamaguchi, S. Watanabe, et al., “Neural Activation to Upright and Inverted Faces in Infants Measured by Near-Infrared Spectroscopy,” Neuroimage, Vol. 34, No. 1, 2007, pp. 399- 406. doi:10.1016/j.neuroimage.2006.08.013