Materials Sciences and Applications
Vol.4 No.8A(2013), Article ID:35817,11 pages DOI:10.4236/msa.2013.48A004
Analytical and Experimental Studies of Liquid and Gas Leaks through Micro and Nano-Porous Gaskets
![]()
Mechanical Engineering Department, Ecole de Technologie Superieure, Montreal, Canada.
Email: *hakim.bouzid@etsmtl.ca
Copyright © 2013 Lotfi Grine, Abdel-Hakim Bouzid. This is an open access article distributed under the Creative Commons Attribution License, which permits unrestricted use, distribution, and reproduction in any medium, provided the original work is properly cited.
Received April 26th, 2013; revised June 18th, 2013; accepted June 30th, 2013
Keywords: gasket; leak measurement; mico and nano-flow; prediction; porous media
ABSTRACT
The reliability of industrial installation requires minimum leakage of pressurized sealed joints during operation. At the design stage, the leakage behavior of the gasket must be one of the most important parameter in the gasket selection. The objective of the work presented in this paper is to develop an analytical leak rate prediction methodology used in gasketed joints. A pseudo analytical-experimental innovative approach was used to estimate the characteristics of the porous structure for the purpose of predicting accurate leak rate through gaskets with different fluids under conditions similar to those of operation. The analytical model assumes the flow to be continuum but employs a slip boundary condition on the leak path wall to determine the porosity parameters of the gasket. The analytical model results are validated and confronted against experimental data which were conducted under various conditions of fluid media, pressure, gasket stress and temperature. Two experimental test rigs fully automate that accurately reproduces the real leakage behavior of the gasketed joint have been developed to analyze the mechanical and thermal effects on the gasket flow regime. The gas leaks were measured with multi-gas mass spectrometers while liquid leaks were measure using a sophisticated detection system based on the pressure rise method.
1. Introduction
Most industrial installations use gasketed joints to connect pressurized vessels and piping components. These joints are prone to leakage that can cause accidents, environment damage and considerable loss in revenue. The study of leaks through gaskets at the micro and nano scales is much less advanced because the concern is to avoid catastrophic leak failures and to a lesser extent to reduce fugitive emissions. From this stand point, it seems unrealistic to consider the prediction of leaks at the micro and nano levels. However, nowadays due to the above mentioned considerations and the strict environmental regulations worldwide, achieving near zero-leak pressurized joints has become a challenging task for design engineers. Consequently, there is a need to better understand leaks through nano-porous media and in particular through tight gaskets.
For the last decade, some progress has been made to understand the leakage behavior of bolted flange joints by analyzing the fluid flow through porous gasket materials and to develop analytical models to predict leaks [1- 4]. However, these models are not representative of the true gasket porous behavior and have some restrictions in their use. The identification of the flow regime, the determination of the porosity parameters inherent to the gasket material, the effect of fluid type and the multiphase flow and their variation during the operating conditions are not taken into account.
A very limited work has been done on liquid leak rates through porous gasket materials. The difficulty of making leak predictions for liquid media, based on known measured leak behavior with gas, is scientifically recognized, however, a solution has yet to be found. The problem is that the measurement of very small volumetric flow rate for liquid below 0.001 ml/s is not feasible with commercially available instruments. Among the few studies that have focused on the understanding and testing of liquid leaks through porous materials are those in [5-7].
Although, some analytical studies are based on sophisticated modeling and simulation with the Monte Carlo method [8,9], percolation theory and molecular dynamic [10], their application to gasket is limited. The various models and their experimental validation are related to the prediction of fluid mass flow rate at room temperature, using a single capillary tube of known dimensions. In addition, the models described in the literature [11-14] do not consider a porous media and different size capillaries that can range from macro down to nano levels. The available experimental studies on different gaskets are conducted on test rigs that operate at room temperature. The viscosity ratio is the simple correlation used to predict leak with different fluids based on leaks of a reference fluid. The measurement of the change in porous structure at high temperature is difficult to achieve in a test rig. The prediction of leakage at high temperature requires not only the gasket porous structure to be known, but also the fluid properties change with temperature and the interaction between the fluid and the gasket porous material. The fluid density, the dynamic viscosity, the surface tension and the multi-phase flows are to name few [15,16].
In this study, the analytical models and an experimenttal approach for accurately predicting flow leak in the gaskets were proposed. The analytical models are based on fluid flow through porous media from the theory of Navier-Stokes associated with boundary conditions well defined. The internal structure of the gasket was modeled either by bundle of capillaries of uniform diameter or a set of rectilinear annular layers. The work presented is divided into three parts. The first part proposes an analytical model that predicts the leakage of various gases based on leakage measurements of a reference gas from which the porosity parameters of the gasket are deduced in isothermal steady conditions and ambient temperature. The second part of this study aims to extend the range of validity of the theoretical models based on the slip flow regime, while considering the effect of increasing the temperature on the level of gasket sealing. The change of porosity of the gasket material and the fluid viscosity with temperature are the two main parameters that affect the level of leakage tightness at high temperature. The temperature range considered here is between 20˚C and 230˚C for gas tests. In the last part of this study, liquid leaks at room temperature in the slip flow regime through gaskets are treated both analytically and experimentally. A device for measuring small leaks with liquids was developed to achieve this part of the study. Water is selected as the primary working fluid while Kerosene is used for comparison.
2. Theoretical Modeling
The analytical solution of the Navier Stoke equations with the first order velocity slip condition in circular channels or parallel plates can be used to evaluate the mass leak rate through the porous gasket. The hypothesis and simplified conditions used in conjunction with the models can be summarized as; the flow is assumed to be locally fully developed, permanent and isothermal and only the component of the velocity in the radial direction is taken into account [11,12]. The exploitation of the experimental results used with the analytical models leads to determination the unknown porosity parameters of the gasket.
The main differentiating scale flow regime is the Knudsen number Kn. This number is defined as the ratio of mean free path λ of molecules on a characteristic length L of flow [13]:
 (1)
(1)
In addition to the laminar and molecular flow regimes there is an intermediate flow regime, known as the slip flow regime for which a Knudsen number ranges between 10−3 < Kn < 10−1. Within this range and therefore this regime, the Navier-Stokes equations can still be applied provided a correction factor is applied due the speed jump and temperature at the walls [15]. These can be determined from local analysis of momentum and energy dissipation at the wall.
The equation of conservation of momentum in cylindrical coordinates for an ideal gas, without taking into account the effect of inertia or for a low Reynolds number with a large L/D [16], reduces to:
 (2)
(2)
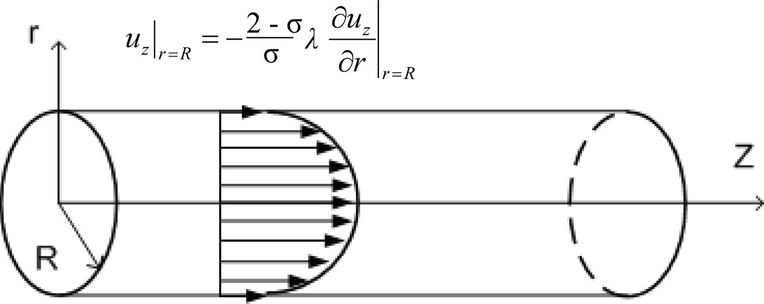
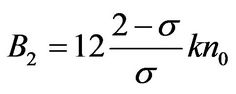
where, P is the pressure, μ is the dynamic viscosity, uz is the radial velocity, z and r are the axial and radial coordinates, respectively (see Figure 1(a)).
2.1. Gas Leak Flow Model
In case of an isothermal gas flow and without displacement at the wall established in a micro tube of circular section, the first order boundary condition is [17]:
 (3)
(3)
2.1.1. Capillary Model (Model 1)
A porous domain such as a gasket is represented by a set of parallel capillaries of uniform diameter D as shown in Figure 1(a). The equations of Navier-Stokes for the case of flow through micro-tubes in circular cross section are used. If a constant relation Kn P = Kno Po is supposed together with the length of the capillary equals the gasket width, the mass leak rate for a compressible fluid is given where N and R are respectively the number and radius of
(a)
 (b)
(b)
Figure 1. Capillary mode. (a) Gas prediction; (b) Liquid prediction.
as follows:
 (4)
(4)
capillary of the porous gasket, Π is the ratio of the inlet over outlet pressures and σ is the tangential momentum accommodation coefficient which has a value of 1 in this case because the model assumes that the reflection of molecules at the wall is fully diffuse.
2.1.2. Annular Model (Model 2)
The different hypotheses used in the first model for determined the analytical expression of the mass flow rate are applicable for the annular model. The gasket porous material is simulated by two parts; one part made of several annular and parallel layers that represent the voids and through which the flow occurs and the other one is a solid substance through which there is no flow as shown in Figure 2. Therefore the mass leak rate of a gas through two annular and parallel plates is given by the following equation [16]:
 (5)
(5)
where N is number of parallel plate and h is the thickness of the void layer. When the temperature is increased, not only the gasket porous structure is affected but also the fluid viscosity decreases. Both parameters have a direct influence the mass flow rate through the gasket. The dynamic viscosity change with temperature is given by the following expression [17]:

Figure 2. Annular model.
 (6)
(6)
where w, is the viscosity index which depends on the type of the gases, µref and tref are respectively the viscosity and the temperature at standard conditions. Liquid leak model
2.2. Liquid Flow Model
In the case of an incompressible Newtonian fluid, the flow through the gasket material can also be modeled by a set of uniform and straight capillaries. The volumetric flow rate is obtained from the Navier-Stokes equations associated with the first order velocity slip conditions shown in Figure 1(b) and are given by:

and
 (7)
(7)
where Ls is the length of slip in the wall. Considering these conditions, the volumetric flow rate of a liquid in micro-channels having a circular cross section is given by the following equation:
 (8)
(8)
where Pi−Po is the pressure drop across the gasket width.
2.3. Exploitation of the Theoretical Models
The leak predictions given by Equations (4), (6) and (8) can only be possible if the number of capillaries and their radius or the number of void plates and their thickness be known. Based on the mass leak rate measurements with a reference gas and these equations one can work back to evaluate these parameters (N, R for the capillary model and N, h for the annular model) necessary for the prediction of the mass leak rate for other gases and liquids. The analytical expression of the mass flow rate for the two models can be rearranged to obtain an equation in terms of the two parameters A and B, such that:
for the capillary model
 (9)
(9)
For the annular model
 (10)
(10)
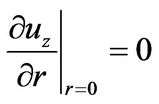
Equations (9) and (10) represents a linear equation of A1 and A2 as a function of the inverse dimensionless mean pressure 2/(Π+1) with Π = Pi/Po. A1, A2, B1, B2 are given by:
 ,
, 
 ,
,  (11)
(11)
It is important to note that the above approach to evaluate the porosity parameter with a reference gas is also used for liquid leak predictions. For each level of gasket stress and temperature, the mass leak rate of the reference gas at various increasing pressures is measured. A linear regression of Equation (9) and (10) is performed to obtain the hydraulic diameter DH = 2R or 4h and the number of capillaries or layers N depending on the model considered. For each stress level the equivalent thickness of the voids is calculated for the two different models. This is defined as the thickness that the voids would occupy if the gasket is separated into two layers one made of the dense material and the other made of voids. This is given for the capillary model as
 (12)
(12)
and for the annular model as
 (13)
(13)
3. Experimental Set-Up
Two experimental test rigs were used to characterize the gasket porosity parameters under different working conditions and validate the different analytical models. These two rigs are known as the ROom Temperature Tightness test machine (ROTT) and the Universal Gasket Rig (UGR). The first rig is used to characterize the sealing performance of gaskets used with different gases at room temperature. The second rig is used to test gaskets with gases and liquids at high temperature. The two arrangements compress gasket between two raised face flanges allowing the axial compression of the gasket. The test benches have basically three systems; the pressure system, the leak detection system and the hydraulic system as shown in Figures 3 and 4.
In the experimental ROTT machine, the gasket is compressed between two NPS 4 class 900 weld-neck flanges by means of 8 hydraulic bolt tensioners of a total load capacity of 400,000 lb. Four LVDT (Linear Velocity Displacement Transducer) are used to measure gasket deflection and flange rotation. The assembly is rigid so as to provide a fairly uniform distribution of contact stress across the gasket width. The leak detection system uses the pressure decay and the pressure rise methods, a mass spectrometer and a residual gas analyser. In this apparatus, the main parameters such as gasket stress, gasket displacement, internal pressure, temperature and time are monitoring via a Labview program.
The UGR machine consists of rigid platens through which passes a central stud as shown in Figure 4. The load is applied through a hydraulic bolt tensioner using a hand pump. Depending on the fluid used, there are two leak detection systems one for liquids the other one for gases. A ceramic band heater is deployed to heat the gasket to the required temperature using a PID controller (see Figure 4). The rig includes a manual pressure regulator, two pressure sensors; one to measure the inlet pressure and the other one to measure the leak chamber pressure, thermocouples, a data acquisition and control system and a PC. For liquid leaks, measurement of verysmall volumetric flow rate below 0.001 ml/s is not feasi-

Figure 3. ROTT test machine.

Figure 4. a) Universal Gasket Rig; b) Liquid leak measurement set-up.
ble with commercially available flow meters. Therefore a homemade device was developed. It is based on the monitoring of the pressure rise of a small confined known volume of gas in the leak collecting chamber filled with the same liquid as shown in Figure 5.
Gaskets used during testing are expanded graphite sheet and PTFE sheet both 1/8” thick. The ROTT test gasket specimens have inner and outer diameters of 4.875” and 5.875” respectively while the UGR test specimens are 2” by 3” respectively. The gases used in this study are helium (He), air, argon (Ar) and nitrogen (N2) the properties of which are shown in Table 1. This choice is justified because helium is the reference gas used in the ROTT test under adoption by ASTM F03 committee on gaskets, while other gases have a variety of molecular weights and kinematic viscosities. For liquid leakage testing, water is selected as the primary working fluid while kerosene is used for comparison.

Figure 5. Liquid leak measurement method.

Table 1. Molecular weight and mean free path of gases tested.
Argon was used to characterize the porosity parameters for liquid leak tests. To validate the theoretical approach, the measured leak rates were conducted at different contact stresses, temperatures and pressure levels as summarized in Table 2. The high temperature leak tests require a new gasket every time the load is increased. This is because the internal structure is modified when the temperature is increased within a specific load level. It is interesting to note that the prediction of mass leak rates can better be evaluated using gasket deformation rather than gasket stress.
4. Results and Discussion
Test results with helium at the different contact pressures, temperatures and pressures conducted on the graphite sheet gasket are shown in Figure 6. The leak rates are plotted against pressure in a log-log scale for convenience. As expected, the leak decreases with increased contact stress and temperature. These results serve as the basis to plot the dimensionless porosity parameter A against the reciprocal pressure ratio 2/(Π + 1), as shown in Figure 7. These curves are used to determine the porosity parameters 2R or 4h and N required for the leakage prediction of other gazes. For the first model the intercept of the line A1 gives NR4 as per Equation (8) whereas the slope of same line gives B1NR4 and hence B1 is obtained.

Table 2. Experimental test program.

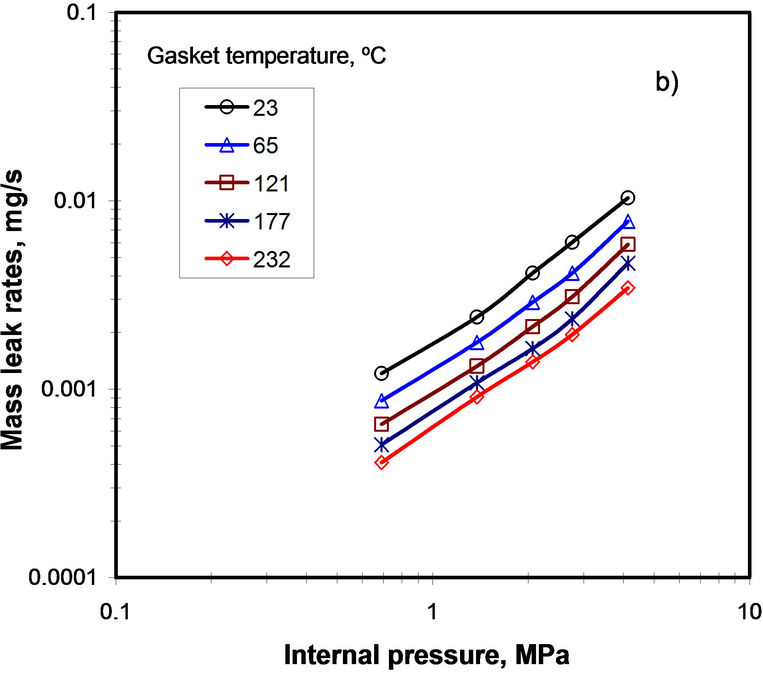
Figure 6. a) Helium mass leak rate measurements Gasket stress a) 6.9 MPa; b) 27.6 MPa.
The Knudsen number is then obtained from Equation (9) using the tangential momentum accommodation factor σ equal to 1 which is the case for most engineering applications [15]. Knowing the mean free path for the used gas the hydraulic diameter D = 2R can be deduced. Finally the number of capillaries N is obtained. A similar approach can be used to determine the void layer thickness h and the number of parallel plates N. This approach to determine the porosity parameters can be applied to every contact stress level and temperature the data of which is obtained from Figure 6. The same approach is used for liquid leaks predictions by taking Argon as a gas this time to characterize the gasket porosity at different contact stress levels. The comparison of the mass flow rates measured and the calculated value with the two different analytical models Equations. 4 and 5 for different inlet gas pressures and fixed gasket stress levels are shown in Figure 8. It is to be noted that the leak curves obtained at room temperature with helium in Figures
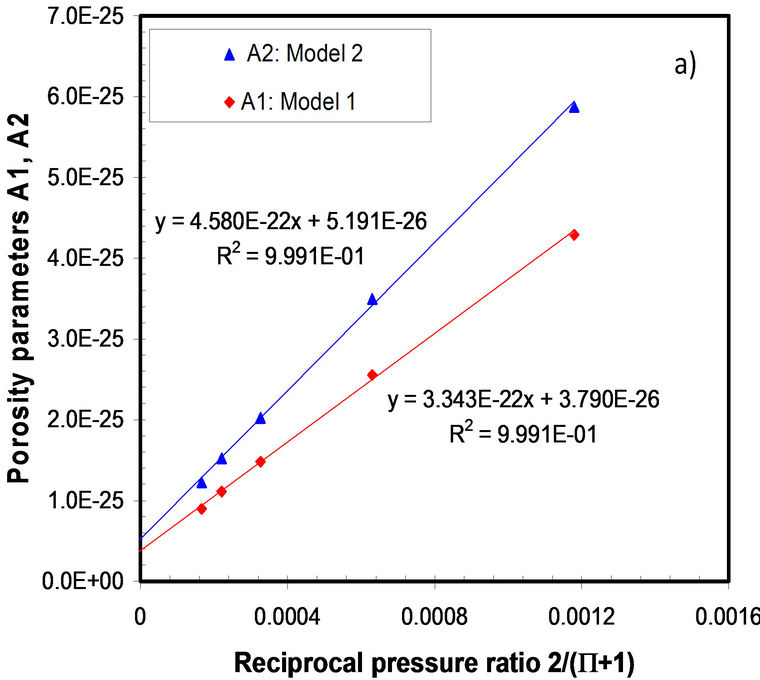

Figure 7. A1 and A2 vs the reciprocal pressure ratio; a) Sg = 55.17 MPa, b) Sg = 82.76 MPa at room temperature.
8(a)-(c) are used to predict the leak rates with Air, Argon and Nitrogen with the two models. In Figures 9 and 10 comparisons are made with the high temperature test


Figure 8. Gas correlation: PTFE at 27.6 MPa; a) N2; b) Ar; c) Air.


Figure 9. Leak liquid measurements and predictions a) Water; b) Kerosene.
results using Nitrogen and Equation (4) and with the liquid test results using water and Kerosene at room temperature and Equation (8). Globally, the general trend shows that the leak rate is quasi linear with pressure in log-log scale and this appears to be the case for the different stress and temperature levels. Referring to Figure 8, for gas leak prediction at room temperature, the experimental data shows that at the high leak range of about 10−4mg/s, the slip flow model matches very well with the experimental data whereas in the low leak range of about 10−6 mg/s and the molecular flow model gives better predictions. The maximum error found with the molecular model is about 11% and this is for the low leak range of about 10−6 to 10−7mg/s. The maximum error with the slip flow regime is 20 % for the high flow range of about 10−4 to 10−5 mg/s of mass leak rate. Nevertheless, the theoretical liquid leak predictions are 40% to 70% higher than the experimental leak measurements depending on the liquid pressure and the level of the gasket stress (see Figure 9). This difference can be explained by the presence of the surface tension at low porosity and


Figure 10. Nitrogen leak measurements and predictions a) 6.9 MPa; b) 27.6 MP.
the interfacial leak between the gasket and flange contact surfaces at the low stress level. However, considering field applications for which these developed models are applied, it can be conclude that a reasonable agreement between the predictions and the experimental results exists. It is to be noted that high temperature tests show lower leak rates. This is because the gasket compression increases with temperature making the pores smaller and therefore the micro-channels diameter decreases letting less flow through them (see Figure 10). For both models Equations (4) and (5), it is found that when the stress and temperature is increased the gasket thickness and hence diameter of leak paths or the thickness of the void layers decreases while the number of the micro paths or void layers remains relatively constant.
This change of the hydraulic diameter affects the flow regime because the Knudsen number which is known in terms of hydraulic diameter is changed. As an example, for 27.6 MPa of gasket stress, when the temperature increases from 23 to 232˚C gasket compression increases by 11%. Therefore there are two parameters responsible for gasket porosity change; these are the load and the temperature. However, in practice creep and degradation due to aging are two other important parameters to consider that can change the gasket porosity at the long term. The experimental results of Figure 11 show clearly the relationship between the leak and gasket thickness change produced by load and temperature.
In order to validate the slip flow assumption, Knudsen number was evaluated using the gasket grid flow and the mean free path for the used gas at the inlet pressure using Equation (1), as shown in Table 3. The range presented in this table includes early the slip flow regime in addition to the molecular regimes. With reference to the high Knudsen number, at low gas pressure, the experimental data obtained are in a good agreement with the leak rate values calculated by the molecular flow regime equation. Therefore in the range of about 10−6 mg/s the flow is governed by the molecular regime and when the Knudsen number start to decrease and this for high range of mass leak rate above 10−4 mg/s, the slip regime is more suitable for predicting leakage. Figure 12 presents the comparison of the measured and predicted mass flow rates for different values of inlet Knudsen number and a fixed stress level. It can be seen that the experimental
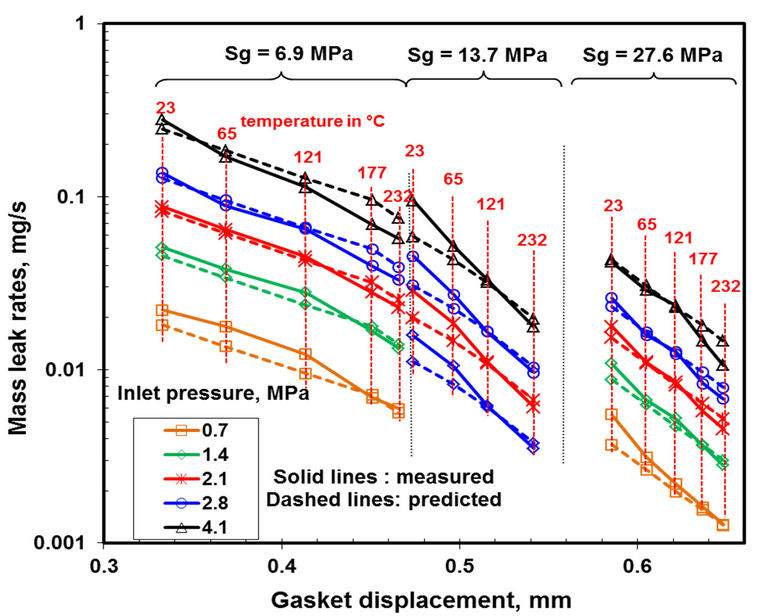
Figure 11. N2 mass leak rates vs gasket displacement at different temperatures and inlet pressures.

Table 3. Knudsen number range.
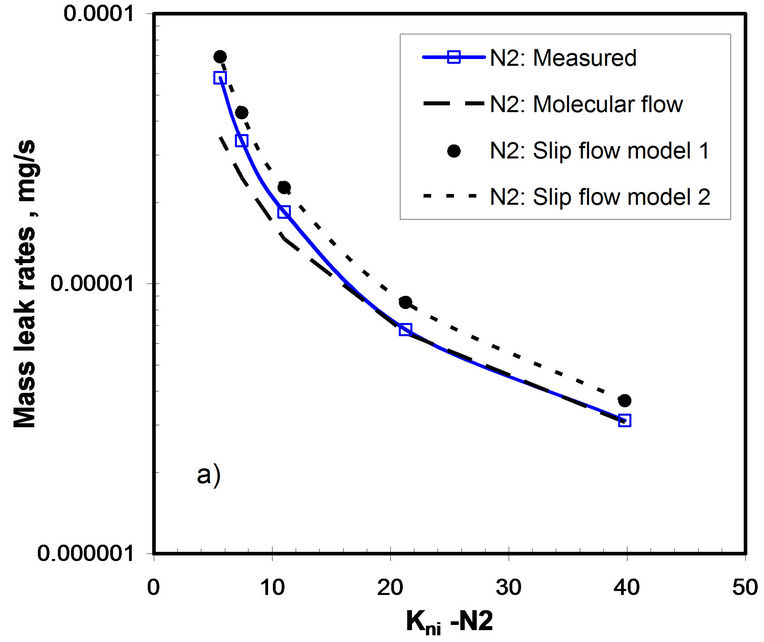
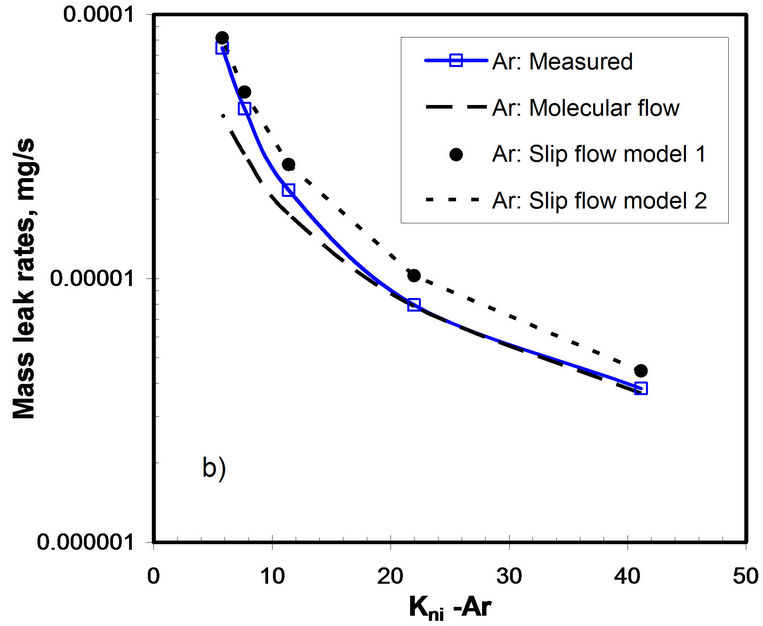

Figure 12. Mass leak rates vs Kni; PTFE at 27.59 MPa; a) for Nitrogen, b) for Argon, c) for Air.
curve lies between the two flow regimes. At the low Knudsen number the slip flow regime is present whereas at the high Knudsen number the molecular flow regime governs. The presentation of the mass leak rate versus Knudsen number shows the transition from molecular to slip flow regimes as the pressure is increased.
In general, below a Knudsen number of 10 at the inlet, a slip flow regime is present and above 30, a molecular flow regime predominates. Figure 13(a) shows a linear variation between the measured volumetric leak rate and the thickness of the voids for Nitrogen and Helium. The voids are calculated at the inner radius of the gasket based on the hydraulic diameter and the number of micro-channels. In Figure 13(b), it is shown that when the increase of load produces no increase in tightness and therefore no decrease in leak rate, the phenomenon of tightness hardening is present. In this figure also, a plateau which shown the equivalent thickness of the void layer versus a gasket stresses is presented. This phenomenon is much presented with most gasket materials and in particular with PTFE gaskets. Figure 14 shows the variation of the two parameters plotted as function of

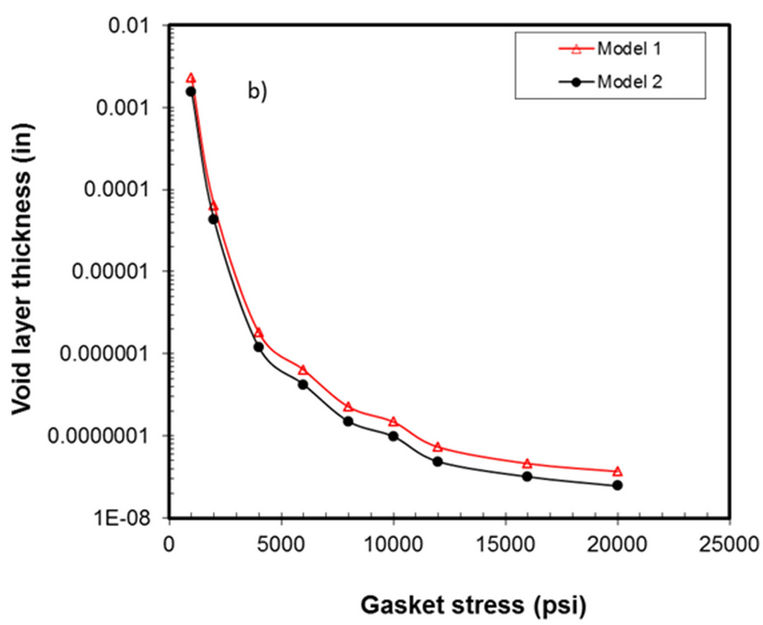
Figure 13. a) Mass leak rates vs void thickness at 6.9 MPa; b) Void thickness vs Stress.

Figure 14. Porosity parameters vs gasket stress.
gasket stress. Using these curves, the capillary size and number under a specific stress can be obtained to predict the leak rate for a fluid using the mass flow equation.
5. Conclusion
The development of new materials for gasket products such as PTFE and graphite sheet requires an accurate prediction of the rarefied flow through their porous structure, and sophisticated techniques to measure very low mass flow rates. The gasket pore size and their number change with load and temperature service. In this work, a methodology leading to the prediction of liquid and gas leaks based on the porosity parameters estimation is presented. In general, the theoretical predictions are reasonably in good agreement with the experimental measurements. The flow through porous gaskets is shown to be between the slip flow regime and to the free-molecular regime depending on load and pressure. Depending on the Knudsen number the corresponding models could be used to predict mass flow rates based on leaks with a referenced gas. For liquid leak prediction, the discrepancy can be explained by the fact that the theoretical model assumes that the complete flow passes through the porous gasket whereas in practice some interfacial leak is present at very low stress levels. Based on the results, the prediction of leak rates at room temperature and elevated temperatures with different fluids can be reasonably accurate provided the gasket internal structure size is known. It is found that the leak rate is closely related to the equivalent thickness of the void layer and saturation or tightness hardening occurs when this layer does not change with load.
REFERENCES
- V. Masi, A.-H. Bouzid and M. Derenne, “Correlation between Gases and Mass Leak Rate of Gasketing Materials,” Proceedings of the 1998 ASME/JSME PVP Conference, San Diego, 23-27 July 1998, pp. 17-24.
- P. Jolly and L. Marchand, “Leakage Predictions for Static Gasket Based on the Porous Media Theory,” Journal of Pressure Vessel Technology, Vol. 131, No. 2, 2006, Article ID: 021203. doi:10.1115/1.3008031
- L. Marchand, M. Derenne and V. Masi, “Predicting Gasket Leak Rates Using a Laminar-Molecular Flow Model,” Proceedings of the ASME Pressure Vessels and Piping Conference, Denver, 17-21 July 2005, pp. 87-96.
- T. Kobayashi, “Measurements and Evaluation of Sealing Behavior of Gaskets Based on the Test Method HPIS Z104 Proposed in Japan, in ASME,” 2007 Proceedings of the ASME Pressure Vessels and Piping Conference, San Antonio, 22-26 July 2007, pp. 217-222.
- J. C. Vignaud and T. Massart, “Mesure et Calcul du Débit de Fuite d'un Joint en eau et Vapeur d'eau-cas D'un Joint en Graphite Expansé Matrice,” Proceedings of the 3rd Symposium on Fluid Sealing of Static Gasketed Joints, Biarritz, 15-17 September 1993, pp. 522-532.
- M. Asahina, T. Nishida and Y. Yamanaka, “Estimation of Sealability with Compressed Fibers Sheet Gaskets for Liquid and Gas Fluid,” Pressure Vessels and Piping Division, PVP Vol. 367, Analysis of Bolted Joints, 1998, pp. 25-34.
- C. Bramsiepe, L. Pansegrau and G. Schembecker, “A Model to Predict Fugitive VOC Emissions from Liquid Charged Flange Joints with Graphite Gaskets,” Chemical Engineering Journal, Vol. 159, No. 1-3, 2010, pp. 11-16, doi:10.1016/j.cej.2010.02.014
- F. Sharipov and J. L. Strapasson, “Direct Simulation Monte Carlo Method for an Arbitrary Intermolecular Potential,” Physics of Fluids, Vol. 24, No. 1, 2012, Article ID: 011 703. doi:10.1063/1.3676060
- H. Xue, Q. Fan and C. Shu, “Prediction of Micro-Channel Flows Using Direct Simulation Monte Carlo,” Probabilistic Engineering Mechanics, Vol. 15, No. 2, 2000, pp. 213-219, doi:10.1016/S0266-8920(99)00023-5
- F. Bottiglione, G. Carbone and G. Mantriota, “Fluid Leakage in Seals: An Approach Based on Percolation Theory,” Tribology International, Vol. 42, No. 5, 2009, pp. 731- 737. doi:10.1016/j.triboint.2008.10.002
- J. C. Harley, Y. Huang, H. H. Bau and J. N. Zemel, “Gas Flow in Micro-Channels,” Journal of Fluid Mechanic, Vol. 284, 2006, pp. 257-274.
- Z. Y. Guo and X. B. Wu, “Further Study on Compressibility Effects on the Gas Flow and Heat Transfer in a Microtube,” Nanoscale and Microscale Thermophysical Engineering, Vol. 2, No. 2, 1998, pp. 111-120. doi:10.1080/108939598200024
- A. K. Sreekanth, “Transition Flow through Short Circular Tubes,” Physics of Fluids, Vol. 8, No. 11, 2004, pp. 1951-1956. doi:10.1063/1.1761142
- S. Colin and L. Baldas, “Effets de Rarefaction Dans les Micro-Ecoulements Gazeux,” Comptes Rendus Physique, Vol. 5, No. 5, 2004, pp. 521-530. doi:10.1016/j.crhy.2004.04.005
- G. Karniadakis, A. Beskِk and N. R. Aluru, “Microflows and Nanoflows: Fundamentals and Simulation,” Springer, New York, 2005.
- S. G. Kandlikar, “Heat Transfer and Fluid Flow in Minichannels and Microchannels,” Elsevier Ltd, New York, 2006.
- T. Ewart, P. Perrier, I. Graur and J. Gilbert Meolans, “Mass Flow Rate Measurements in Gas Micro Flows,” Experiments in Fluids, Vol. 41, No. 3, 2006, pp. 487-498. doi:10.1007/s00348-006-0176-z
NOTES
*Corresponding author.