 Food and Nutrition Sciences, 2013, 4, 69-78 http://dx.doi.org/10.4236/fns.2013.49A2010 Published Online September 2013 (http://www.scirp.org/journal/fns) Physico-Chemical Properties of Milk Whey Protein Agglomerates for Use in Oral Nutritional Therapy Luciano Bruno de Carvalho-Silva1,2*, Fernanda Zaratini Vissotto3, Jaime Amaya-Far fan2 1Faculty of Food Engineering, University of Campinas, Campinas, Brazil; 2School of Food Engineering, University of Campinas, Campinas, Brazil; 3Cereal and Chocolate Technology Center, Institute of Food Technology, Campinas, Brazil. Email: *luciano@unifal-mg.edu.br Received June 27th, 2013; revised July 27th, 2013; accepted August 4th, 2013 Copyright © 2013 Luciano Bruno de Carvalho-Silva et al. This is an open access article distributed under the Creative Commons Attribution License, which permits unrestricted use, distribution, and reproduction in any medium, provided the original work is properly cited. ABSTRACT Agglomerates based on milk whey proteins and modified starch (MS) were developed for patients with dysphagia. Cal- cium caseinate (CaCas), whey protein isolate (WPI), concentrate (WPC) and hydrolysate (WPH) were used. The sources were agglomerated with the MS and an increase in the porosity and viscosity of the agglomerates were ob- served. In all the systems evaluated, the WPI agglomerate at a concentration of 112 g/L showed a viscosity between 2122 and 5110 cP, and the agglomerates of WPC and WPH between 1115 - 2880 cP and 2600 - 6651 cP, respectively. CaCas exhibited high values in water and milk of 3200 cP and 6651 cP, respectively, and low values of 640 cP in juice. In sensory tests, the 70% WPI: 30% MS juice obtained a score 6.97, an improvement in relation to the other agglomer- ates, but not differing (p = 0.681) from the commercial thickener, 6.91 (p = 0.380). Based on these results, the 70% WPI: 30% MS was suggested for use in the nutritional therapy of patients with dysphagia. Keywords: Dysphagia; Viscosity; Supplementation; Milk Whey Proteins; Malnutrition 1. Introduction Many of the nutritional complications that occur with dysphagia sufferers are due to the low viscosity of the diet. Fluid liquids are difficult to swallow by patients with reduced deglutition control. This happens because such liquids can be swallowed very quickly and do not maintain any defined shape in the oral cavity, thus al- lowing part of the liquid food to penetrate the airways, which are still open. As a result, accidental, broncho- aspiration will occur, and ensuing pneumonia can worsen the nutritional state of the patient leading to dehydration, as the disease progresses. Proper thickening of the food can minimise such intercurrences [1,2]. In this context and aiming to optimise the nutritional care of dysphagic patients sufferers, the American guide “National Dysphagia Diet: Standardization for Optimal Care” established standards and limits for the variation in viscosity, with the objective of making the diet adequate for patients with compromised swallowing capacity. Such standards and limits do not necessarily represent the expected variation, but serve as a basis for discussion and for an analysis of the prescribed diet. These values are classified in centipoisess (cP) as “thin” (1 - 50 cP— water), “nectar” (51 - 350 cP—mango juice), “honey” (351 - 1750 cP) and “pudding” (>1750 cP) [3]. Ingredients such as milk whey proteins, when chemi- cally or physically modified, can alter the viscosity of food systems. However, on their own, they are unable to reach the viscosity standardised by the American Dietet- ics Association (ADA) [3] for fluids, but agglomerated with carbohydrate sources such as modified starch, they could increase the viscosity of food systems to values close to those cited by the ADA. Based on the high malnutrition indices and difficulty in nutritional handling of patients with dysphagia, the main objective of this study was to develop and sensory test a protein supplement based on milk whey proteins and modified starch, with adequate thickening capacity, for nutritional therapy. 2. Materials & Methods 2.1. Raw Material Whey protein isolate (WPI), concentrate (WPC) and hy- *Corresponding author. Copyright © 2013 SciRes. FNS  Physico-Chemical Properties of Milk Whey Protein Agglomerates for Use in Oral Nutritional Therapy 70 drolysate (WPH) from Glanbia Foods Inc. (Monroe, Wis- consin, USA) were used, donated by Integralmédica Teaching and Research Institute, São Paulo, Brazil; cal- cium caseinate (CaCas) and modified starch (Thick & Easy—Hormel Health Labs). 2.2. Proximate Composition of the Protein Sources The moisture, total solids, ash and protein contents were determined [4]. Total lipids were determined [5], and total per-cent carbohydrates were estimated by difference, subtracting the sum of the values obtained in the other determinations from 100. 2.3. Determination of the Degree of Hydrolysis The degree of hydrolysis (DH) was determined based on the Adler-Niessen [6] method, which consists of the spectrophotometric measurement of the chromophore formed in the reaction between trinitrobenzenesulphonic acid (TNBS) and amino groups, under alkaline condi- tions. After 1 hour of incubation, the reaction was inter- rupted by lowering the pH with 0.1 M HCl. The sample was dispersed in sodium dodecyl sulphate (SDS) and the reaction occurred in 0.2125 M phosphate buffer, pH 8.2 L-leucine (0 to 2.0 mM) was used as the standard and the readings made at 340 nm. 2.4. Solubility of the Protein Sources The protein solubility (% PS) was determined according to the method of Morr et al. (1985). The effects of pH (2.5 to 7.5) were studied for all the protein sources: WPI, WPC, CaCas and WPH. 2.5. Determination of Total Amino Acids The total amino acids were determined by reversed phase liquid chromatography [7] after a 24 h acid hydrolysis step, in 20% HCl plus phenol, followed by derivatisation with phenylisothiocyanate. 2.6. Agglomerate Production Different concentrations of modified starch, calcium ca- seinate and milk whey protein isolate, concentrate and hydrolysate were used. Preliminary physicochemical tests were carried out using modified starch as the standard. Concentrations varying from 10% to 50% protein plus modified starch were tested and evaluated for their viscosity profile. The formulation showing a viscosity closest to that of the commercial thickener was submitted to the process of agglomeration. The formulation selected for this study was 70% protein: 30% modified starch. 2.7. Agglomeration Process Agglomeration of the formulations was carried out using a pilot plant scale model RCR instantiser (capacity of 5 kg) from ICF Industrie S.p.a. (Maranello-MO, Italy). The following parameters were used for agglomeration: round 1.5 m mesh grill, with 50% opening and a rotary dryer at 95˚C with a vapour pressure of 2 bar. After ag- glomeration and cooling, the products were packed into 500 g packages and stored at a temperature of approxi- mately 10˚C. 2.8. Granulometric Distribution The particle size distribution of the protein sources and agglomerated products was determined using the vibra- tory Granutest equipment vibrating for 5 minutes with the 150, 250, 350 and 500 m sieves. The amounts re- tained on each sieve were weighed and expressed as per- centages. 2.9. Water Act i vit y of t he Ag gl ome r at ed P r od uc ts This was determined [4] at zero time (for samples at room temperature). A portable pawkit portable water activity, model 950 NE from Decagon® was used for the measurements. The equipment was calibrated using satu- rated solutions of magnesium and lithium chlorides (wa- ter activities of 0.1 - 0.4) and potassium sulphate (water activity of 0.975). The measurements were made in du- plicate at room temperature (25.5˚C). 2.10. Water Absorption Capacity The water absorption capacity of the protein sources and agglomerated products was measured in triplicate [8,9]. This technique consists of using a horizontal capillary connected to a Buchner funnel by flexible tubing. 100 g-samples were placed on a Whatman n˚ 1 filter paper, and the water absorbed at equilibrium expressed as the mLs of water absorbed/g of protein. 2.11. Bulk Density This was determined in triplicate, based on the definition: the mass of particles occupying a defined volume. The analysis consists of standardising the product distribution, based on the volume it occupies [10], placing 3 g of sample in a 25 mL graduated cylinder with the help of a funnel, thus standardising the distribution and minimis- ing the effects of agglomerate compacting. 2.12. Particle Density This was determined in triplicate using the pycnometer [11], with toluene as the inert liquid (p = 0.866 g·cm−3). Copyright © 2013 SciRes. FNS  Physico-Chemical Properties of Milk Whey Protein Agglomerates for Use in Oral Nutritional Therapy Copyright © 2013 SciRes. FNS 71 2.13. Porosity The porosity (%P) of the protein sources and agglomer- ated products was determined according to Peleg [10]. 2.14. Viscosity The apparent viscosities ( ) were determined in a Brook- field DV—III rheometer with a shear rate of 30 rpm (similar to that obtained in the processes of chewing and swallowing a food), using 30 s reading time and spindles 16, 18 and 31, the results being expressed in centipoises (cP). Protein concentrations of 18 and 28 g were used for women and men respectively, representing 30% of the individual’s needs. The protein sources or agglomerates were added to the following food systems: water, whole UHT milk and commercial orange juice (pH 4.0 and 1.5% total solids). The viscosity was determined in trip- licate at 25˚C. 2.15. Analysis of Preference of the Foods Containing Added Agglomerates Two samples were used: control (juice/milk + commer- cial thickener) and experimental (juice/milk + agglomer- ated products), 18 g and 28 g for women and men, re- spectively. The samples were served to the panellist (pa- tients) individually in a monadic way and balanced order, using 50 mL disposable plastic cups coded with 3 digit algorithms. The participation of the 30 patients in the test was voluntary after agreeing to take part and freely sign- ing a consent form. A 9-cm structured hedonic scale was used [12]. The protocol was approved by the Ethics Committee (n˚ 428/2006) of the University of Campinas School of Medicine. 2.16. Statistical Analyses All the results were analysed by multivariate analysis of variance and the differences amongst the means by Tukey’s test. The software used was the Statistica-Basic Statistics and Tables and SPSS for windows 15.1. 3. Results & Discussion 3.1. Proximate Composition of the Protein Sources With the exception of WPC, all the materials used pre- sented a protein concentration above 80% (Table 1). There was no significant difference in protein content between WPI and WPH. The sample with the lowest protein concentration was WPC. With respect to the lipid content, WPC showed the highest values and there was no significant difference (p = 0.835) between WPI and WPH or between CaCas and WPH. For the ash content, there was a significant difference between WPI and WPC (p = 0.7110); WPI and CaCas (p = 0.673); and between WPC and CaCas (p = 0.742). With respect to moisture content, there was no significant difference (p = 0.0613) between the samples CaCas and WPH, but WPI and WPC were statistically different from the other samples. WPC showed the highest carbohydrate content and WPI the lowest. WPI is obtained by removing the carbohy- drates, lipids and salts from WPC. For this reason, the WPI showed a higher protein concentration and lower carbohydrate and ash contents. 3.2. Determination of the Degree of Hydrolysis The DH found was 10.11 mM·g−1, classified as a protein source of medium degree of hydrolysis (7 to 15 mM·g−1). 3.3. Solubility of the Protein Sources Milk whey protein concentrates and isolates show good solubility throughout a wide range of pH values, tem- peratures, protein concentrations, water activities and ionic strengths [13]. Thus this property was shown to be stable in the various pH ranges applied. With CaCas a decrease in solubility was found at pH values close to the isoelectric point (pH 4.6), as shown in Table 2. In foods, protein solubility is affected by the pH, ionic strength, temperature, solvent polarity, isolation method, processing conditions, interactions with other compo- Table 1. Proximate composition of the protein sources: isolate (WPI), concentrate (WPC) and hydrolysate (WPH) milk whey protein and calcium caseinate (CasCa). Sources Protein (%)1,2,3 Fat (%)1,2,3 Ash (%)1,2,3 Water (%)1,2,3 Carbohydrate (%)2,4 WPI 92.94 ± 0.01a 0.57 ± 0.02b 1.58 ± 0.69ab 4.69 ± 0.03c 0.22 WPC 77.30 ± 0.43c 0.70 ± 0.03a 2.15 ± 0.33a 6.36 ± 0.01a 13.49 CasCa 89.31 ± 0.11b 0.45 ± 0.02c 1.74 ± 0.31a 5.25 ± 0.02b 3.25 WPH 92.38 ± 0.06a 0.51 ± 0.03bc 1.39 ± 0.88b 5.16 ± 0.08b 0.56 1Values correspond to means ( SD) of three determinations; 2Values expressed in dry basis; 3Values not sharing similar letter in the same column are different (p < 0.05) in Tukey test; 4Calculated by difference = 100 – (protein + total far + ash + water). 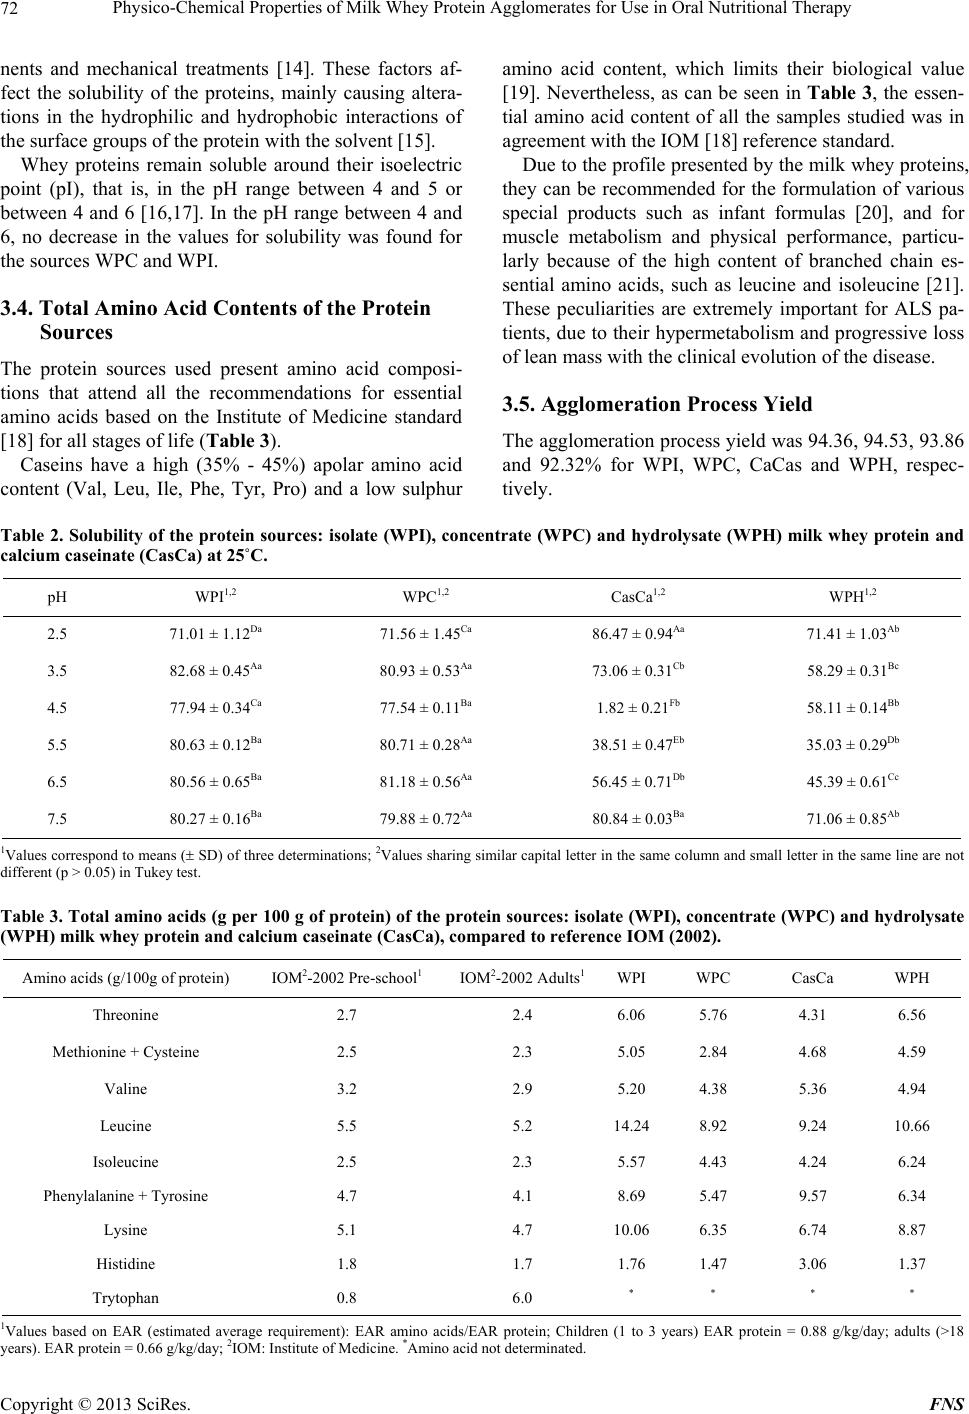 Physico-Chemical Properties of Milk Whey Protein Agglomerates for Use in Oral Nutritional Therapy 72 nents and mechanical treatments [14]. These factors af- fect the solubility of the proteins, mainly causing altera- tions in the hydrophilic and hydrophobic interactions of the surface groups of the protein with the solvent [15]. Whey proteins remain soluble around their isoelectric point (pI), that is, in the pH range between 4 and 5 or between 4 and 6 [16,17]. In the pH range between 4 and 6, no decrease in the values for solubility was found for the sources WPC and WPI. 3.4. Total Amino Acid Contents of the Protein Sources The protein sources used present amino acid composi- tions that attend all the recommendations for essential amino acids based on the Institute of Medicine standard [18] for all stages of life (Table 3). Caseins have a high (35% - 45%) apolar amino acid content (Val, Leu, Ile, Phe, Tyr, Pro) and a low sulphur amino acid content, which limits their biological value [19]. Nevertheless, as can be seen in Table 3, the essen- tial amino acid content of all the samples studied was in agreement with the IOM [18] reference standard. Due to the profile presented by the milk whey proteins, they can be recommended for the formulation of various special products such as infant formulas [20], and for muscle metabolism and physical performance, particu- larly because of the high content of branched chain es- sential amino acids, such as leucine and isoleucine [21]. These peculiarities are extremely important for ALS pa- tients, due to their hypermetabolism and progressive loss of lean mass with the clinical evolution of the disease. 3.5. Agglomeration Process Yield The agglomeration process yield was 94.36, 94.53, 93.86 and 92.32% for WPI, WPC, CaCas and WPH, respec- tively. Table 2. Solubility of the protein sources: isolate (WPI), concentrate (WPC) and hydrolysate (WPH) milk whey protein and calcium caseinate (CasCa) at 25˚C. pH WPI1,2 WPC1,2 CasCa1,2 WPH1,2 2.5 71.01 ± 1.12Da 71.56 ± 1.45Ca 86.47 ± 0.94Aa 71.41 ± 1.03Ab 3.5 82.68 ± 0.45Aa 80.93 ± 0.53Aa 73.06 ± 0.31Cb 58.29 ± 0.31Bc 4.5 77.94 ± 0.34Ca 77.54 ± 0.11Ba 1.82 ± 0.21Fb 58.11 ± 0.14Bb 5.5 80.63 ± 0.12Ba 80.71 ± 0.28Aa 38.51 ± 0.47Eb 35.03 ± 0.29Db 6.5 80.56 ± 0.65Ba 81.18 ± 0.56Aa 56.45 ± 0.71Db 45.39 ± 0.61Cc 7.5 80.27 ± 0.16Ba 79.88 ± 0.72Aa 80.84 ± 0.03Ba 71.06 ± 0.85Ab 1Values correspond to means ( SD) of three determinations; 2Values sharing similar capital letter in the same column and small letter in the same line are not different (p > 0.05) in Tukey test. Table 3. Total amino acids (g per 100 g of protein) of the protein sources: isolate (WPI), concentrate (WPC) and hydrolysate (WPH) milk whey protein and calcium caseinate (CasCa), compared to reference IOM (2002). Amino acids (g/100g of protein) IOM2-2002 Pre-school1 IOM2-2002 Adults1WPI WPC CasCa WPH Threonine 2.7 2.4 6.06 5.76 4.31 6.56 Methionine + Cysteine 2.5 2.3 5.05 2.84 4.68 4.59 Valine 3.2 2.9 5.20 4.38 5.36 4.94 Leucine 5.5 5.2 14.248.92 9.24 10.66 Isoleucine 2.5 2.3 5.57 4.43 4.24 6.24 Phenylalanine + Tyrosine 4.7 4.1 8.69 5.47 9.57 6.34 Lysine 5.1 4.7 10.066.35 6.74 8.87 Histidine 1.8 1.7 1.76 1.47 3.06 1.37 Trytophan 0.8 6.0 * * * * 1Values based on EAR (estimated average requirement): EAR amino acids/EAR protein; Children (1 to 3 years) EAR protein = 0.88 g/kg/day; adults (>18 years). EAR protein = 0.66 g/kg/day; 2IOM: Institute of Medicine. *Amino acid not determinated. Copyright © 2013 SciRes. FNS 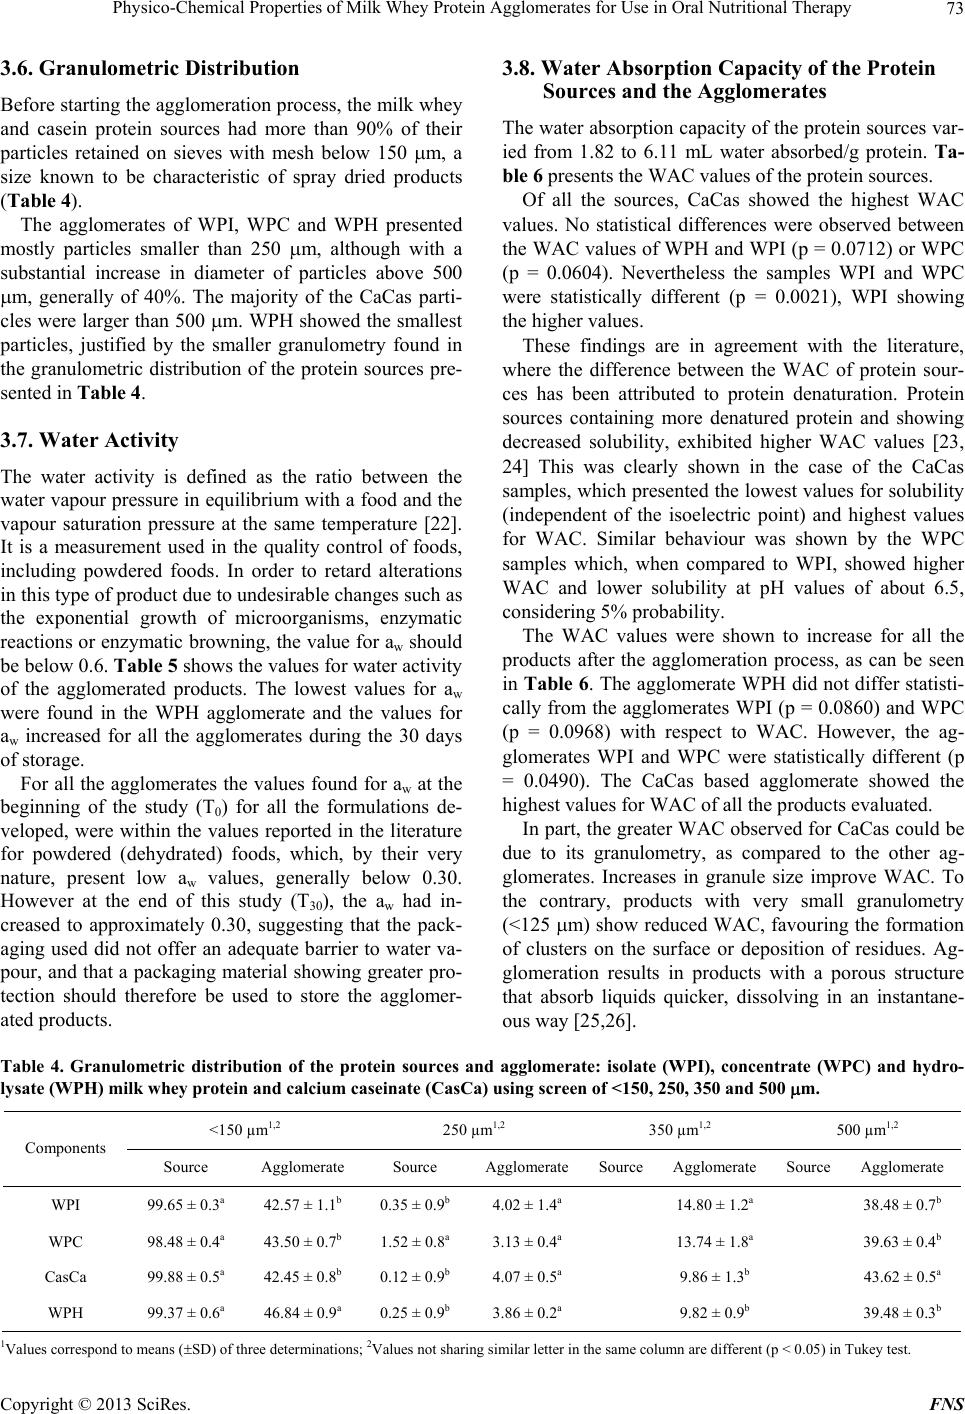 Physico-Chemical Properties of Milk Whey Protein Agglomerates for Use in Oral Nutritional Therapy 73 3.6. Granulometric Distribution Before starting the agglomeration process, the milk whey and casein protein sources had more than 90% of their particles retained on sieves with mesh below 150 m, a size known to be characteristic of spray dried products (Table 4). The agglomerates of WPI, WPC and WPH presented mostly particles smaller than 250 m, although with a substantial increase in diameter of particles above 500 m, generally of 40%. The majority of the CaCas parti- cles were larger than 500 m. WPH showed the smallest particles, justified by the smaller granulometry found in the granulometric distribution of the protein sources pre- sented in Table 4. 3.7. Water Activity The water activity is defined as the ratio between the water vapour pressure in equilibrium with a food and the vapour saturation pressure at the same temperature [22]. It is a measurement used in the quality control of foods, including powdered foods. In order to retard alterations in this type of product due to undesirable changes such as the exponential growth of microorganisms, enzymatic reactions or enzymatic browning, the value for aw should be below 0.6. Table 5 shows the values for water activity of the agglomerated products. The lowest values for aw were found in the WPH agglomerate and the values for aw increased for all the agglomerates during the 30 days of storage. For all the agglomerates the values found for aw at the beginning of the study (T0) for all the formulations de- veloped, were within the values reported in the literature for powdered (dehydrated) foods, which, by their very nature, present low aw values, generally below 0.30. However at the end of this study (T30), the aw had in- creased to approximately 0.30, suggesting that the pack- aging used did not offer an adequate barrier to water va- pour, and that a packaging material showing greater pro- tection should therefore be used to store the agglomer- ated products. 3.8. Water Absorption Capacity of the Protein Sources and the Agglomerates The water absorption capacity of the protein sources var- ied from 1.82 to 6.11 mL water absorbed/g protein. Ta- ble 6 presents the WAC values of the protein sources. Of all the sources, CaCas showed the highest WAC values. No statistical differences were observed between the WAC values of WPH and WPI (p = 0.0712) or WPC (p = 0.0604). Nevertheless the samples WPI and WPC were statistically different (p = 0.0021), WPI showing the higher values. These findings are in agreement with the literature, where the difference between the WAC of protein sour- ces has been attributed to protein denaturation. Protein sources containing more denatured protein and showing decreased solubility, exhibited higher WAC values [23, 24] This was clearly shown in the case of the CaCas samples, which presented the lowest values for solubility (independent of the isoelectric point) and highest values for WAC. Similar behaviour was shown by the WPC samples which, when compared to WPI, showed higher WAC and lower solubility at pH values of about 6.5, considering 5% probability. The WAC values were shown to increase for all the products after the agglomeration process, as can be seen in Table 6. The agglomerate WPH did not differ statisti- cally from the agglomerates WPI (p = 0.0860) and WPC (p = 0.0968) with respect to WAC. However, the ag- glomerates WPI and WPC were statistically different (p = 0.0490). The CaCas based agglomerate showed the highest values for WAC of all the products evaluated. In part, the greater WAC observed for CaCas could be due to its granulometry, as compared to the other ag- glomerates. Increases in granule size improve WAC. To the contrary, products with very small granulometry (<125 m) show reduced WAC, favouring the formation of clusters on the surface or deposition of residues. Ag- glomeration results in products with a porous structure that absorb liquids quicker, dissolving in an instantane- ous way [25,26]. Table 4. Granulometric distribution of the protein sources and agglomerate: isolate (WPI), concentrate (WPC) and hydro- lysate (WPH) milk whey protein and calcium caseinate (CasCa) using screen of <150, 250, 350 and 500 m. <150 µm1,2 250 µm1,2 350 µm1,2 500 µm1,2 Components Source Agglomerate Source Agglomerate Source Agglomerate Source Agglomerate WPI 99.65 ± 0.3a 42.57 ± 1.1b 0.35 ± 0.9b 4.02 ± 1.4a 14.80 ± 1.2a 38.48 ± 0.7b WPC 98.48 ± 0.4a 43.50 ± 0.7b 1.52 ± 0.8a 3.13 ± 0.4a 13.74 ± 1.8a 39.63 ± 0.4b CasCa 99.88 ± 0.5a 42.45 ± 0.8b 0.12 ± 0.9b 4.07 ± 0.5a 9.86 ± 1.3b 43.62 ± 0.5a WPH 99.37 ± 0.6a 46.84 ± 0.9a 0.25 ± 0.9b 3.86 ± 0.2a 9.82 ± 0.9b 39.48 ± 0.3b 1Values correspond to means (SD) of three determinations; 2Values not sharing similar letter in the same column are different (p < 0.05) in Tukey test. Copyright © 2013 SciRes. FNS  Physico-Chemical Properties of Milk Whey Protein Agglomerates for Use in Oral Nutritional Therapy 74 Table 5. Water activity of the agglomerates: isolate (WPI), concentrate (WPC) and hydrolysate (WPH) milk whey pro- tein and calcium caseinate (CasCa) at initial time (T0) and final time, after thirty days (T30), at 25˚C. aw (To)1,2 a w (T30)1,2 Agglomerates Temp. 25˚ WPI 0.24 ± 0.03Ab 0.30 ± 0.01Aa WPC 0.25 ± 0.94Ab 0.31 ± 0.10Aa CasCa 0.25 ± 0.03Ab 0.31 ± 0.01Aa WPH 0.18 ± 0.06Bb 0.23 ± 0.08Ba 1Values correspond to means ( SD) of three determinations; 2Values shar- ing similar capital letter in the same column and small letter in the same line are not different (p > 0.05) in Tukey test. Table 6. Water absorption capacity (WAC) of the protein sources and agglomerate: isolate (WPI), concentrate (WPC) and hydrolysate (WPH) milk whey protein and calcium caseinate (CasCa) at 25˚C during 30 minutes. WAC (mL absorbed water/g protein)1,2 Components Source Agglomerates WPI 1.82 ± 0.18Db 4.02 ± 0.14Da WPC 3.77 ± 0.28Bb 6.30 ± 0.23Ba CasCa 6.11 ± 0.10Ab 8.17 ± 0.13Aa WPH 2.63 ± 0.09Cb 5.15 ± 0.17Ca 1Values correspond to means ( SD) of three determinations; 2Values shar- ing similar capital letter in the same column and small letter in the same line are not different (p > 0.05) in Tukey test. The physical-chemical alterations occurring during agglomeration can alter the WAC. One of the peculiari- ties of the agglomeration process is to moisten the fine particles of the powder with vapour, such that the parti- cles enter into contact or collide with each other, forming porous agglomerates subsequently dried in hot air [25]. Alterations in the protein conformation resulting from this process can affect the thermodynamics of water binding by altering the availability of polar sites or hy- dration sites. The transition of the compact globular con- formation of the protein molecule to a random conforma- tion results in an increase of the available surface area and the exposure of peptides and amino acid side chains, that were nativelly hidden, thereby increasing their in- teraction with water [27]. 3.9. Apparent Density, Particle Density and Porosity The protein sources WPI and WPC were not statistically different from each other (p = 0.9315). The CaCas and WPH were significantly different (p = 0.0324) from each other and from the other protein sources (Table 7). The apparent density depends on the intensity of the attractive forces between the particles, the particle size and the number of points of contact. Powdered foods have apparent densities between 0.3 and 0.8 g·cm−3. The ap of powdered milk whey is 0.52 g·cm−3, whilst for WPI with protein contents of 85%, this value was 0.38 g·cm−3 [28]. It could be seen that after agglomeration a significant difference was observed between the protein sources (raw material) and the agglomerates, the differ- ences found between the samples of CaCas and WPH remaining (p = 0.033). The particle density ( part) reflects the existence of in- ternal pores in the powder granules, and is defined as the mean weight of the particles per unit volume, excluding the volume occupied by interstitial air [29]. It is known as the measurement of true density, and is important in situations where one must obtain the relationship be- tween the weight of the particles and the forces between them [10]. As in the case of the values obtained in the analyses for ap for the protein sources and agglomerated products, the WPH showed higher values for part for both the pro- tein sources and the agglomerates (Table 7). The particle density of the majority of powdered foods Table 7. Apparent density ( ap), particle density ( part) and porosity P (%) of the protein sources and agglomerate: isolate (WPI), concentrate (WPC) and hydrolysate (WPH) milk whey protein and calcium caseinate (CasCa). ρap g·cm−3 1,2,3 ρpart g·cm−3 1,2,4 P (%)1,2,5 Components Source Agglomerate Source Agglomerate Source Agglomerate WPI 0.394 ± 0.042Ba 0.344 ± 0.005Bb 1.088 ± 0.006Bb 1.334 ± 0.020Ba 64.12Bb 74.13Ba WPC 0.391 ± 0.018Ba 0.341 ± 0.003Bb 1.087 ± 0.003Bb 1.332 ± 0.073Ba 64.02Bb 74.16Ba CasCa 0.366 ± 0.009Ca 0.319 ± 0.036Cb 1.085 ± 0.005Bb 1.329 ± 0.037Ba 66.27Ab 75.27Aa WPH 0.413 ± 0.004Aa 0.363 ± 0.012Ab 1.093 ± 0.006Ab 1.342 ± 0.001Aa 62.21Cb 74.89Ca 1Values correspond to means (SD) of three determinations; 2Similar letter in the same column are not different (p > 0.05) in Tukey test; 3Similar letter in the same line referent to ap are not different (p > 0.05) in Tukey test; 4Similar letter in the same line referent to part are not different (p > 0.05) in Tukey test; 5Similar letter in the same line referent to % P are not different (p > 0.05) in Tukey test. Copyright © 2013 SciRes. FNS  Physico-Chemical Properties of Milk Whey Protein Agglomerates for Use in Oral Nutritional Therapy 75 is between 1.4 and 1.5 g·cm−3, depending on the moisture content [10]. However, for milk whey products, the value for part was 1.0 g·cm−3 [28], corroborating with the pre- sent study. The results of the present study corroborate with the papers cited, the variation being from 1.08 to 1.14 g·cm−3. Porosity is a function of particle size, size distribution and form. The use of porosity allows for and facilitates the treatment and comparisons between powdered foods that could have different particle densities [10]. As in the case of apparent density, the results for % P of the pro- tein sources and agglomerates showed significant differ- ences between the % P of WPH and of CaCas (p = 0.092) and those of the other sources used. Amongst the ag- glomerates, the greatest % P was found for the CaCas samples (Table 7). The values found in the present study agree with those found by Peleg [10], who showed that powdered foods with part of about 1.4 g·cm−3 showed internal, external or both porosities between 40 and 80%. The % P can be a parameter showing the efficiency of the agglomeration process. The interstitial space shown, in an irregular ar- ray, by large particles, favours wettability (ability of the powder to bind water on the surface), whereas small, symmetrical particles show reduced interstices that ham- per water penetration [26,29]. 3.10. Apparent Viscosity of the Protein Sources and Agglomerated Products The viscosity of a food is one of the most important variables in swallowing. Thin liquids make swallowing difficult for patients with reduced oral control, since they are swallowed quickly and fail to maintain any form in- side the oral cavity. Part of the liquid food may slip pre- maturely to the pharynx and thus penetrate the still open airways, that is, before swallowing actually occurs. To avoid this effect, the ideal viscosity for swallowing to occur safely should be determined [2]. Considering the protein sources of different food sys- tems as a base, and using protein concentrations of 18 and 28 g, it can be seen that the sources WPI, WPC and WPH showed similar behaviour in water and in milk. CaCas showed higher values in whole milk and lower values in orange juice (Table 8). Considering the food system in water as the base, no differences of viscosity were observed between WPC and WPH (p = 0.961), the same being observed in milk (p = 0.955) and juice (p = 0.738) at a concentration of 18 g of protein. Similar behaviour was observed at a final con- centration of 28 g of protein. As in water, the values found for CaCas in milk were greater than the others. In orange juice, WPI showed the highest values and CaCas the lowest (Tabl e 8). According to the standards established by ADA [3], both for the use of 18 g (recommended for female adult) and 28 g (recommended for a male adult), the protein sources WPC and WPH were classified as thin liquids (1 - 50 centipoise—cP) in all the food systems. CaCas was classified as nectar (51 - 350 cP) in water and milk, and in orange juice this same source was classified as a thin liquid (1 - 50 cP—water). The low values for the viscos- ity found with CaCas in the orange juice are related to the system pH of about 4.5, close to the isoelectric point of the casein, which favours precipitation of these sour- ces. WPI was classified as a nectar in all the food sys- tems. Table 8. Apparent viscosity ( ’), in centipoise (cP), of the protein sources: isolate (WPI), concentrate (WPC) and hydrolysate (WPH) milk whey protein and calcium caseinate (CasCa) at the concentration of 18 at 28 g in 250 mL of foods (water, whole milk and orange juice) at 25˚C. ’ (cP)1,2 Protein source Water Whole milk Orange juice WPI 90.91 ± 0.18Db 90.46 ± 0.37Db 103.06 ± 0.67Ba WPC 5.38 ± 0.28Fb 6.01 ± 0.53Fb 11.30 ± 0.35Fa CasCa 114.4 ± 1.04Cb 192.33 ± 0.34Ba 20.29 ± 0.41Dc [ ] 18 g of protein WPH 5.30 ± 0.87Fb 5.45 ± 0.65Fb 10.90 ± 0.07Fa WPI 140.70 ± 0.61Bb 140.46 ± 0.79Cb 160.7 ± 0.52Aa WPC 10.11 ± 0.20Ea 10.35 ± 0.45Eb 18.60 ± 0.12Ea CasCa 181.5 ± 1.32Ab 302.36 ± 0.47Aa 32.15 ± 2.15Cc [ ] 28 g of protein WPH 10.14 ± 0.02Ea 10.15 ± 0.03Eb 18.25 ± 0.98Ea 1Values correspond to means ( SD) of three determinations; 2Values sharing similar capital letter in the same column and small letter in the same line are not different (p > 0.05) in Tukey test. Copyright © 2013 SciRes. FNS 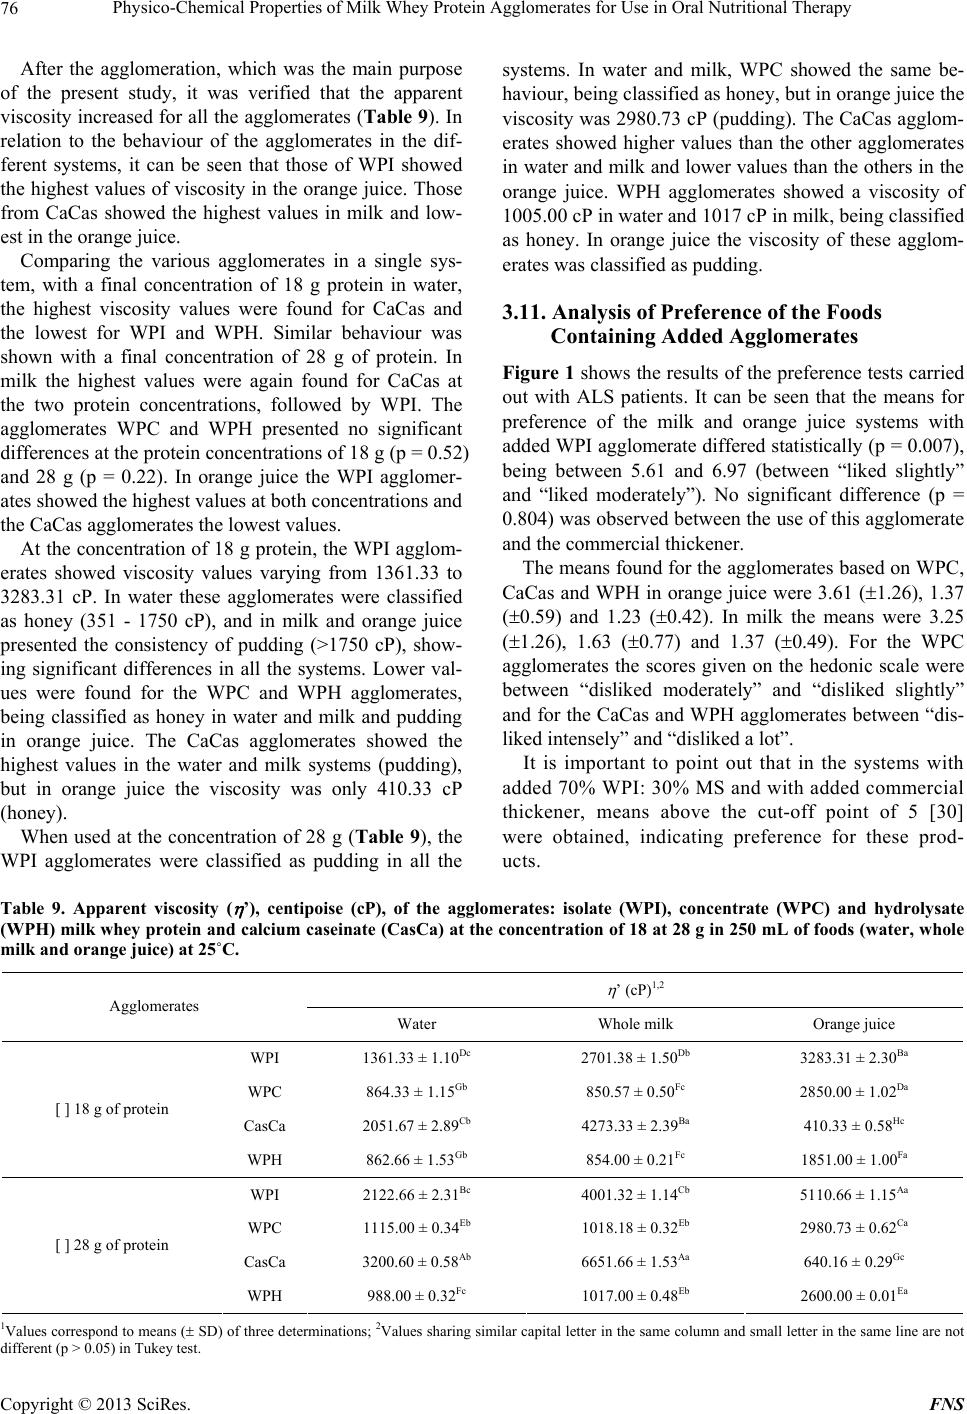 Physico-Chemical Properties of Milk Whey Protein Agglomerates for Use in Oral Nutritional Therapy 76 After the agglomeration, which was the main purpose of the present study, it was verified that the apparent viscosity increased for all the agglomerates (Table 9). In relation to the behaviour of the agglomerates in the dif- ferent systems, it can be seen that those of WPI showed the highest values of viscosity in the orange juice. Those from CaCas showed the highest values in milk and low- est in the orange juice. Comparing the various agglomerates in a single sys- tem, with a final concentration of 18 g protein in water, the highest viscosity values were found for CaCas and the lowest for WPI and WPH. Similar behaviour was shown with a final concentration of 28 g of protein. In milk the highest values were again found for CaCas at the two protein concentrations, followed by WPI. The agglomerates WPC and WPH presented no significant differences at the protein concentrations of 18 g (p = 0.52) and 28 g (p = 0.22). In orange juice the WPI agglomer- ates showed the highest values at both concentrations and the CaCas agglomerates the lowest values. At the concentration of 18 g protein, the WPI agglom- erates showed viscosity values varying from 1361.33 to 3283.31 cP. In water these agglomerates were classified as honey (351 - 1750 cP), and in milk and orange juice presented the consistency of pudding (>1750 cP), show- ing significant differences in all the systems. Lower val- ues were found for the WPC and WPH agglomerates, being classified as honey in water and milk and pudding in orange juice. The CaCas agglomerates showed the highest values in the water and milk systems (pudding), but in orange juice the viscosity was only 410.33 cP (honey). When used at the concentration of 28 g (Table 9), the WPI agglomerates were classified as pudding in all the systems. In water and milk, WPC showed the same be- haviour, being classified as honey, but in orange juice the viscosity was 2980.73 cP (pudding). The CaCas agglom- erates showed higher values than the other agglomerates in water and milk and lower values than the others in the orange juice. WPH agglomerates showed a viscosity of 1005.00 cP in water and 1017 cP in milk, being classified as honey. In orange juice the viscosity of these agglom- erates was classified as pudding. 3.11. Analysis of Preference of the Foods Containing Added Agglomerates Figure 1 shows the results of the preference tests carried out with ALS patients. It can be seen that the means for preference of the milk and orange juice systems with added WPI agglomerate differed statistically (p = 0.007), being between 5.61 and 6.97 (between “liked slightly” and “liked moderately”). No significant difference (p = 0.804) was observed between the use of this agglomerate and the commercial thickener. The means found for the agglomerates based on WPC, CaCas and WPH in orange juice were 3.61 (1.26), 1.37 (0.59) and 1.23 (0.42). In milk the means were 3.25 (1.26), 1.63 (0.77) and 1.37 (0.49). For the WPC agglomerates the scores given on the hedonic scale were between “disliked moderately” and “disliked slightly” and for the CaCas and WPH agglomerates between “dis- liked intensely” and “disliked a lot”. It is important to point out that in the systems with added 70% WPI: 30% MS and with added commercial thickener, means above the cut-off point of 5 [30] were obtained, indicating preference for these prod- ucts. Table 9. Apparent viscosity ( ’), centipoise (cP), of the agglomerates: isolate (WPI), concentrate (WPC) and hydrolysate (WPH) milk whey protein and calcium caseinate (CasCa) at the concentration of 18 at 28 g in 250 mL of foods (water, whole milk and orange juice) at 25˚C. ’ (cP)1,2 Agglomerates Water Whole milk Orange juice WPI 1361.33 ± 1.10Dc 2701.38 ± 1.50Db 3283.31 ± 2.30Ba WPC 864.33 ± 1.15Gb 850.57 ± 0.50Fc 2850.00 ± 1.02Da CasCa 2051.67 ± 2.89Cb 4273.33 ± 2.39Ba 410.33 ± 0.58Hc [ ] 18 g of protein WPH 862.66 ± 1.53Gb 854.00 ± 0.21Fc 1851.00 ± 1.00Fa WPI 2122.66 ± 2.31Bc 4001.32 ± 1.14Cb 5110.66 ± 1.15Aa WPC 1115.00 ± 0.34Eb 1018.18 ± 0.32Eb 2980.73 ± 0.62Ca CasCa 3200.60 ± 0.58Ab 6651.66 ± 1.53Aa 640.16 ± 0.29Gc [ ] 28 g of protein WPH 988.00 ± 0.32Fc 1017.00 ± 0.48Eb 2600.00 ± 0.01Ea 1Values correspond to means ( SD) of three determinations; 2Values sharing similar capital letter in the same column and small letter in the same line are not different (p > 0.05) in Tukey test. Copyright © 2013 SciRes. FNS 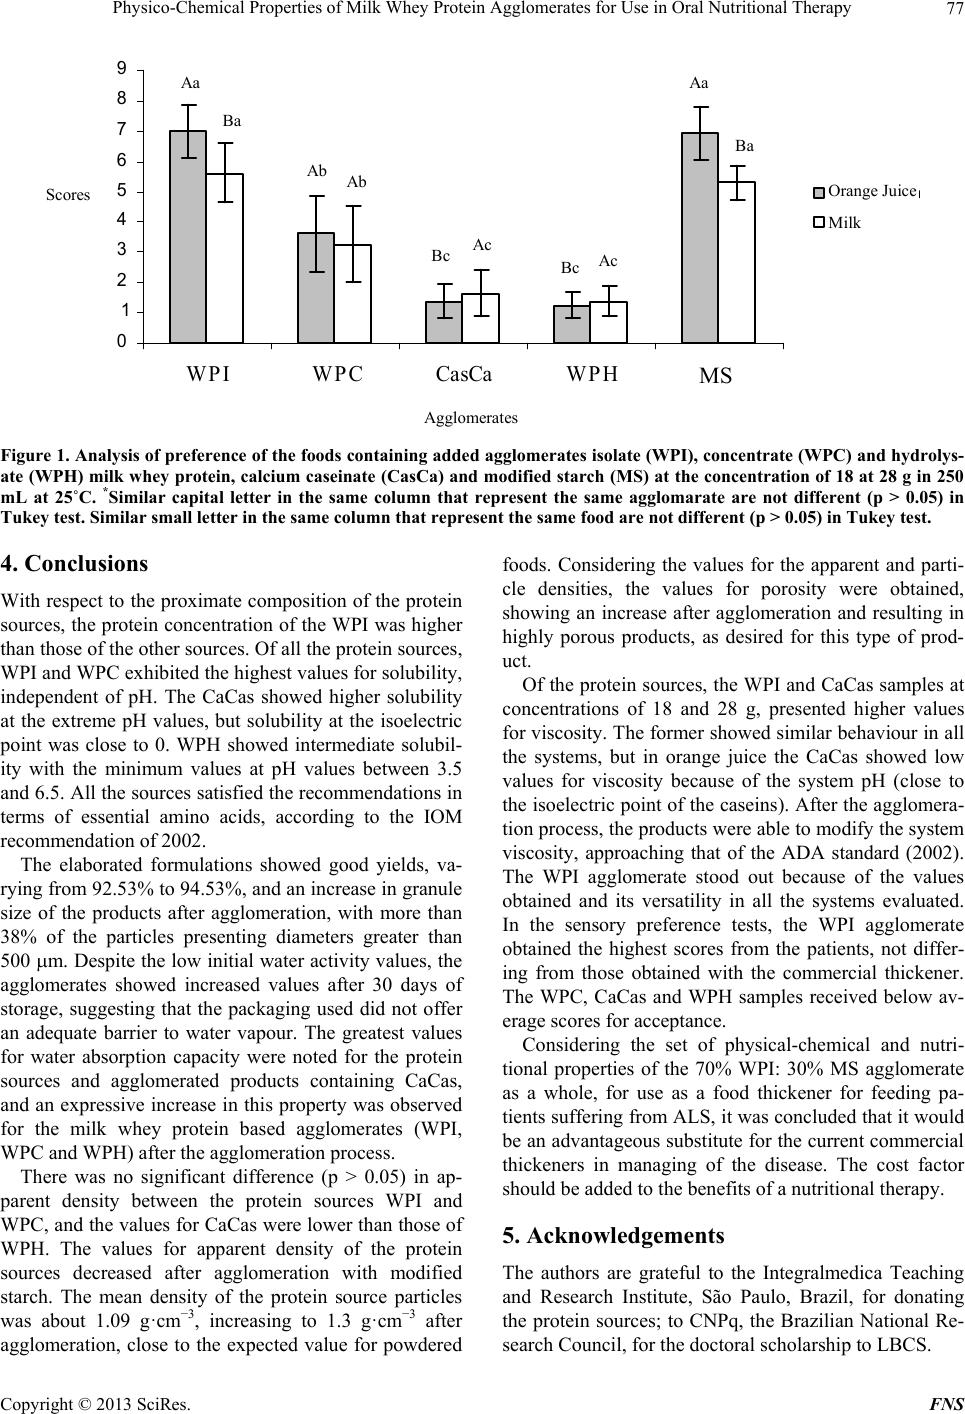 Physico-Chemical Properties of Milk Whey Protein Agglomerates for Use in Oral Nutritional Therapy 77 0 1 2 3 4 5 6 7 8 9 WPIWPC CasCaWPHEspes Aglomerados Notas Suco de L Le ite Aa Ba Ab Ab Bc Ac Bc Ac Aa Ba Agglomerates Orange Juice Milk Scores MS Figure 1. Analysis of preference of the foods containing added agglomerates isolate (WPI), concentrate (WPC) and hydrolys- ate (WPH) milk whey protein, calcium caseinate (CasCa) and modified starch (MS) at the concentration of 18 at 28 g in 250 mL at 25˚C. *Similar capital letter in the same column that represent the same agglomarate are not different (p > 0.05) in Tukey test. Similar small letter in the same column that represent the same food are not different (p > 0.05) in Tukey test. 4. Conclusions With respect to the proximate composition of the protein sources, the protein concentration of the WPI was higher than those of the other sources. Of all the protein sources, WPI and WPC exhibited the highest values for solubility, independent of pH. The CaCas showed higher solubility at the extreme pH values, but solubility at the isoelectric point was close to 0. WPH showed intermediate solubil- ity with the minimum values at pH values between 3.5 and 6.5. All the sources satisfied the recommendations in terms of essential amino acids, according to the IOM recommendation of 2002. The elaborated formulations showed good yields, va- rying from 92.53% to 94.53%, and an increase in granule size of the products after agglomeration, with more than 38% of the particles presenting diameters greater than 500 m. Despite the low initial water activity values, the agglomerates showed increased values after 30 days of storage, suggesting that the packaging used did not offer an adequate barrier to water vapour. The greatest values for water absorption capacity were noted for the protein sources and agglomerated products containing CaCas, and an expressive increase in this property was observed for the milk whey protein based agglomerates (WPI, WPC and WPH) after the agglomeration process. There was no significant difference (p > 0.05) in ap- parent density between the protein sources WPI and WPC, and the values for CaCas were lower than those of WPH. The values for apparent density of the protein sources decreased after agglomeration with modified starch. The mean density of the protein source particles was about 1.09 g·cm−3, increasing to 1.3 g·cm−3 after agglomeration, close to the expected value for powdered foods. Considering the values for the apparent and parti- cle densities, the values for porosity were obtained, showing an increase after agglomeration and resulting in highly porous products, as desired for this type of prod- uct. Of the protein sources, the WPI and CaCas samples at concentrations of 18 and 28 g, presented higher values for viscosity. The former showed similar behaviour in all the systems, but in orange juice the CaCas showed low values for viscosity because of the system pH (close to the isoelectric point of the caseins). After the agglomera- tion process, the products were able to modify the system viscosity, approaching that of the ADA standard (2002). The WPI agglomerate stood out because of the values obtained and its versatility in all the systems evaluated. In the sensory preference tests, the WPI agglomerate obtained the highest scores from the patients, not differ- ing from those obtained with the commercial thickener. The WPC, CaCas and WPH samples received below av- erage scores for acceptance. Considering the set of physical-chemical and nutri- tional properties of the 70% WPI: 30% MS agglomerate as a whole, for use as a food thickener for feeding pa- tients suffering from ALS, it was concluded that it would be an advantageous substitute for the current commercial thickeners in managing of the disease. The cost factor should be added to the benefits of a nutritional therapy. 5. Acknowledgements The authors are grateful to the Integralmedica Teaching and Research Institute, São Paulo, Brazil, for donating the protein sources; to CNPq, the Brazilian National Re- search Council, for the doctoral scholarship to LBCS. Copyright © 2013 SciRes. FNS  Physico-Chemical Properties of Milk Whey Protein Agglomerates for Use in Oral Nutritional Therapy 78 REFERENCES [1] L. B. Carvalho-Silva and C. M. Ikeda, “Nutrition Care in Dysphagia: An Alternative for the Maximization of the Nutritional State,” Brazilian Journal of Clinical Nutrition, Vol. 24, No. 3, 2009, pp. 203-210. [2] L. B. Carvalho-Silva, “Amyotrophic Lateral Sclerosis,” In: M. H. Maurer, Ed., Rijeka, Vol. 1, 2012, pp. 595-612. [3] ADA National Dysphagia Diet, “The Manual of Clinical Dietetics,” 5th Edition, The American Dietetics Associa- tion, Chicago, 1996, p. 56. [4] Association of Official Analytical Chemists, “Official Methods of Analysis,” In: W. Horwtz, Eds., Washington DC, 1990, p. 98. [5] E. G. Bligh and W. J. Dyer, “A Rapid Method of Total Lipid Extraction and Purification,” Canadian Journal of Biochemistry and Physiology, Vol. 37, No. 8, 1959, pp. 911-917. doi:10.1139/o59-099 [6] J. Adler-Nissen, “Determination of the Degree of Hy- drolysis of Food Protein Hydrolysates by Trinitroben- zenesulfonic Acid,” Journal of Agriculture and Food Chemistry, Vol. 27, No. 6, 1979, pp. 1256-1262. doi:10.1021/jf60226a042 [7] S. R. Hagen, B. Frost and J. Augustin, “Pre-Column Phenylisothiocyanate derivatization and Liquid Chroma- tography of Amino Acids in Food,” Journal of AOAC, Vol. 72, No. 6, 1989, pp. 912-916. [8] H. Baumann, “Appatur Nach Baumann zur Besting der Flússig-Keitsaunahme von Pulvrigen Substanzen,” Fette, Vol. 68, No. 9, 1966, p. 741. doi:10.1002/lipi.19660680905 [9] H. Torgensen and R. T. Toledo, “Physical Properties of Protein Preparations Relates to Their Functional Charac- teristics in Comminuted Meat Systems,” Journal of Food Science, Vol. 42, No. 6, 1977, pp. 1615-1618. doi:10.1111/j.1365-2621.1977.tb08440.x [10] M. Peleg, “Physical Properties of Foods,” In: M. Peleg and E. B. Bagley, Eds., AVI Publishing Co. Inc., West- port, 1983, pp. 293-321. [11] Y. Pomeranz and C. E. Meloan, “Food Analysis: Theory and Practice,” 3rd Edition, AVI Publishing Co. Inc., Westport, 1994. [12] M. Meilgaard, G. V. Civille and B. T. Carr, “Sensory Evaluation Techniques,” 3rd Edition, CRC Press, New York, 1989. [13] L. M. Huffman, “Processing Whey Protein for Use as a Food Ingredient,” Food Technology, Vol. 50, No. 2, 1996, pp. 49-52. [14] F. Vojdani, “Methods of Testing Protein Functionality,” In: G. M. Hall, Ed., Blackie Academic & Professional, London, 1996, pp. 11-60. [15] S. Damodaran, “Food Proteins,” In: J. E. Linsella, Ed., Champaign, 1989, pp. 21-51. [16] C. V. Morr, B. German, J. E. Kinsella, J. P. Regenstein, V. Buren, A. Kilara, B. A. Lewis and M. E. Mangino, “Col- laborative Study to Develop a Standardized Food Protein Solubility Procedure,” Journal of Food Science, Vol. 50, No. 6, 1985, pp. 1715-1718. doi:10.1111/j.1365-2621.1985.tb10572.x [17] J. Giese, “Proteins as Ingredients: Types, Functions, Ap- plications,” Food Technology, Vol. 48, No. 10, 1994, pp. 50-60. [18] IOM (Institute of Medicine), “National Academy of Sci- ences on Dietary Reference Intakes (DRI’s). Dietary Ref- erence Intakes for Energy, Carbohydrates, Fiber, Fat, Protein and Amino Acids (Macronutrients), National Aca- demy Press, Washington, 2002. [19] C. G. De Kruif and C. Holt, “Advanced Dairy Chemis- try,” In: P. F. Fox and P. L. H. CaSweeney, Eds., 3rd Edi- tion, Kluwer Academic/Plenum Publishers, New York, Vol. 1, 2003, pp. 233-276. [20] L. Hambraeus, “Nutritional Aspects of Milk Proteins,” In: P. F. Fox, Ed., Development of Dairy Chemistry, Applies Science, London, 1982, pp. 289-313. [21] R. D. Steele and A. E. Harper, “Present Knowledge in Nutrition,” In: M. L. Brown, Ed., 6th Edition, Nutritional Foundation, Washington DC, 1990, pp. 67-79. [22] A. J. Fontana, “Water Activity: Why Is It Important for Food Safety,” Proceedings of the 1st NSF International Conference of Food Safety, Albuquerque, November 1998. [23] E. L. Arrese, D. A. Sorgentini, J. R. Wagner and M. C. Añon, “Eletrophoretic, Solubility, and Functional Proper- ties of Commercial Soy Protein Isolates,” Journal of Ag- ricultural and Food Chemistry, Vol. 39, No. 6, 1991, pp. 1029-1032. doi:10.1021/jf00006a004 [24] G. Remondetto, M. C. Añon and R. J. González, “Hy- dratation Properties of Soybean Protein Isolates,” Bra- silian Archives of Biology and Technology, Vol. 44, No. 4, 2001, pp. 425-431. [25] J. M. Aguilera, J. M. Valle and M. Karel, “Caking Phe- nomena in Amorphous Food Powders,” Trends in Food Science & Technology, Vol. 6, No. 5, 1995, pp. 149-155. doi:10.1016/S0924-2244(00)89023-8 [26] K. Masters, “Spray Drying. Chemical and Process Engi- neering Series,” Leonard Hill Books, London, 1972. [27] J. E. Kinsella, “Milk Proteins: Physicochemical and Func- tional Properties,” Critical Reviews in Food Science and Nutrition, Vol. 21, No. 3, 1994, pp. 197-287. [28] G. V. Barbosa-Cánovas and P. Juliano, “Physical and Chemical Properties of Food Powders,” In: C. Onwulata, Eds., Encapsulated and Powdered Foods, Taylor & Fran- cis, New York, 2005, pp. 39-71. doi:10.1201/9781420028300.ch3 [29] A. B. R. Maia and M. Golgher, “Parâmetros para a Avaliação da Qualidade de Reconstituição do leite em pó Desidratado em Secador de Aspersão (‘Spray Dryer’),” Boletim SBCTA, Vol. 17, 1983, pp. 235-254. [30] H. Stone and J. L. Sidel, “Sensory Evaluation Practices,” Academic Press, New York, 1993, pp. 69-96. Copyright © 2013 SciRes. FNS
|