Paper Menu >>
Journal Menu >>
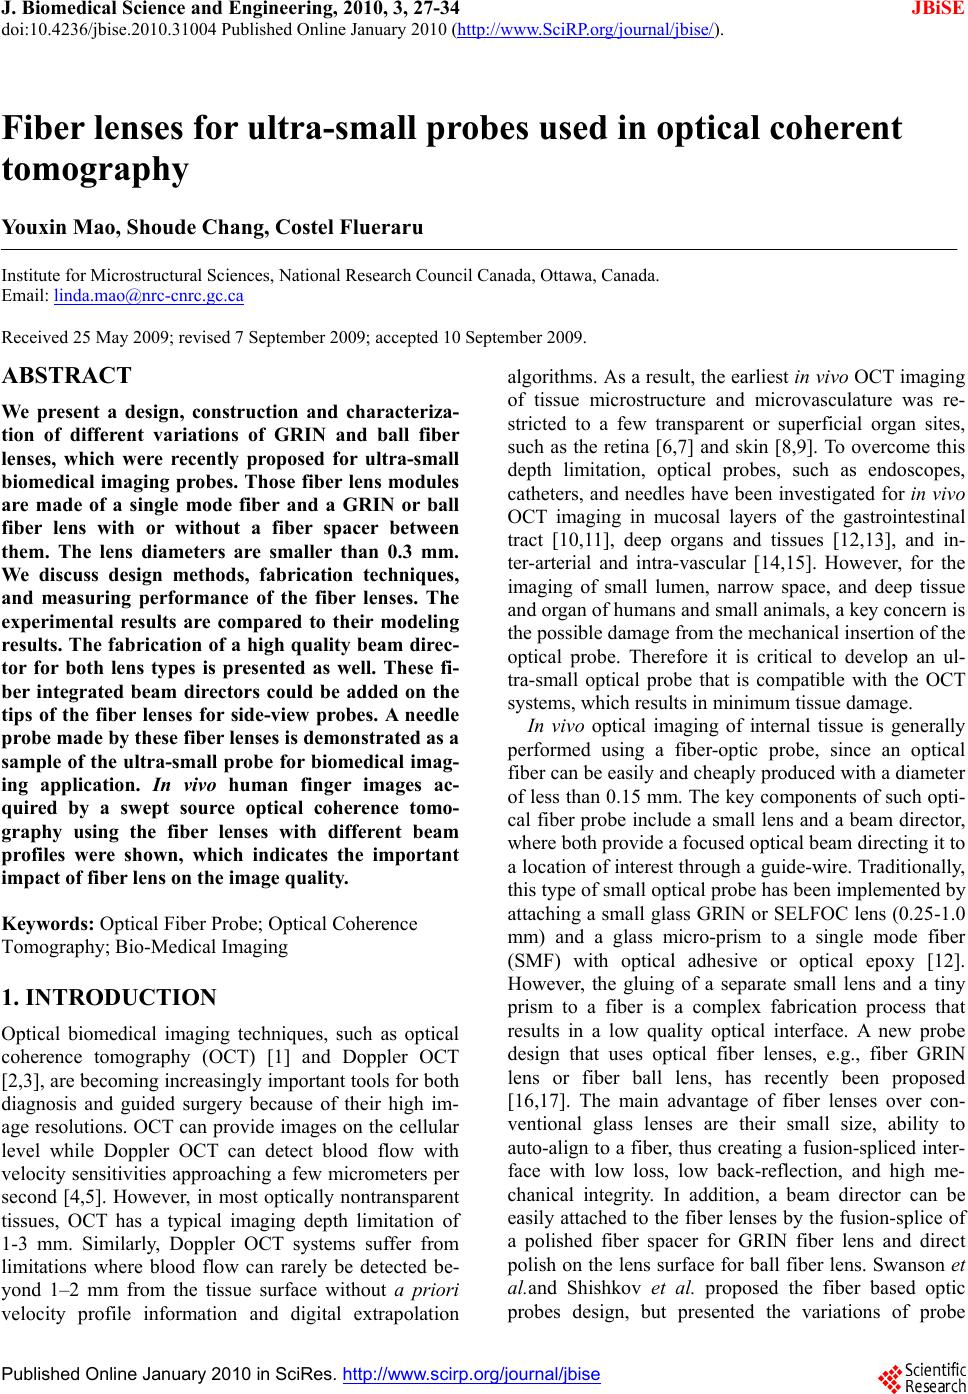 J. Biomedical Science and Engineering, 2010, 3, 27-34 doi:10.4236/jbise.2010.31004 Published Online January 2010 (http://www.SciRP.org/journal/jbise/ JBiSE ). Published Online January 2010 in SciRes. http://www.scirp.org/journal/jbise Fiber lenses for ultra-small probes used in optical coherent tomography Youxin Mao, Shoude Chang, Costel Flueraru Institute for Microstructural Sciences, National Research Council Canada, Ottawa, Canada. Email: linda.mao@nrc-cnrc.gc.ca Received 25 May 2009; revised 7 September 2009; accepted 10 September 2009. ABSTRACT We present a design, construction and characteriza- tion of different variations of GRIN and ball fiber lenses, which were recently proposed for ultra-small biomedical imaging probes. Those fiber lens modules are made of a single mode fiber and a GRIN or ball fiber lens with or without a fiber spacer between them. The lens diameters are smaller than 0.3 mm. We discuss design methods, fabrication techniques, and measuring performance of the fiber lenses. The experimental results are compared to their modeling results. The fabrication of a high quality beam direc- tor for both lens types is presented as well. These fi- ber integrated beam directors could be added on the tips of the fiber lenses for side-view probes. A needle probe made by these fiber lenses is demonstrated as a sample of the ultra-small probe for biomedical imag- ing application. In vivo human finger images ac- quired by a swept source optical coherence tomo- graphy using the fiber lenses with different beam profiles were shown, which indicates the important impact of fiber lens on the image quality. Keywords: Optical Fiber Probe; Optical Coherence Tomography; Bio-Medical Imaging 1. INTRODUCTION Optical biomedical imaging techniques, such as optical coherence tomography (OCT) [1] and Doppler OCT [2,3], are becoming increasingly important tools for both diagnosis and guided surgery because of their high im- age resolutions. OCT can provide images on the cellular level while Doppler OCT can detect blood flow with velocity sensitivities approaching a few micrometers per second [4,5]. However, in most optically nontransparent tissues, OCT has a typical imaging depth limitation of 1-3 mm. Similarly, Doppler OCT systems suffer from limitations where blood flow can rarely be detected be- yond 1–2 mm from the tissue surface without a priori velocity profile information and digital extrapolation algorithms. As a result, the earliest in vivo OCT imaging of tissue microstructure and microvasculature was re- stricted to a few transparent or superficial organ sites, such as the retina [6,7] and skin [8,9]. To overcome this depth limitation, optical probes, such as endoscopes, catheters, and needles have been investigated for in vivo OCT imaging in mucosal layers of the gastrointestinal tract [10,11], deep organs and tissues [12,13], and in- ter-arterial and intra-vascular [14,15]. However, for the imaging of small lumen, narrow space, and deep tissue and organ of humans and small animals, a key concern is the possible damage from the mechanical insertion of the optical probe. Therefore it is critical to develop an ul- tra-small optical probe that is compatible with the OCT systems, which results in minimum tissue damage. In vivo optical imaging of internal tissue is generally performed using a fiber-optic probe, since an optical fiber can be easily and cheaply produced with a diameter of less than 0.15 mm. The key components of such opti- cal fiber probe include a small lens and a beam director, where both provide a focused optical beam directing it to a location of interest through a guide-wire. Traditionally, this type of small optical probe has been implemented by attaching a small glass GRIN or SELFOC lens (0.25-1.0 mm) and a glass micro-prism to a single mode fiber (SMF) with optical adhesive or optical epoxy [12]. However, the gluing of a separate small lens and a tiny prism to a fiber is a complex fabrication process that results in a low quality optical interface. A new probe design that uses optical fiber lenses, e.g., fiber GRIN lens or fiber ball lens, has recently been proposed [16,17]. The main advantage of fiber lenses over con- ventional glass lenses are their small size, ability to auto-align to a fiber, thus creating a fusion-spliced inter- face with low loss, low back-reflection, and high me- chanical integrity. In addition, a beam director can be easily attached to the fiber lenses by the fusion-splice of a polished fiber spacer for GRIN fiber lens and direct polish on the lens surface for ball fiber lens. Swanson et al.and Shishkov et al. proposed the fiber based optic probes design, but presented the variations of probe 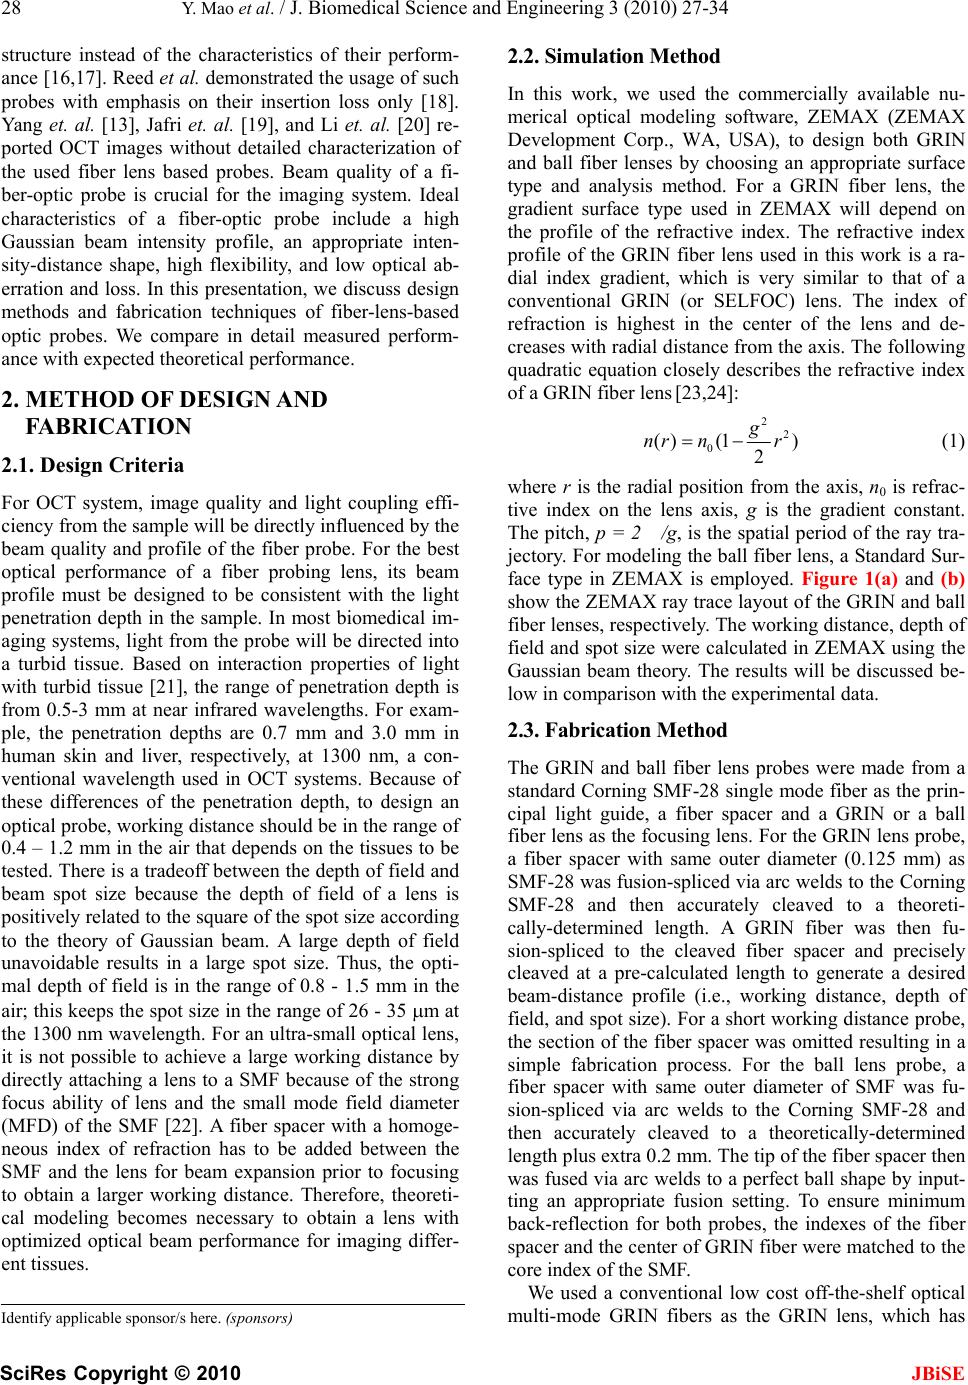 28 Y. Mao et al. / J. Biomedical Science and Engineering 3 (2010) 27-34 SciRes Copyright © 2010 JBiSE structure instead of the characteristics of their perform- ance [16,17]. Reed et al. demonstrated the usage of such probes with emphasis on their insertion loss only [18]. Yang et. al. [13], Jafri et. al. [19], and Li et. al. [20] re- ported OCT images without detailed characterization of the used fiber lens based probes. Beam quality of a fi- ber-optic probe is crucial for the imaging system. Ideal characteristics of a fiber-optic probe include a high Gaussian beam intensity profile, an appropriate inten- sity-distance shape, high flexibility, and low optical ab- erration and loss. In this presentation, we discuss design methods and fabrication techniques of fiber-lens-based optic probes. We compare in detail measured perform- ance with expected theoretical performance. 2. METHOD OF DESIGN AND FABRICATION 2.1. Design Criteria For OCT system, image quality and light coupling effi- ciency from the sample will be directly influenced by the beam quality and profile of the fiber probe. For the best optical performance of a fiber probing lens, its beam profile must be designed to be consistent with the light penetration depth in the sample. In most biomedical im- aging systems, light from the probe will be directed into a turbid tissue. Based on interaction properties of light with turbid tissue [21], the range of penetration depth is from 0.5-3 mm at near infrared wavelengths. For exam- ple, the penetration depths are 0.7 mm and 3.0 mm in human skin and liver, respectively, at 1300 nm, a con- ventional wavelength used in OCT systems. Because of these differences of the penetration depth, to design an optical probe, working distance should be in the range of 0.4 – 1.2 mm in the air that depends on the tissues to be tested. There is a tradeoff between the depth of field and beam spot size because the depth of field of a lens is positively related to the square of the spot size according to the theory of Gaussian beam. A large depth of field unavoidable results in a large spot size. Thus, the opti- mal depth of field is in the range of 0.8 - 1.5 mm in the air; this keeps the spot size in the range of 26 - 35 m at the 1300 nm wavelength. For an ultra-small optical lens, it is not possible to achieve a large working distance by directly attaching a lens to a SMF because of the strong focus ability of lens and the small mode field diameter (MFD) of the SMF [22]. A fiber spacer with a homoge- neous index of refraction has to be added between the SMF and the lens for beam expansion prior to focusing to obtain a larger working distance. Therefore, theoreti- cal modeling becomes necessary to obtain a lens with optimized optical beam performance for imaging differ- ent tissues. 2.2. Simulation Method In this work, we used the commercially available nu- merical optical modeling software, ZEMAX (ZEMAX Development Corp., WA, USA), to design both GRIN and ball fiber lenses by choosing an appropriate surface type and analysis method. For a GRIN fiber lens, the gradient surface type used in ZEMAX will depend on the profile of the refractive index. The refractive index profile of the GRIN fiber lens used in this work is a ra- dial index gradient, which is very similar to that of a conventional GRIN (or SELFOC) lens. The index of refraction is highest in the center of the lens and de- creases with radial distance from the axis. The following quadratic equation closely describes the refractive index of a GRIN fiber lens [23,24]: 2 2 0 () (1) 2 g nr nr (1) where r is the radial position from the axis, n0 is refrac- tive index on the lens axis, g is the gradient constant. The pitch, p = 2/g , is the spatial period of the ray tra- jectory. For modeling the ball fiber lens, a Standard Sur- face type in ZEMAX is employed. Figure 1(a) and (b) show the ZEMAX ray trace layout of the GRIN and ball fiber lenses, respectively. The working distance, depth of field and spot size were calculated in ZEMAX using the Gaussian beam theory. The results will be discussed be- low in comparison with the experimental data. 2.3. Fabrication Method The GRIN and ball fiber lens probes were made from a standard Corning SMF-28 single mode fiber as the prin- cipal light guide, a fiber spacer and a GRIN or a ball fiber lens as the focusing lens. For the GRIN lens probe, a fiber spacer with same outer diameter (0.125 mm) as SMF-28 was fusion-spliced via arc welds to the Corning SMF-28 and then accurately cleaved to a theoreti- cally-determined length. A GRIN fiber was then fu- sion-spliced to the cleaved fiber spacer and precisely cleaved at a pre-calculated length to generate a desired beam-distance profile (i.e., working distance, depth of field, and spot size). For a short working distance probe, the section of the fiber spacer was omitted resulting in a simple fabrication process. For the ball lens probe, a fiber spacer with same outer diameter of SMF was fu- sion-spliced via arc welds to the Corning SMF-28 and then accurately cleaved to a theoretically-determined length plus extra 0.2 mm. The tip of the fiber spacer then was fused via arc welds to a perfect ball shape by input- ting an appropriate fusion setting. To ensure minimum back-reflection for both probes, the indexes of the fiber spacer and the center of GRIN fiber were matched to the core index of the SMF. We used a conventional low cost off-the-shelf optical multi-mode GRIN fibers as the GRIN lens, which has Identify applicable sponsor/s here. (sponsors) 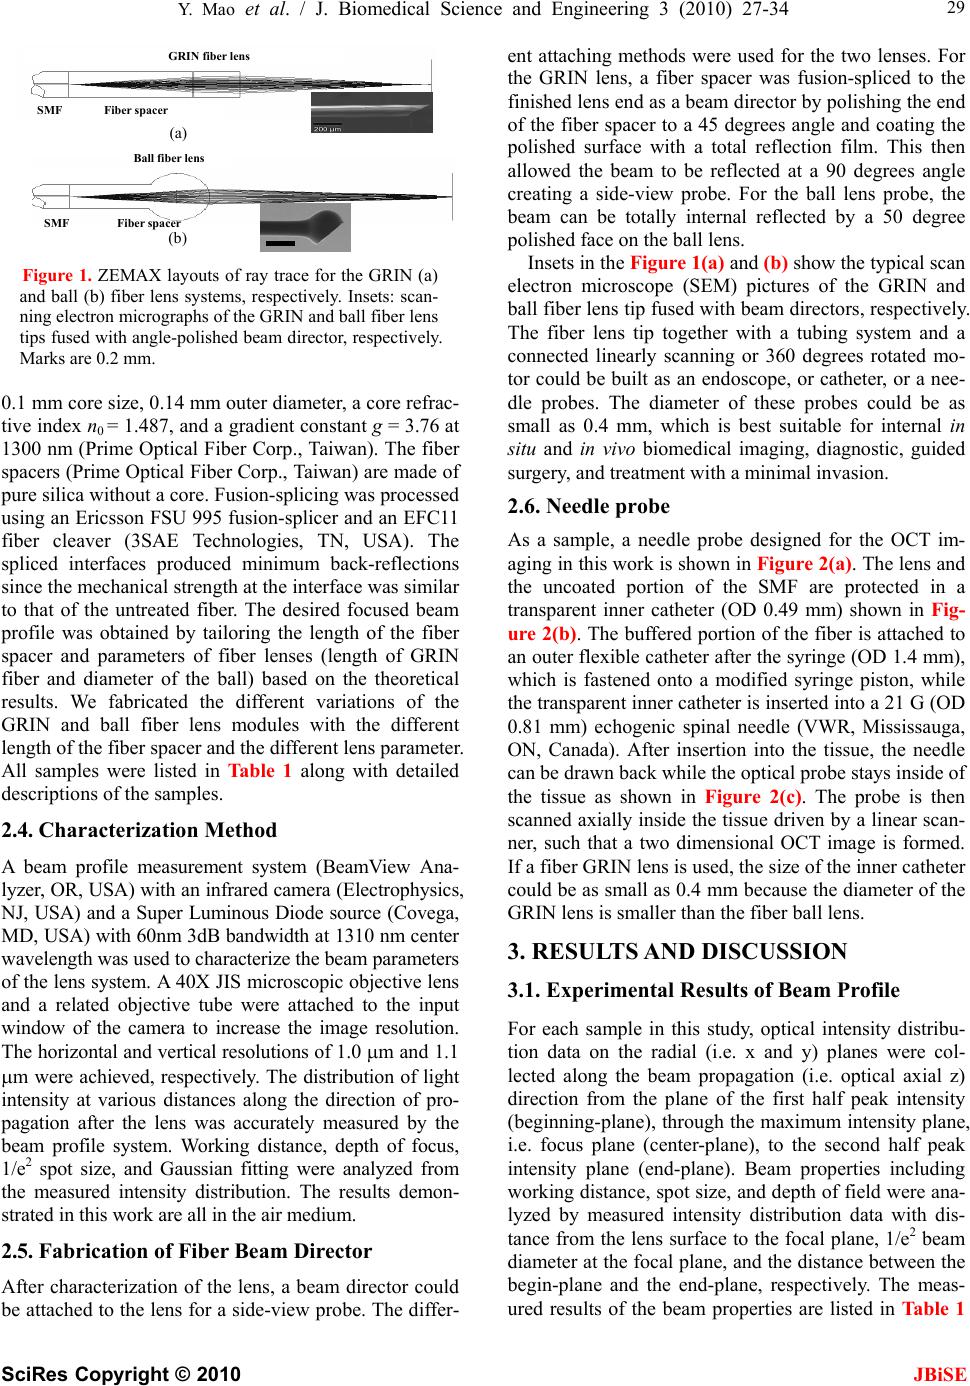 Y. Mao et al. / J. Biomedical Science and Engineering 3 (2010) 27-34 SciRes Copyright © 2010 29 JBiSE Figure 1. ZEMAX layouts of ray trace for the GRIN (a) and ball (b) fiber lens systems, respectively. Insets: scan- ning electron micrographs of the GRIN and ball fiber lens tips fused with angle-polished beam director, respectively. Marks are 0.2 mm. 0.1 mm core size, 0.14 mm outer diameter, a core refrac- tive index n0 = 1.487, and a gradient constant g = 3.76 at 1300 nm (Prime Optical Fiber Corp., Taiwan). The fiber spacers (Prime Optical Fiber Corp., Taiwan) are made of pure silica without a core. Fusion-splicing was processed using an Ericsson FSU 995 fusion-splicer and an EFC11 fiber cleaver (3SAE Technologies, TN, USA). The spliced interfaces produced minimum back-reflections since the mechanical strength at the interface was similar to that of the untreated fiber. The desired focused beam profile was obtained by tailoring the length of the fiber spacer and parameters of fiber lenses (length of GRIN fiber and diameter of the ball) based on the theoretical results. We fabricated the different variations of the GRIN and ball fiber lens modules with the different length of the fiber spacer and the different lens parameter. All samples were listed in Table 1 along with detailed descriptions of the samples. 2.4. Characterization Method A beam profile measurement system (BeamView Ana- lyzer, OR, USA) with an infrared camera (Electrophysics, NJ, USA) and a Super Luminous Diode source (Covega, MD, USA) with 60nm 3dB bandwidth at 1310 nm center wavelength was used to characterize the beam parameters of the lens system. A 40X JIS microscopic objective lens and a related objective tube were attached to the input window of the camera to increase the image resolution. The horizontal and vertical resolutions of 1.0 m and 1.1 m were achieved, respectively. The distribution of light intensity at various distances along the direction of pro- pagation after the lens was accurately measured by the beam profile system. Working distance, depth of focus, 1/e2 spot size, and Gaussian fitting were analyzed from the measured intensity distribution. The results demon- strated in this work are all in the air medium. 2.5. Fabrication of Fiber Beam Director After characterization of the lens, a beam director could be attached to the lens for a side-view probe. The differ- ent attaching methods were used for the two lenses. For the GRIN lens, a fiber spacer was fusion-spliced to the finished lens end as a beam director by polishing the end of the fiber spacer to a 45 degrees angle and coating the polished surface with a total reflection film. This then allowed the beam to be reflected at a 90 degrees angle creating a side-view probe. For the ball lens probe, the beam can be totally internal reflected by a 50 degree polished face on the ball lens. GRIN fiber lens (a) SMF Fiber spacer SMF Fiber spacer (b) Ball fiber lens Insets in the Figure 1(a) and (b) show the typical scan electron microscope (SEM) pictures of the GRIN and ball fiber lens tip fused with beam directors, respectively. The fiber lens tip together with a tubing system and a connected linearly scanning or 360 degrees rotated mo- tor could be built as an endoscope, or catheter, or a nee- dle probes. The diameter of these probes could be as small as 0.4 mm, which is best suitable for internal in situ and in vivo biomedical imaging, diagnostic, guided surgery, and treatment with a minimal invasion. 2.6. Needle probe As a sample, a needle probe designed for the OCT im- aging in this work is shown in Figure 2(a). The lens and the uncoated portion of the SMF are protected in a transparent inner catheter (OD 0.49 mm) shown in Fig- ure 2(b). The buffered portion of the fiber is attached to an outer flexible catheter after the syringe (OD 1.4 mm), which is fastened onto a modified syringe piston, while the transparent inner catheter is inserted into a 21 G (OD 0.81 mm) echogenic spinal needle (VWR, Mississauga, ON, Canada). After insertion into the tissue, the needle can be drawn back while the optical probe stays inside of the tissue as shown in Figure 2(c). The probe is then scanned axially inside the tissue driven by a linear scan- ner, such that a two dimensional OCT image is formed. If a fiber GRIN lens is used, the size of the inner catheter could be as small as 0.4 mm because the diameter of the GRIN lens is smaller than the fiber ball lens. 3. RESULTS AND DISCUSSION 3.1. Experimental Results of Beam Profile For each sample in this study, optical intensity distribu- tion data on the radial (i.e. x and y) planes were col- lected along the beam propagation (i.e. optical axial z) direction from the plane of the first half peak intensity (beginning-plane), through the maximum intensity plane, i.e. focus plane (center-plane), to the second half peak intensity plane (end-plane). Beam properties including working distance, spot size, and depth of field were ana- lyzed by measured intensity distribution data with dis- tance from the lens surface to the focal plane, 1/e2 beam diameter at the focal plane, and the distance between the begin-plane and the end-plane, respectively. The meas- ured results of the beam properties are listed in Table 1  30 Y. Mao et al. / J. Biomedical Science and Engineering 3 (2010) 27-34 SciRes Copyright © 2010 JBiSE Table 1. Structures of the various samples with measured beam properties. Fiber Lens Measured Beam Properties Samples Length of Fiber Spacer (mm) Type Length/ Diameter (mm) Working Dis- tance (mm) Depth of Field (mm) Spot Size ( m) 1 0.52 Ball Lens 0.15 1.00 3.6 50 2 0.55 Ball Lens 0.15 1.40 2.1 45 3 0.62 Ball Lens 0.15 1.20 1.1 27 4 0.70 Ball Lens 0.15 1.00 0.5 20 5 0.75 Ball Lens 0.15 0.90 0.48 18 6 0.00 GRIN Fiber 0.6 0.18 0.16 13 7 0.00 GRIN Fiber 0.55 0.20 0.30 16 8 0.00 GRIN Fiber 0.52 0.28 0.50 22 9 0.00 GRIN Fiber 0.50 0.38 0.60 23 10 0.00 GRIN Fiber 0.48 0.41 0.85 25 11 0.00 GRIN Fiber 0.46 0.40 1.30 30 12 0.00 GRIN Fiber 0.45 0.38 1.45 32 13 0.48 GRIN Fiber 0.17 1.00 0.95 28 14 0.48 GRIN Fiber 0.16 1.10 1.5 35 15 0.48 GRIN Fiber 0.145 1.20 1.8 41 16 0.48 GRIN Fiber 0.14 1.05 2.0 45 along with detailed descriptions of the samples. The theoretical and experimental results of working distance, depth of focus, and spot size of different variations vs. length of GRIN fiber or diameter of the ball lens (bottom x-axis), and length of fiber spacer (top x-axis) are shown in Figure 3(a), (b), and (c), respectively, where, lines represent the theoretical results from ZEMAX at 1300 nm, amount them, dark doted line represent GRIN fiber lens without a fiber spacer, dark and light solid lines represent GRIN fiber lens with a constant length of fiber spacer (0.48 mm) and a constant length of GRIN fiber (0.17 mm), respectively; dark and light dash lines repre- sent ball fiber lens with a constant length of fiber spacer (0.62 mm) and a constant diameter of the ball (0.30 mm), respectively. The related experimental results were rep- resented by points, amount them, triangle points repre- sent GRIN fiber lens and square points represent the ball lens. 3.2. Discussion of Beam Profile Results From the theoretical result shown in Figure 3, short working distance (<0.4 mm) could be obtained by the GRIN fiber lens without fiber spacer shown as the dark dotted lines. To obtain larger working distance, a fiber spacer has to be fusion-spliced between SMF and fiber lens. In these cases, the working distance varies sharply with the length of GRIN fiber for the GRIN fiber lens and with the diameter of the ball for the ball fiber lens, but it varies less sharply with the length of the fiber spacer. The working distances have saturated values for each case. By compensating the working distance with the depth of field and the spot size, the optimized pa- rameters (i.e. 0.9 – 1.2 mm working distance, 0.9–1.1 mm depth of filed, and <30 m spot size) are not at the position of the largest working distance, instead, the op- timized positions are around 0.17 mm length of the GRIN fiber with 0.48 mm length of fiber spacer for GRIN fiber lens and 0.3 mm diameter of ball and 0.62 mm length of fiber spacer for ball fiber lens. From the experimental results shown in Figure 3 and Table 1, we obtained the working distance of 1.0 mm, the depth of field of 0.95 mm, and the spot size of 28 m from a GRIN fiber lens module (sample #13) and the working distance of 1.2 mm, the depth of field of 1.1 mm, and the spot size of 27 m from a ball fiber lens module (sample #3). The results from the ZEMAX nu- merical optical design software were in a good agree- ment with the experimental results. Considering chromatic aberrations, from ZEMAX simulation for the ball fiber lens in the wavelength range of 1260 – 1370 nm, the relative variations of the work- ing distance, depth of field and spot size were calculated all smaller than 4.0%. For the GRIN fiber lens, the range 10mm (a) 1mm (c) 0.4mm (b) Figure 2. OCT side-view needle probe showing the tubing and angle-polished ball lens. (a) needle probe; (b) protective tubing and exposing the lens; (c) retracted needle tip with protective tubing.  Y. Mao et al. / J. Biomedical Science and Engineering 3 (2010) 27-34 SciRes Copyright © 2010 JBiSE 31 0.0 0.2 0.4 0.6 0.8 0.0 0.5 1.0 1.5 2.0 0.0 0.2 0.4 0.6 0.8 Working Distance (mm) Length of GRIN or Diameter of Ball(mm) Length of Fiber Space (mm) 0.0 0.2 0.40.6 0.8 0 1 2 3 4 0.0 0.2 0.40.6 0.8 Depth of Field (mm) Length of GRIN or Diameter of Ball(mm) Length of Fiber Space 0.0 0.2 0.4 0.6 0.8 0 20 40 60 0.0 0.2 0.4 0.6 0.8 Spot Size (m) Length of GRIN or Diamter of Ball(mm) Length of Fiber Space (a) (b) (c) Figure 3. Theoretical and experimental results of working distance (a), depth of field (b), and spot size (c) vs. length of GRIN fiber or diameter of the ball lens (bottom x axis), and length of fiber spacer (top x axis), where, lines repre- sent the theoretical results from ZEMAX at 1300 nm, amount them, dark doted line represent GRIN fiber lens without a fiber spacer, dark and light solid lines represent GRIN fiber lens with a constant length of fiber spacer (0.48 mm) and a constant length of GRIN fiber (0.17 mm), respectively; dark and light dash lines represent ball fiber lens with a constant length of fiber spacer (0.62 mm) and a constant diameter of the ball (0.30 mm), respectively. The related ex- perimental results were represented by the points. of the zero-dispersion wavelengths, 0 is 1297-1316 nm. The zero-dispersion slope, S0, equal to or smaller than 0.101 ps/nm2-km. Using the standard formula offi- ber dispersion, (ps/nm-km), we calculated the changes of refractive index in the 1260 – 1370 nm wavelength range. By using these values in ZEMAX, we calculated the relative changes of the working distance, depth of field and spot size were all smaller than 3%. Based on our results, the desired beam profile for the application of optical biomedical imaging systems can be obtained by the GRIN and ball fiber lens with or without fiber spacers. The technique described 43 ]/4 00 () [/DS here possesses a high degree of flexibility for designing ultra-small optical probes with different beam shapes for the different tissue imaging. For GRIN fiber lens, a beam profile of 15 m spot size and 1mm working distance was reported [19], al- though no detailed GRIN fiber and lens structure de- scription in the paper. The 15 m spot size only could provide less than 0.3 mm depth of field in their OCT system. The patent [16] proposed a beam profile of 30 m spot size and 2 mm working distance by using a spe- cial drawn GRIN fiber with low focus ability. This large working distance could not be achieved by using the conventional low cost off-the-shelf optical multi-mode GRIN fibers, like the GRIN fiber used in this work. In- crease working distance will be our future work. 3.3. Experimental Results and Discussion of Beam Quality We found quality of the beam depends very much on the quality of the surface cleaving and the alignment of the fusion-splicing between the fiber spacer and the fiber lens. The high quality beam is easier to obtain for the probe with the ball fiber lens because the ball is made from the fiber spacer and there is no interface between the fiber spacer and the ball lens. By well controlling the cleaving and the fusion-splicing, we obtained high qual- ity of beam for the probe of the GRIN fiber lens as well. Figure 4 shows measured and Gaussian-fitted 1/e2 in- tensity beam diameters along the axial distance z (zero is the position of the lens surface) at x (horizontal) and y (vertical) radial coordination in the distance range of depth of field for the samples #8 and #13 with the GRIN fiber lenses. In Figure 4, the smallest beam diameter value indicates spot size, x-coordinate value at the pole point indicates the working distance, and the distance range of the curve indicates the depth of field. The working distance of 0.28 mm, depth of field of 0.5 mm, and spot size of 22 m were obtained for the sample #8 with 0.52 mm length of 100/140 GRIN fiber lens and without fiber spacer. The working distance of 1.0 mm, depth of field of 0.95 mm, and spot size of 28 m were 0.0 0.2 0.4 0.6 0.81.0 1.2 1.4 1.6 10 15 20 25 30 35 40 45 #3 #8 Measured X Measured Y Gaussian Fitted X Gaussian Fitted Y Beam Diameter (m) Distance to Lens Surface (mm) #8 #1 Figure 4. Measured and Gaussian-fitted 1/e2 intensity beam diameters along the axial distance (zero is the position of the lens surface) at x (horizontal) and y (vertical) radial coordina- tion in the distance range of depth of field of the samples #8 and #13, which was made from the GRIN fiber lens.  32 Y. Mao et al. / J. Biomedical Science and Engineering 3 (2010) 27-34 SciRes Copyright © 2010 JBiSE Table 2. Measured beam profile images and normalized intensity distributions with Gaussian-fittings at x (horizontal) and y (vertical) radial coordination for sample #13. Begin-Plane Center-Plane End-Plane Images Xa 0 102030405060 0.0 0.5 1.0 Normalized Indensity X Distance (m) 0 102030405060 0.0 0.5 1.0 Normalized Indensity X Distance (m) 0 10203040506 0.0 0.5 1.0 0 Normalized Indensity X Distance (m) Ya 0 102030405060 0.0 0.5 1.0 Normalized Indensity Y Distance (m) 0 10203040506 0 0.0 0.5 1.0 Normalized Indensity Y Distance (m) 0 102030405060 0.0 0.5 1.0 Normalized Indensity Y Distance (m) (a) (b) Figure 5. In vivo human finger OCT images taken with probe #3 (working distance, depth of field and spot diameter of 1.2 mm 1.1 mm, and 27 m) and # 5 (working distance, depth of field and spot diameter of 0.9 mm 0.48 mm, and 18 m). obtained for sample #13 with 0.17 mm length of 100/140 GRIN fiber lens and 0.48 mm fiber spacer. The x and y symmetry of the beam diameter is very good for both samples. The measured beam diameters are well mat- ched to Gaussian-fitted values in the center (focused) regions, but have small deviations on either side of the center regions. To further examine the beam quality of the GRIN fi- ber lens system, Table 2 shows measured beam profile images and measured normalized intensity distributions with Gaussian-fitted results at the x and y directions on the three typical planes (i.e. begin-plane, center-plane, and end-plane) of the sample #13. From the profile im- ages and distributions shown in Table 2, the measured beam profiles match very well with Gaussian distribu- tions at the beginning-plane and center-plane. On the end-planes, the measured and Gaussian-fitted intensity distributions generally match very well despite slight  Y. Mao et al. / J. Biomedical Science and Engineering 3 (2010) 27-34 SciRes Copyright © 2010 JBiSE 33 deviations on both tail ends of the distributions leading to discrepancies between the measured and Gaus- sian-fitted beam diameters as was shown in Figure 4. In addition, the circular shapes in the profile images as shown in Table 2 indicate high x and y symmetry of the beam profiles through all range of depth of field. 3.4. OCT Image Figure 5(a) and (d) show in vivo images of human fin- ger acquired by a SS-OCT with the fiber probes # 3 (working distance, depth of field and spot diameter of 1.2 mm 1.1 mm, and 27 m) and # 5 (working distance, depth of field and spot diameter of 0.9 mm 0.33 mm, and 18 m). The OCT system was described in detail else- where [25]. Briefly, the swept source (HSL2000-HL, Santac) used in the system had a central wavelength of 1320 nm and a full scan wavelength range of 110 nm, which was sweeping linearly with optical frequency with a linearity of 0.2%. The average output power and co- herence length of the swept source was 12 mW and 10 mm, respectively. A repetition scan rate of 20 kHz was used in our system and the related duty cycle was 68%. The output light from the swept laser source was launched into the first coupler and then divided into the sample arm with 90% power and reference arm with 10% power by two fiber circulators. The reference arm was arranged with a fiber collimator and a mirror. A variable attenuator was inserted between the collimator and mirror for adjusting the optical power on reference arm to achieve the higher sensitivity. The light was illu- minated to the fringer through the fiber lensed fiber probe. A galvanometer (Blue Hill Optical technologies) scanner scanned the fiber probe light transversely on the sample up to 4 mm at 20 Hz with 1000 transverse pixels. The total optical power illuminating on the sample was approximately 10 mW. Two polarization controllers (PC) in both reference and sample arms were used for ad- justment to match the polarization state of the two arms. The two-pair output signals from the output couplers were detected with two-pair photodiodes to obtain quadrature signals. Two differential photo-detectors (PDB150C, Thorlabs) were used with adjustable band- width. A 3 dB bandwidth of 50 MHz was used in our system. The two detector outputs were digitized using a data acquisition card (DAQ) (PCI 5122, National In- struments) with 14-bit resolution and acquired at a sam- pling speed of 100 MS/s. The swept source generated a start trigger signal that was used to initiate the function generator for the galvo scanner and initiate the data ac- quisition process for each A-scan. Because the swept source was linearly swept with wave-number k, A-scans data with resolved complex conjugate artifact were ob- tained by a direct inverse Fourier transformation (IFT) from direct DAQ sampling data without any re-sampling process. The image size is 5x2 mm2 with 900x500 pixels. The image depth shown in Figure 5(a) is slightly larger than that in Figure 5(b), but the image is blurrier in Figure 5(a) than that in Figure 5(b), which taken by the probe with larger depth of field and spot size. The image shown in Figure 5(b) has higher resolution than that in Figure 5(a), which can be seen clearly with finer struc- tures in layer of epidermis (grey arrow), sweat gland (white arrow), and blood vessel in subcutis layer (black arrow). 4. CONCLUSIONS We presented a design, construction and beam profile characterization of different variations of graded-index (GRIN) and ball fiber lenses, which were recently pro- posed for ultra-small OCT probes. Those fiber lens mod- ules were made of single mode fibers and GRIN and ball fiber lenses with/without fiber spacers between them. We used fusion-splicing in between the fibers, lenses and spacers to ensure high quality light transmission. We found that beam-distance profiles (i.e. 0.4 - 1.2 mm of focus distance, 0.8 – 1.5 mm of depth of field, and 26 – 35 m of spot size) can be obtained by precisely adjust- ing the lengths of the fiber spacer and the GRIN fiber lens or diameter of the ball lens for the different tissue imaging in human body. Using ZEMAX, optical design software, we modeled our optic probes which proved a precise approach. We obtained very high quality focused Gaussian beam profiles with high x and y symmetry using the conventional multi-mode GRIN fibers and home-made fiber ball lenses. The OCT images shown in this paper indicated the important impact of fiber lens on the image quality. The high quality beam and ultra-small size make such fiber lens based probes very valuable for optical coherence tomography systems. REFERENCES [1] Huang, D., Swanson, E.A., Lin, C.P., Schuman, J.S., Stinson, W.G., Chang, W., Hee, M.R., Flotte, T., Gregory, K., Puliafito, C.A. and Fujimoto, J.G. (1991) Optical co- herence tomography. Science 254, 1178-1181. [2] Chen, Z.P., Milner, T.E., Dave, D. and Nelson, J.S. (1997) Optical doppler tomographic image of fluid flow velocity in highly scattering media. Opt. Lett. 22, 64-66. [3] Izatt, J.A, Kulkarni, M.D., Yazdanfar, S., Barton, J.K., and Welch, A.J. (1997) In vivo bidirectional color Dop- pler flow imaging of picoliter blood volumes using opti- cal coherernce tomography. Opt. Lett. 22, 1439-1441. [4] Yazdanfar, S., Rollins, A.M. and Izatt, J.A. (2001) Ultra- high-velocity resolution imaging of the microcirculation in-vivo using color Doppler optical coherence tomogra- phy. Proc. SPIE, 4251, 156-164. [5] Yang, V.X.D., Gordon, M.L., Qi, B., Pekar, J., Lo, S., Seng-Yue, E., Mok, A., Wilson, B.C. and Vitkin, I.A., (2003) High speed, wide velocity dynamic range doppler optical coherence tomography (Part I): system design,  34 Y. Mao et al. / J. Biomedical Science and Engineering 3 (2010) 27-34 SciRes Copyright © 2010 JBiSE signal processing, and performance. Opt. Express, 11, 794-809. [6] White, B.R., Pierce, M.C., Nassif, N., Cense, B., Park, B. H, Tearney, G.J., Bouma, B.E., Chen, T.C. and de Boer J. F., (2003) In vivo dynamic human retinal blood flow im- aging using ultra-high-speed spectral domain optical co- herence tomography. Opt. Express, 11 , 3490-3497. [7] Yazdanfar, S., Rollins, A.M. and Izatt, J.A., (2000) Im- aging and velocimetry of the human retinal circulation with color Doppler optical coherence tomography. Opt. Lett., 25, 1448-1450. [8] Zhao, Y.H., Chen, Z.P., Saxer, C., Xiang, S.H., de Boer, J. F. and Nelson, J.S. (2000) Phase-resolved optical coher- ence tomography and optical Doppler tomography for imaging blood flow in human skin with fast scanning speed and high velocity sensitivity. Opt. Lett., 25, 114-116. [9] Zhao, Y., Chen, Z.P., Saxer, C., Shen, Q., Xiang, S., de Boer, J.F. and Nelson, J.S. (2000) Doppler standard de- viation imaging for clinical monitoring of in vivo human skin blood flow. Opt. Lett., 25, 1358-1360. [10] Yang, V.X.D., Tang, S., Gordon, M.L., Qi, B., Gardiner, G., Cirocco, M., Kortan, P., Haber, G., Kandel, G., Vitkin, I.A. and Wilson, B.C. (2005) Endoscopic doppler optical coherence tomography in human gastrointestinal tract: initial experience. Gastrointest. Endosc., 61, 879-890. [11] Tran, P.H., Mukai, D.S., Brenner, M. and Chen, Z. (2004) In vivo endoscopic optical coherence tomography by use of a rotational microelectromechanical system probe. Opt. Lett., 29, 1236-1238. [12] Li, X., Chudoba, C., Ko, T., Pitris, C. and Fujimoto, J. G. (2000) Imaging needle for optical coherence tomography. Opt. Lett., 25, 1520-1522. [13] Yang, V.X.D., Mao, Y.X., Munce, N., Standish, B., Ku- charczyk, W., Marcon, N.E., Wilson, B.C. and Vitkin, I. A. (2005) Interstitial doppler optical coherence tomo- graphy. Opt. Lett., 30, 1791-1793. [14] Fujimoto, J.G., Bopart, S.A., Tearney, G.J., Bouma, C.B., Pitris, E. and Brezinski, M.E. (1999) High resolution in vivo intra-arterial imaging with optical coherence tomo- graphy. Heart, 82, 128-133. [15] Diaz-Sandoval, L.J., Bouma, B.E., Tearnay, G.J. and Jang, I. (2005) Optical coherence tomography as a tool for per- cutaneous coronary interventions. Catheter. And Cardio. Interventions, 65, 492-496. [16] Swanson, E., Petersen, C.L., McNamara, E., Lamport, R. B. and Kelly, D.L. (2002) Ultra-small optical probes, imaging optics, and methods for using same. U.S. Patent, 6445939. [17] Shishkov, M., Bouma, B.E. and Tearney, (2006) G.J. System and method for optical coherence tomography. U.S. Patent, 20060067620A1. [18] Reed, W.A., Yan, M.F. and Schnitzer, M.J. (2002) Gra- dient-index fiber-optic microprobes for minimally inva- sive in vivo low-coherence interferometry. Opt. Lett., 27, 1794-1796. [19] Jafri, M.S., Farhang, S, Tang, R.S., Desai, N., Fishman, P. S., Rohwer, R.G., Tang, C. and Schmitt, J.M. (2005) Op- tical coherence tomography in the diagnosis and treat- ment of neurological disorders. J. Biomed. Opt. 10(5), 051603. [20] Li, H., Standish, B.A., Mariampillai, A., Munce, N.R., Mao, Y., Chiu, S., Marcon, N.E., Wilson, B.C., Vitkin, A. and Yang, V.X.D. (2006) Feasibility of interstitial doppler optical coherence tomography for in vivo detection of microvascular changes during photodynamic therapy. Lasers in Surgery and Medicine, 38, 754-761. [21] Sainter, A.W., King, T.A. and Dickinson, M.R., (2002) Theoretical comparison of light sources for use in optical coherence tomography. Proc. SPIE, 4619, 289-299. [22] Mao, Y., Chang, S., Sherif, S. and Flueraru, C. (2007) Graded-index fiber lens proposed for ultrasmall probes used in biomedical imaging. App. Opt., 46, 5887-5894. [23] Kogelnik, H.W. and Li, T. (1966) Laser beam and reso- nators. Appl. Opt., 5, 1550. [24] Emkey, W.L. and Jack, C.A. (1987) Analysis and evalua- tion of graded-index fiber-lenses. J. of Lightwave Tech., LT-5, 156-1164. [25] Mao, Y., Sherif, S., Flueraru, C. and Changm S. (2008) 3x3 mach-zehnder Interferometer with unbalanced dif- ferential detection for full range swept-source optical coherence tomography. Appl. Opt., 47, 2004-2010. |