Estimation of Small Reservoir Sedimentation in Semi-Arid Southern Zimbabwe ()
1. Introduction
About 75% of the population of Zimbabwe live and farm in semi-arid areas where they depend on rain fed agriculture that fails about twice out of five years due to low and erratic rainfall [1] . This forces them to depend on surface and ground water resources which also fail in some years because of unpredictability of seasonal rainfall, high evaporation losses, low conversion of rainfall to runoff and sedimentation in reservoirs.
Small surface reservoirs play an important role of providing ready and useful source of water for various uses to rural communities [2] thus are a buffer during dry seasons and drought years. Surface water from small reservoirs is used for productive water use in small scale community gardens, livestock watering, brick making, building, dip-tank watering and fisheries [3] . Although the surface water resources have improved the livelihood of rural semi-arid communities there is a challenge in the sustainable management of the water resources.
Southern Zimbabwe has about 600 small to medium dams of which some of them were reported to have lost up to 30% of their reservoir capacity (over a period of about 40 years) some 14 years ago [4] . Many of these reservoirs have been exceeded the normal design limits thereby reducing their storage capacity and lifespan [5] . Reservoir sedimentation is a complex process which involves transportation of eroded soil material by runoff and eventual deposition of the soil material when the energy of flow is reduced by reservoir barrier [6] . Catchment erosion is responsible for rapid loss of storage capacity of reservoirs thereby reducing their economic life, thus rendering them inefficient for their intended use [7] .
Erosion is caused by a number of factors that include soil type, topographic relief, plant cover, climate and land use [8] . The land resettlement programme that commenced in 2000 has resulted in deforestation from 1.41% (1990-2000) to 16.4 (2000-2005) [5] where in some instances farms that are mostly suitable for animal rearing were converted to crop production in the semi-arid areas.
Large quantities of sediments can be generated and transported in semi-arid areas as a result of high intensity [9] [10] rains that are frequent especially at the beginning of the season when soils are bare and unprotected which leads to accelerated erosion [11] . Soil erosion reduces as the season progresses since the soils will be protected by grass and trees will be having leaves.
Population increases that exert pressure on the arable land hence causing erosion [12] and the recent climate change threats will further complicate the already threatened water resources and the environment [13] , thus new approaches for surface water management are required The major challenge is posed by sedimentation [14] [15] and the lack of regular surveys to assist decision making on water usage and conservation initiatives. The rate of sedimentation has been a serious problem for reservoir operation and water management worldwide including in Zimbabwe’s semi-arid regions [16] [17] .
In semi-arid areas natural conditions and anthropogenic activities affect the sedimentation processes [18] . The most notable is the inappropriate land uses and human induced land cover changes; these have serious implications to future water supply [19] . Although the communities feel the effects of reduced reservoir capacities there is lake of systematic surveys and the dissemination of impacts extend hence they don’t make conscious efforts to reduce sedimentation [20] . Planning and sustainable management of water resources are very important in semi-arid areas and this can be achieved through reservoirs estimating of the current capacities and sedimentation rates. There has not been any hydrographic survey of these small to medium dams to assess sedimentation hence there is need to come up with a cheap method of determining sedimentation in these reservoirs. The objectives of this paper are 1) to compare Mutangi dam trap efficiency using the grab sampling method, the hydrographic method and the water level-capacity method; 2) determine the capacity loss due to sedimentation from 2000-2012 and 3) estimate the lifespan of the reservoir.
2. Materials and Methods
2.1. Location
The research was carried out in Mutangi catchment area of Chivi district a semi-arid area in the southern part of Zimbabwe (Figure 1). It is located 55 km south west of Masvingo town [21] and close to Chivi centre (20˚15ꞌS, 30˚30ꞌE). The catchment area covers 5.9 km2 of the Runde catchment area [22] . Mutangi is in natural region V and receives an average rainfall of 545 mm per year, with a minimum of 83 mm and a maximum of 1160 mm. The area receives most of its rainfall between November and March in a 6 months rainfall season stretching from October to April. It is drained by an ephemeral stream that branches into four tributaries half way to the top end of the catchment. Generally the area is characterised by water shortages during the dry season and dry years with intermittent midseason droughts in January [23] [24] .
2.2. Soils
Geologically Precambrian gneiss with occasional dolerite intrusion exists throughout the area. Four types of soils exist in Mutangi [25] three types (Figure 2) of which follows a clearly defined topo-sequence, grading from one to the other down the slope [26]. The soils at the top of the catena are generally acidic, nutrient poor deep course sands of shallow to moderate permeability merging into loamy sand soils on the ridge. At the middle of the catena the soils have a duplex character: the top soil properties are similar to those of the ridge crest soils with the lower horizons being clayey (below 60 cm). At the bottom of the catena along the drainage lines, the soils are strongly sodic [25] -[27] .
2.3. Vegetation and Land Use
The vegetation is characterised by Mopane woodland along the drainage lines; mixed vegetation on the hill and north western part of the catchment; cultivated and settled land and fallow land occupying 13%, 17%, 53% and 11% of the total area respectively (Figure 3). Colophospermum mopane and shrub regrowth are dominant on the heavy textured sodic soil. The general land use on the eastern half is rainfed cultivation occupying 56%, 30% is under livestock grazing and 12% is under fallow fields.
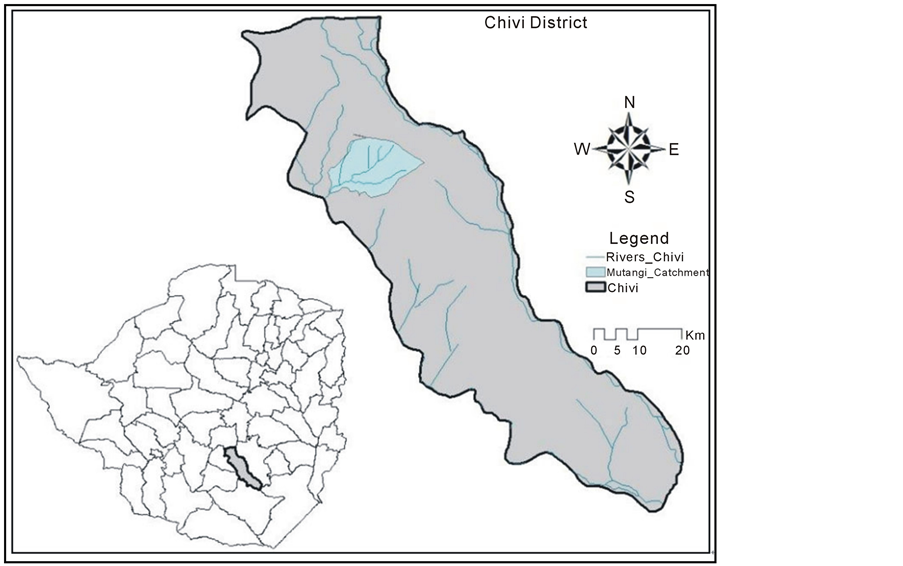
Figure 1. Zimbabwe map showing Chivi district and Mutangi catchment.
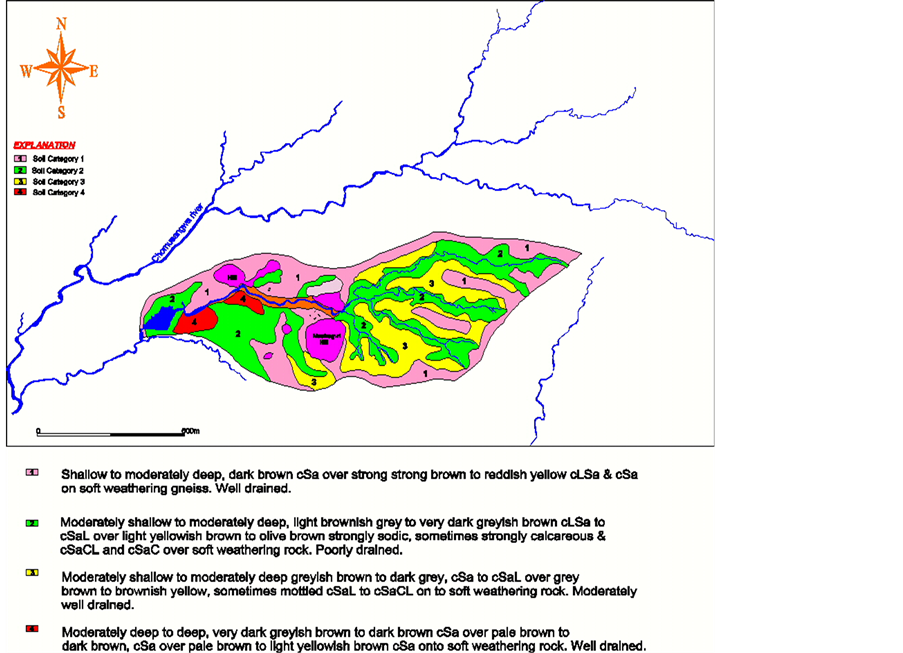
Figure 2. Soil types of Mutangi catchment.

Figure 3. Vegetation cover types of Mutangi catchment area.
3. Methodology
The 2012 dam capacity was determined using the hydrographic surveys, grab sampling and the water depth-capacity method. Sedimentation rate and capacity loss in a decade (2000-2012) was determined by comparing the 2000 capacity to the present capacity at 2012.
3.1. Hydrographic Survey
Hydro graphic survey i.e. survey for ground points under water, was done using a motorized boat. Points of plumbing were marked along the dam for distances of between 50 m to 80 m and less on bends or curvatures and where silt was visible with the naked eye. The points were surveyed and leveled and tied up to the main traverse.
A graduated tag line was stretched between opposite points and 20 litre sealed plastic containers tied to it so that it remained floating. The motorized boat was then used to navigate along the tag line. Depth sounding was then done at 10 m to 20 m intervals along the line. The sounding was done by dropping a weight attached to a string to the riverbed so as to measure the depth of water up to the surface of water. The depth was then subtracted from the water level reading, which was taken hourly when water level was stable. As there was a common datum i.e. spillway level at 100 m, all ground levels underneath the water were easily related to land survey. When all the points had been taken, they were then reduced using the spillway as the stable datum and then plotted using a plotting set on a scale of 1:1000. Contour lines were then drawn on the map at 1m intervals.
Areas between contour lines were then digitized. Volumes for each contour were then calculated using equation 1 and accumulated to get the total capacity.
 (1)
(1)
where Vcontour is the contour volume, A1 = Area 1; A2 = Area 2.
3.2. Trap Efficiency
The percentage of sediments that the reservoir can trap from the total sediments transported to the reservoir was measured using the grab sampling method and estimated using two empirical models one relating trap efficiency to the Capacity-Catchment area ratio (C/W) [28] and the other one relating to the capacity-inflow ratio (C/I) [29] .
3.2.1. Grab Sampling
Storm runoff water samples were collected at the end point of the throw back of the reservoir using 500 ml sampling bottle. Sampling after the rainfall event increased the chances of getting peak sediment concentration. The sampling bottles were dipped to a depth of about 30 cm below the water level so as to have a more representative sample. Sediments concentration is high beneath the water surface because of the interchanging of particles in solution, saltation and suspension. Sediment concentrations for the rain season 2011/2012 was determined using the weighing and filtration method and sediment samples were randomly taken from the shallow to the deepest points of the reservoir using a hand auger. The average sediment density was calculated. Quantification of sediments was then done using the following series of equations:
 (2)
(2)
where: MAI is the gross mean annual reservoir inflow (m3·yr−1), CA is the catchment area (m2), MAR is mean annual runoff (m·yr−1).
 (3)
(3)
where: SRg is gross storage ratio, DC is the gross dam capacity,
 (4)
(4)
where TE is the trap efficiency using the grab sampling method.
3.2.2. Capacity-Catchment Area Ratio (C/W)
The reservoir trap efficiency (TE) was calculated based on [28] and [30] .
 (5)
(5)
where C is the reservoir storage capacity (m3), W is the catchment area (km2), D is reservoir coefficient ranging from 0.046 to 1, with a mean value of 0.1. A D value of 1 was used in the research based on [28] ’s assertion that for reservoirs in regions with smaller and variable runoff.
3.2.3. Capacity-Annual Inflow Ratio (C/I)
 (6)
(6)
where: C is the capacity of the reservoir (m3), I is the annual inflow (m3).
The average TE was found from the two empirical models.
 (7)
(7)
SM is sediment mass entering the reservoir annually (t·yr−1), SC is the sediment concentration (t·m−3).
 (8)
(8)
SVp is the potential sediment volume deposited in the reservoir annually (m3·yr−1), SM is the sediment mass entering the reservoir (t·yr−1), D is the density of deposited sediments (t·m−3).
 (9)
(9)
SVa is the actual sediment volume (m3) (capacity lost due to sedimentation), SVp is the potential sediment volume deposited in the reservoir annually (m3·yr−1), TE is the trap efficiency of the reservoir (%).
 (10)
(10)
where ASY is the area specific sediment yield (t·ha−1·yr−1), A is the catchment area (ha).
3.3. Capacity Determination Using Water Depth-Capacity
The water levels changes in the dam for 2 season/years (2010/2011 and 2011/2012) recorded using an automatic water level recorder mounted on a platform extending from the dam wall to reach sufficiently deep water to record the lowest likely water levels. The water level head was lowered on to the reservoir bed making sure that it’s not sinking into the sediments or too way above the bed. This was repeated in the second season to make sure that the water level head was not under sediments from the previous season. The water level/depth in the reservoir was recorded at 10 minute intervals with 1 mm accuracy. The water level/depth data was used to compute the capacity of the reservoir. The level at which the spillway spills water was used as the depth marking the maximum water level and thus current capacity. The water levels/depth was transformed into capacity using transformation equation for the dam:
 (11)
(11)
where V—volume of water at depth (m3), D is the depth of water recorded by the automatic water level (m).
The water levels were also used to validate the survey done by checking the new/ current level of full supply that is the water depth at which overflows occurs at the spillway. The capacity of the dam at the depth of overflow was compared to the depth at which overflow were expected in 2000.
4. Results
4.1. Rainfall and Sediment Concentration
Monthly rainfall figures for the 2011/12 season are shown in figure 4 where 313 mm were received and was 43% below the long term average. The season started early but effective rains were received late in November. Early rains volumes and distribution was very variable to warrant early planting and generation of measurable stream runoff. Most rains (39% of the total rainfall) were received in the month of December and there was a dry spell in January from the 5th to the 26th.
Sediment concentrations for the 2011/2012 season are presented in Figure 5. The sediment concentration ranged from 3590 - 5880 m·gl−1. The highest sediment concentration were recorded at the onset of the rain season in December where the highest amount of rainfall was received and decreased as the season progressed to April. The monthly sediment concentrations were significantly different from each and there was a 37% decrease in sediment concentrations from December to April.
4.2. Rainfall and Capacity Changes of Mutangi Reservoir (2000-2012)
Annual rainfall figures from 2000 to 2012 and deviation from the long term mean are presented in Figure 6. Most of the annual total rainfalls (61%) were below the long term annual average, rainfall above the long term average of 685 mm, 623 mm, 638 mm, 5985 mm and 579 mm were received in 2000, 2003, 2007, 2009 and 2010 respectively. Extrem negetive deviations from the mean were recorded in the hydrological drought years (2002, 2008 and 2012). Percentage rainfall deviations from the mean ranged for rainfall total above the mean ranged from 5% - 30% and deviations below the long term mean ranged from 3% - 56%.
Reservoir capacity change for the year 2000 to 2012 and summary of the parametric changes in Mutangi reservoir are presented in Table1 Hydrographic surveys of 2000 concured with an increase in the spillway thus increase in capacity of the dam to 160 × 103 m3. The capacity at 2012 was reduced to 96 × 103 m3 at the same full supply level (FSL) of 100 m. The decrease in the capacity represent an average of 37% capacity loss over a 12-year period (2000-2012). The reserrvoir bed has been raised by close to 1 m indicated by the difference between the reduced level of the bed at 2000 (97 m) and between 97.5 m and 98 m at 2012 (Table 1).
4.3. Comparative Sedimentation Rates and Capacity Loss for Different Methods
Sedimentation rates from three methods are presented in Table2 Capacity loss due to sedimentation of between

Figure 4. Monthly rainfall figures for the 2011/12 season.

Figure 5. Monthly average sediment concentration for 2011/ 2012 season.

Figure 6. Total annual rainfall received 2000 to 2012.

Table 1. Summary of the reservoir survey and calculated parameters for Mutangi reservoir.
Table 2. Sedimentation rates and capacity loss for different methods.
36% - 40% over a period of 12 years (2000-2012) was recorded. The hydrographic method estimated capacity loss of 37.3%, grab sampling 39.7% and the water level method estimated a capacity loss of 36.1% which shows that there is not much difference in the prediction of capacity loss using the three methods. The percentage capacity loss corresponds to volumetric losses of 3415.9 m3, 3644.3 m3 and 3306.3 m3 per year for the hydrographic, grab sampling and water level-capacity method respectively.
C-capacity in 2000, CC-current capacity, CL-capacity lost to sedimentation, SV-sediment volume, DS-Dead storage, RS-Rate of sedimentation, ASY-Area specific sediment yield.
Rates of sedimentation were 8539 t·yr−1, 9110 t·yr−1 and 8265 t·yr−1 for the hydrographic survey, grab sampling and water depth-capacity method respectively. The area specific sediment yield (ASY) ranged from 14 - 16 t·ha−1·yr−1 (average = 14.6 t·ha−1·yr−1). At the current rate of sedimentation it has been projected that the dead level of the reservoir will be lost to sedimentation in 4 years (Table 3) and the useful life of the reservoir is estimated to be 30 years.
5. Discussion
The decreasing trend in sediment concentration from December to April is a result of loose soil in the catchment due to animal trampling in the dry summer. On the onset of the rain season there will be no to very sparse vegetation because of dormancy and overgrazing that would have taken place in the animal free range period hence there is increased sedimentation due to high levels of erosion [31] . There is nothing to reduce the kinetic energy
Table 3 . Projected reservoir life span.
of raindrops and runoff. As the season progress the vegetation (grass, trees and crops) are well established [32] hence sedimentation is reduced. The vegetation canopy reduces the kinetic energy of raindrops to detach soil particles and reduce the transporting power of runoff [33] . As the ground cover improves it acts as silt trap and slope stabiliser thus less sediments are carried to the reservoir [34] . The sediment concentrations of Mutangi catchment areas indicate that the catchment is moderately to poorly conserved [35] .
The three methods grab sampling, hydrographic and capacity-depth methods were almost similar in estimating the capacity loss, SV and RS. Comparisons done by Mavhima et al. [6] showed that the three methods did not vary much with their variations within 30%. Grab sampling recorded 30% more sediment specific yields compared to the hydrographic methods but this was recorded in a wetter environment which is not as degraded as Mutangi catchment.
The differences in the three methods used in the capacity loss can be attributed to the procedures followed in the different methods, grab sampling is a point method of measuring sediments in a dam and uses a series of predetermined formula and assumptions but it takes seasonal variations of sediment loads [6] . The hydrographic survey methods is physical survey of the dam basin to ascertain capacity lost over a period thus assuming that rate of sediment deposition is uniform over a given period but distribution of the sediment is different within the dam basin. The water depth-capacity method like the hydrographic method is based on the assumption that deposition of sediments is uniform over a given period and is different in that it assumes that the distribution of the sediments in the basin is uniform. The water-depth capacity method is also dependent on initial physical surveys that produce the depth-capacity relationship curves and equations. Although the three methods perform slightly different (within 30% of each other) all can be used in the estimation of reservoir sedimentation in the semi-arid areas. The depth capacity method however can be more relevant as it will have high initial cost but giving consistent and accurate yearly level. This is because the water level recorder is installed once and records automatically. The problem will be in years when the dam does not experience overflows. The other two methods are physical and expensive resulting in inconsistence of sediment data; this against the background that accuracy of sediment yield is related to frequency of sediment surveys [36] .
However, the close similarity of the sedimentation parameters obtained using the three methods suggests that in the absence of a hydrographic survey any of the two methods can be used to determine sedimentation in similar semi-arid environments.
The significant capacity loss due to sedimentation of 37% in 10 years can be attributed to an increased spillway height in 2000, poor conservation in the catchment and the cropping of marginal lands. Increasing the spillway height of a reservoir increases the wet freeboard and the trap efficiency. The spillway height was meant to increase the storage capacity of the dam and to facilitate construction of a weir to measure outflows from the dam. The increased reservoir trap efficiency increases the probability of all sediments settling in the basin [29] [37] [38] . The situation is made worse by reduced inflows as a result of reduced rainfall amount, spatial and temporal variability [39] [40] . Reduced inflow results in the reservoir not filling up thus the dam can trap all sediments from the catchment area in three out of five years.
The design trap efficiency was greater than 100% since the gross storage ratio for the dam is greater than 0.1 [35] . The trap efficiency as at 2012 has decreased by at least 3.5%. The reduction in TE is an indication that sedimentation has been taking place in the reservoir [6] . Although increasing the spillway height had an effect of increasing the trap efficiency, this can only be in the immediate years after increase thereafter the trap efficiency decreases. Sedimentation results in the rising of the reservoir bed thus reducing the wet freeboard or the spillway height therefore spills can be experienced at low capacity [4] . The increased spills reduce the amount of sediment that will settle at the reservoir bed thus reduced trap efficiency.
6. Recommendations
The reduction of the reservoir’s useful life by 30 years should encourage the community to act towards the reduction of sediment transport to the reservoir. There is need for improving the catchment conservation initiatives in the entire catchment. The grazing lands need to be managed by reducing the stock and reduce the effect of overstocking. In this regard, the involvement of the local population in anti-erosion management activities is an important prerequisite. Thus, the community should be educated as to the consequences of accelerated reservoir sedimentation. The soil erosion and control should minimize the amount of disturbed soil and improve tillage systems, prevent runoff by capturing it using water conservation structures like deepened contours and infiltration pits. The catchment should be conserved with vertiver grass across the slope to slow down runoff and construction of sediment ponds before the runoff reaches the reservoir. There are other land use activities that are increasing the rate of sediment transport into the reservoir like brick laying in the radius of 500 m in the upslope of the reservoir. These activities should stop to reduce sedimentation. The rate of sedimentation in Mutangi catchment if not attended to, will result in further compromise of the food security and increase the vulnerability of the community to water shortages.
Acknowledgements
This publication is an output from a project funded by the British Council/Development Partnerships in Higher Education (DelPHE) (Grant number 584). The views expressed are not necessarily those of the British Council. The authors would particularly like to thank the people of Mutangi for their assistance and participation in the research.
NOTES
*Corresponding author.