Electrowinning of Copper Using Rotating Cylinder Electrode Utilizing Lead Anode ()
1. Introduction
The recovery of metals from aqueous solutions by electrolytic means has been a major factor in extractive technology during the last decades. The source of metal can be an ore as well as waste residue (scrap metals, dusts, sludges collected from metallurgical operations, etc.). One of the aims in studying metal electrowinning is to gain better understanding of the metal electrodeposition process, with emphasis on the role of additives and transport on electro-crystallization. The increase in the world’s demand for high-purity copper has sparked an expansion in the production of copper. To produce high-purity copper, copper is sent as a solute in an aqueous solution to the electrowinning plant. In this plant, an electric current is used to remove the copper from solution into flat sheets of metal. These flat sheets are 99.97% copper, which is the purest form of copper “industrial wise” produced from any production process [1]. It is well known that the introduction of small amounts of certain substances in electrodeposition baths leads to marked changes in the nature of metallic deposits obtained at the cathode. It is well known that small quantities of these substances may stop dendrites growing and improve significantly the smoothness of the cathodic surface [2]. Thiourea [3], gelatine [4], animal glue [5], polyacrylamides [6] and various mixtures of additives [7] are commonly used as levelling and brightening agents in copper electrodeposition and electrowinning. The development of suitable additives as substitutes for thiourea and gelatine remains an interesting research direction, since it has been established that thiourea decomposes, leading to contamination of the cathodic deposit with sulfur [5]. Within each electrolytic cell, electrical current is passed through the electrolyte from the anode to the cathode. In the copper electrowinning process, the electrolyte is an aqueous solution containing copper sulphate (CuSO4) and sulphuric acid (H2SO4) at temperatures ranging from 25 to 45˚C [1]. As current is passed, copper is removed from the electrolyte and deposited onto the cathode. The potential applied to the cell is terminated once the desired thickness of electrowon copper is reached at the cathode. This takes between 5 and 14 days depending on the applied current density (current per unit area of the electrode). The potential applied to produce the current creates both primary and secondary reactions within the electrolytic cell. At the cathode, a primary reaction deposits copper onto the cathode:
 (1)
(1)
A secondary reaction, at low concentrations of copper, releases hydrogen bubbles at the cathode:
 (2)
(2)
At the anode, a primary reaction occurs that produces oxygen bubbles. The overall reaction occurring at the anode can be seen below:
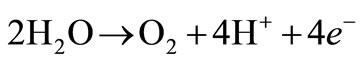 (3)
(3)
Finding the middle ground between mass production in the industry of metal powder extraction and purity as well as size of the produced crystallites is a compromising task, therefore, this work aims to investigate the effect of lead anode and RCE on the electrowinning of copper with respect to the quality and quantity of copper powder; respectively. A parallel goal of this investigation is to study the effect of 12-DHP and temperature as crystallite size, morphology, structure and purity modifiers, which supported by XRD, SEM and EDS.
2. Experimental
All chemicals were Analar grade and supplied by BDH chemicals Ltd. Solutions were prepared with water of resistivity 15-MW cm and copper sulphate concentration and content were checked by the iodine-thiosulphate method [8]. The density and viscosity for all solutions were measured at 298, 303, 308 and 313 K [9] and the data are listed in Table 1.
A standard 1000 mL glass-type cell with a polypropylene lid was used in all electrochemical experiments [9]. The polypropylene lid contained four inlets, which were used for working electrode WE immersion, luggin probe (reference electrode RE: saturated calomel elec-
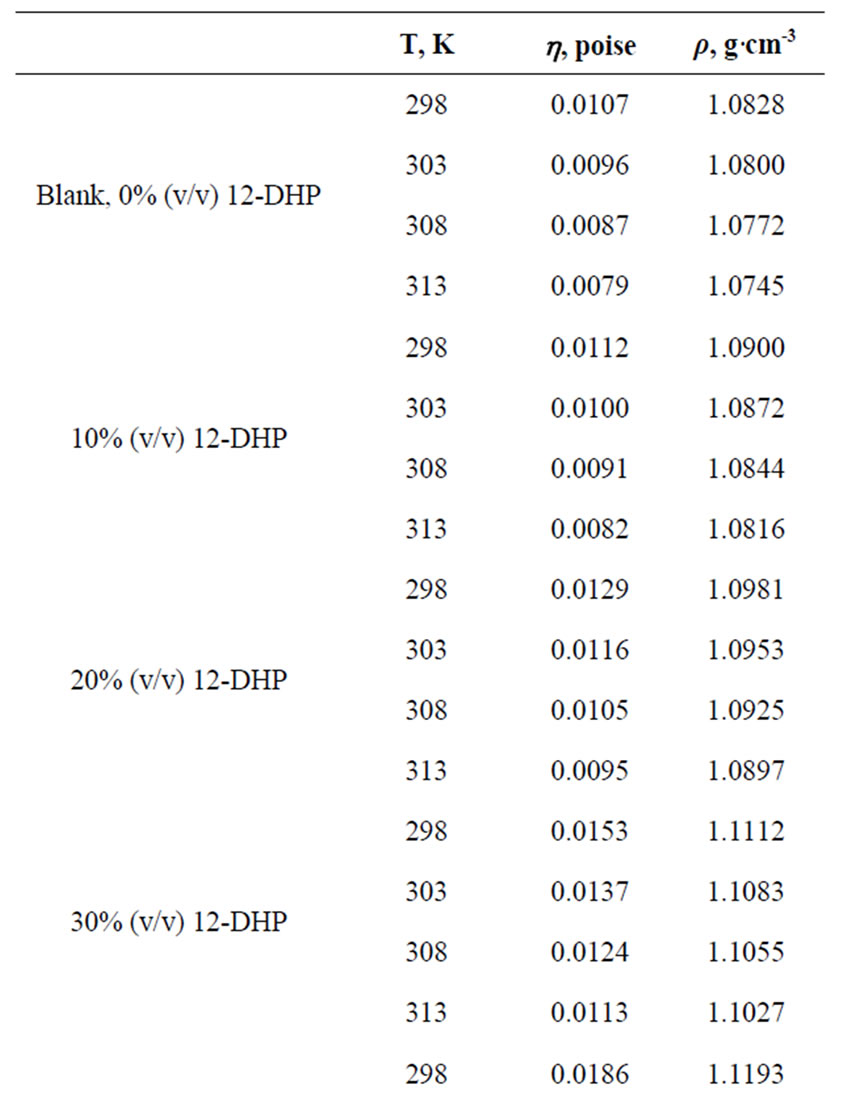
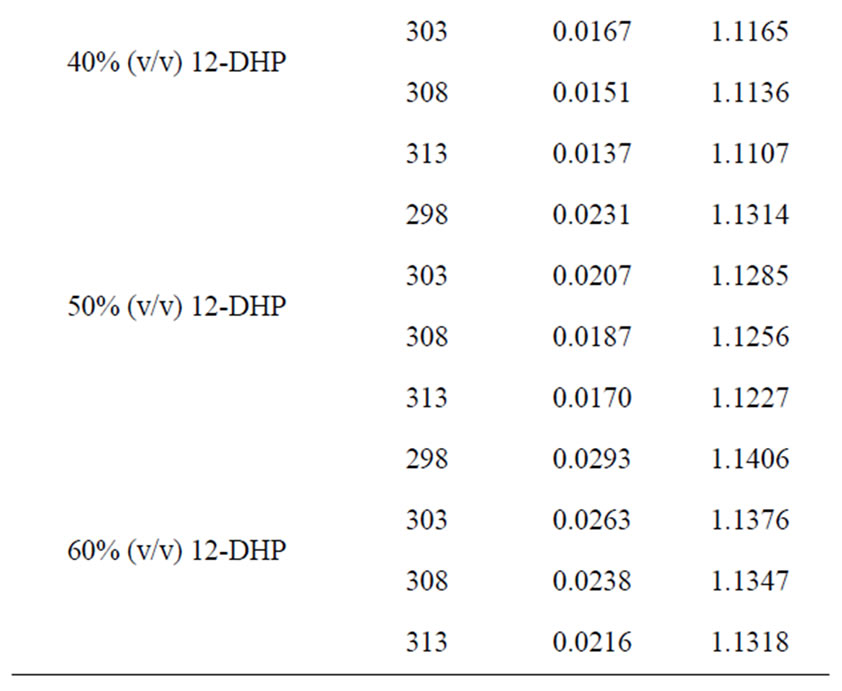
Table 1. Values of Viscosity, h, and density, r, for all solutions at different temperatures.
trode, SCE), counter electrode CE (lead sheet) and thermometer to measure the temperature. A 99.9% purity copper cylindrical sample was used as WE. This sample was rotated at controlled rates by an analytical rotator model A.S.R. made by PINE Instrument Company. The cylindrical samples of copper had dimensions of 8 mm height and 12 mm diameter. The specimens were lightly abraded with 1200 grade silicon carbide paper, washed with distilled water, acetone and deionized water and dried in a cool air stream prior to use. The anode CE, was machined from analytical highly pure lead sheet (99.99%) with exposed surface area of 5 cm × 10 cm. the separation distance between WE and CE was kept constant at 5 cm for all experiments. In order to ensure a correct control of the specimen rotation rate and the correct recording of potentials, regular checking of the rotation rate was carried out.
The Potentiostat was Ministat Precision Potentiostat made by Thompson Electrochem Ltd. coupled to a Chemical Electronics (Birtley) Ltd. Sweep Generator and controlled by a PC via an Advantech PCL-718 Lab Card and a PCLD-780 wiring terminal board. In this system the Advantech Labtech Aquire software was used. All electrochemical experiments and polarization curves were carried out using a potentiodynamic method. The sweep rate in all experiments was 100 mV·min−1, which considered being suitable for copper electrodeposition [10].
2.1. Cathodic Polarization
The variables used in this investigation were rotation speed (0 - 1000 rpm), temperature (298 - 313 K), and blank solution (0.1 mol·L−1 CuSO4 and 1.5 mol·L−1 H2SO4) with and without 12-DHP 10 - 60 % (v/v) with a sweep range of 700 mV starting from the open circuit potential.
2.2. Cyclic Voltammetry
The main purpose of this part is to make sure that the solution under investigation does not change by changing the temperature or the applied potential. The polarization range in these experiments was +0.1 to –0.9 V vs. SCE. The polarization was potentiodynamic without rotation, i.e. free convection with employing lead as anode. The variables, were temperature (298 - 313 K) and blank solution (0.1 mol·L−1 CuSO4 and 1.5 mol·L−1 H2SO4) with and without 12-DHP 10% - 60% (v/v). The polarization was cyclic polarization begins at +0.1 V and ends the half cycle at –0.9 V, then the second half cycle begins at –0.9 V and ends the whole cycle at +0.1 V where the experiment started.
2.3. Morphology and Composition Analyses
An AMRAY 1810 Scanning Electron Microscope (SEM) was used to examine the surface topography of specimens after experiment, while Energy Dispersive X-Ray Analysis (EDS) was used for elemental analyses. The specimens were examined through an acceleration potential of 20 KeV; the specimens were coated with carbon to avoid electron charging of the surface. The specimens were made of copper rods that were cut into small pieces of dimensions 0.8 cm height and 1.2 cm diameter. The surfaces for SEM analyses were polished with series of silicon carbide paper grades 120 mm - 1200 mm, then with 3 mm diamond paste followed by 1 mm diamond paste on a polishing wheel. After washing with deionized water and degreasing in acetone, warm air was blown over the surface. These specimens were stored in a desiccator over silica gel prior to use. Temperature; 298 K – 313 K, 12-DHP content; 0 - 60% (v/v), rotation rate; 0 - 1000 rpm; and time; 10 - 30 minutes; were the different variables that have been employed to study the surface topography by SEM. X-ray diffraction (XRD) measurement for copper powder was carried out using a Shimazu XRD-7000 X-Ray Diffractometer with Cu-Kα1 radiation operated at 40 kV and 30 mA, with a scan speed of 2θ min−1.
3. Results and Discussion
3.1. Cyclic Voltammetry
The stability of organic additives, whether they are solids or liquids, plays an essential role to maintain the bath reproducibility and in turn affects the deposit quality. In order to check the stability of the present bath, cyclic voltammetry experiments were carried out for all solutions at different temperatures in the natural convection regime. This cyclic voltammetry led to compare the values of the limiting current density in the first half cycle (il-1st) with those in the second (il-2nd) and an empirical parameter, S, was obtained using equation (4), where S is called the departure percent:
 (4)
(4)
Table 2 summarizes the values of S for all solutions at all experimental conditions, while Figure 1 represents the variation of S with the mole fraction of 12-DHP at 298 K and 313 K in the natural convection regime. Figure 1 shows that S decreases with increasing temperature in all proportions of 12-DHP; while within the same temperature range of 298 K it increases up to 30% 12-DHP (v/v) then fluctuates downwards between 40% and 50%
Figure 1. Variation of the departure percent, S, with the mole fraction, X, of 12-DHP at zero rotation and at (1) 298 K, (2) 313 K.
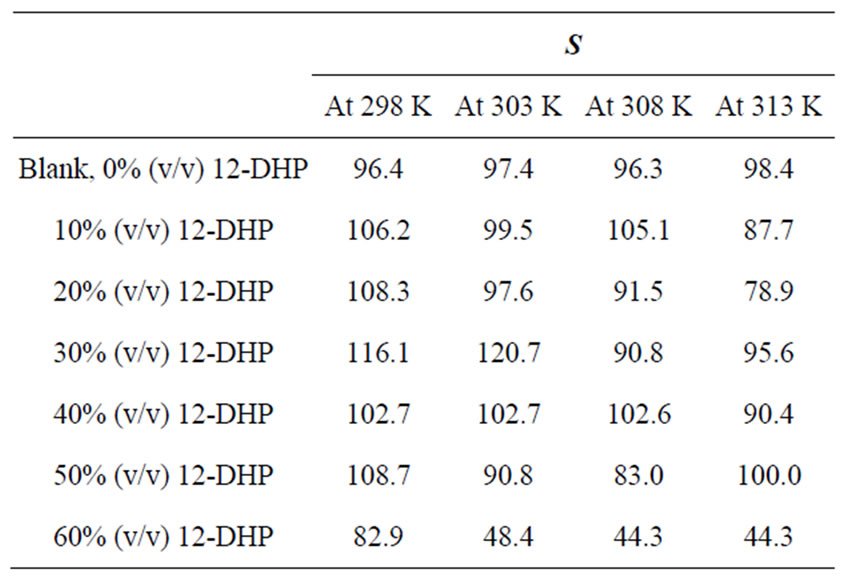
Table 2. Values of the average departure percent, S, for all solutions at different temperatures.
12-DHP (v/v) and finally reaches the minimum value at 60% 12-DHP (v/v). At 313 K it decreases up to 20% 12-DHP (v/v) then fluctuates upwards between 30 and 50% 12-DHP (v/v) and lasts with the minimum value at 60% 12-DHP (v/v). As an explanation of Figure 1, the departure percent, S, may represent the stability of the organic additive in the given medium and under the effect of the experimental conditions, more investigation is needed to generalize this definition. Nevertheless, if controlling the sweep rate could reduce this departure, then it will consider as a simple, cheap and precise method of estimating the right sweep rate that is valuable in industrial electrochemistry. In addition, it considered as an early warning test in case of using organic solvents, since organic solvents are easily evaporate and decompose.
3.2. Cathodic Polarisation
Values of the limiting current densities were measured from the polarization curves of all solutions at different rotations and different temperatures are given in Table 3. It is clear in Table 3 that the limiting current density increases with increasing the speed of rotation, which proves that the electrodeposition (electrowinning) process of copper in presence of 12-DHP as well as in aqueous media is diffusion-controlled reaction [2]. The relation between the limiting current densities, il, and the mole fractions, X, for 12-DHP solutions at different temperatures and 500 rpm is revealed in Figure 2 as an example. Noticeably, the limiting current density decreases with increasing 12-DHP mole fraction and increases by increasing temperature.
The increase of mass transport under forced or turbulent conditions may refer to [11] solution temperature elevation, roughness of the deposit and/or the increase of agitation. Equation (5) was used to calculate the mass transfer coefficients, k, for 12-DHP solutions.
 (5)
(5)
where: n = number of electrons involved in the reaction, F = Faraday constant = 96500 (coulomb mol−1, coulomb = A.s.), Co bulk concentration of copper sulphate (mol cm−3).
The percentage of inhibition efficiency, P, was calculated from equation (6) and its values are listed in Table 4. The percentage of inhibition caused by 12-DHP was in the range of 0.00 - 89.91% depending on the concentration of 12-DHP and the temperature. The relation between the percentage of inhibition, P, and the mole fraction of 12-DHP, X, at 308 K and different rotations is represented in Figure 3 as an example. It is observed from Figure 3 and Table 4 that P increased as X increased and as temperature decreased, but it was not affected by rotation. This indicates that the rotation factor

Figure 2. Variation of limiting current density, il, with the mole fraction, X, of 12-DHP at 500 rpm and at (1) 298 K, (2) 303 K, (3) 308 K, (4) 313 K.

Figure 3. Variation of the inhibition percentage, P, with the mole fraction, X, of 12-DHP at 308 K with different speeds of rotation.
has little effect on the adsorption process and the decrease in mass transfer coefficient in this case is attributable to the increase in the interfacial viscosity [12], which caused by the adsorption of alcohol molecules at the cylinder surface with their non-polar ends, while the polar ones are directed towards solution.
 (6)
(6)
To investigate the mechanism of electrodeposition process, the activation energies, Ea, of the process were calculated from the values of the limiting current densities in presence and in absence of 12-DHP at different temperatures according to Arrhenius equation:
 (7)
(7)
where A is a pre-exponential factor related to concentration, steric effects, metal surface characteristics...etc; R is the molar gas constant and T is the absolute temperature.
Figure 4 shows the relation between ln (il) against 1/T for the 12-DHP solutions at 500 rpm as an example. Straight lines were obtained and Ea values were calculated using equation (7) and their values are given in Table 5. Thermodynamic parameters, the enthalpy of activation, ΔH*, entropy of activation, ΔS*, and free energy of activation, ΔG*, were calculated and their values are also listed in Table 5.
The activation energy of the process, Ea, is an important parameter for determining the rate-controlling step. If the rate-controlling step [13] is the diffusion of aqueous species in the boundary layer then Ea is generally Ő ≤ 28 kJ mol−1, while Ea values usually > 43 kJ mol−1 if adsorption of species on the reaction surface and subsequent chemical reaction takes place. Table 5 shows that in case of blank solution, values of Ea are smaller than those obtained on adding 12-DHP indicating that 12-DHP affecting, in somehow, the mechanism of solvation. For instance, the acidity (proton availability) is decreased with the addition of an alcohol to a pure acidified aqueous solution. This decrease may be attributed to [8] the gradual breakdown of a quasi-crystalline tetrahedral structure of water caused by interposition of alcohol molecules. Thus, the acidity of the medium decreased due to
the change in the state of solvation. Table 5 shows also that all Ea values are lower than 43 kJ mol−1; characterizing diffusion processes are controlling the electrodeposition reaction. Figure 5 is another presentation of controlling the crystallite size as a parameter of two variables, the composition of 12-DHP and the speed of rotation. As it is shown in Figure 5, the highest composition of 12-DHP does not mean the lowest Ea value and vice versa as well as does the same meaning on the speed of rotation. From Table 5, it is also noticed that the weak dependence of ∆G* on the composition of the organic solvent can be attributed largely to the general linear compensation between ∆H* and ∆S* for the given temperature.
The angular velocity, ω, is given by equation (8). Figure 6 gives the relation between the limiting current density and the angular velocity, ω, to the power 0.7 at different compositions of 12-DHP and at 298 K as a representative graph. In Figure 6, straight lines were obtained and the limiting current density increases by increasing rotation, which indicates that the electrodeposition reaction is diffusion-controlled reaction [11].

Figure 5. Variation of activation energy, Ea, with the speed of rotation, rpm, for (1) Blank, (2) 20% (v/v) 12-DHP, (3) 40% (v/v) 12-DHP, (4) 60% (v/v) 12-DHP.

Figure 6. Variation of the limiting current density, il, with the angular velocity to a power 0.7, ω0.7, at 298 K for (1) Blank, (2) 10% (v/v) 12-DHP, (3) 20% (v/v) 12-DHP, (4) 30% (v/v) 12-DHP, (5) 40% (v/v) 12-DHP, (6) 50% (v/v) 12-DHP, (7) 60% (v/v) 12-DHP.
 (8)
(8)
The diffusion coefficient of Cu2+ ions, D, in different solutions was determined from the values of limiting current densities using Eisenberg equation [14]:
 (9)
(9)
where Cb is the bulk concentration (mol·cm−3), U is the peripheral velocity = ωr in cm·rad·s−1 (r is the radial distance in cm) or U = 2πωr in cm·s−1, d is the characteristic length for the rotating cylinder in cm, and υ is the kinematic viscosity in stoke (υ = η/ρ, η is the viscosity in g·cm−1·s−1 and ρ is the density in g·cm−3).
The diffusion coefficient; D, of Cu2+ ions in solutions containing alcohols decreases due to the increase in the interfacial viscosity [15], η, in accordance with the Stokes-Einstein equation:
 (10)
(10)
To obtain an overall mass transfer correlation under the present conditions by using the method of dimensional analysis we suppose:
 (11)
(11)
where: Sh, Re and Sc are the Sherwood (Sh = kl/D), Reynolds (Re = lU/υ) and Schmidt (Sc = υ/D) numbers; respectively and a and b are empirical constants, c = 0.33 (indicating forced convection).
Table 6 summarizes the values of dimensionless groups (Sh, Sc and Re) at 298 K as an example of the data. By plotting  against
 , a straight line was obtained its slope gave the constant b while the intercept gives the other constant a. figure 7 shows the overall correlation at all experimental variables. Constants a and b were extracted by applying Figure 7 on the data and the values are given in Table 7. The present results agree with the polarographic studies [16,17] conducted in solutions containing surfactants where it was found that the diffusion current decreases in

Figure 7. Overall mass transfer correlation under the present experim-ental variables.
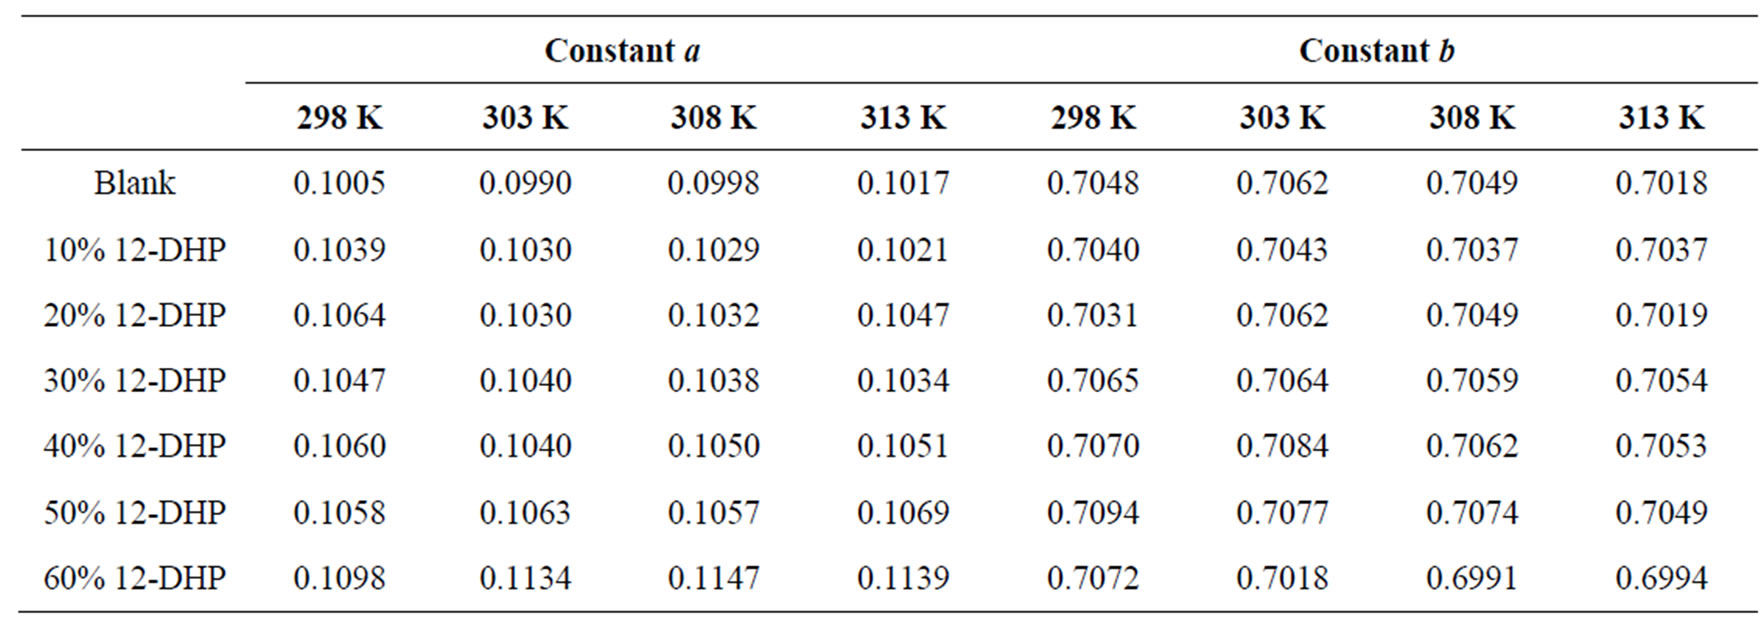
Table 7. Dimensionless correlation constants a and b under experimental conditions.
the presence of surfactants.
Overall, the data in this investigation were valid for 90 < Sh < 1098, 737 < Sc < 59284 and 271 < Re < 7046. In addition, the results fit the theme of a forced convection mechanism, which agrees very well with our previous study on the electrorefining of copper [2].
3.3. Morphology and Composition Analyses
The morphology of electrodeposited copper from acidic baths on poly or single crystal copper electrodes with and/or without additives has been widely studied [2,18, 19] and the results in this work were essentially similar. Since the concern was mainly the extraction and production of pure copper, all experiments were proceeded at the limiting current density that was determined for each solution and with time range 10 - 30 minutes, so it is expected that the morphologies of electrodeposited copper must be characterized by 3-D nucleation [20]. Concerning the type of solution with and/or without 12-DHP at different deposition time-periods, no unusual behaviour has occurred and the rate of copper electrodeposition increases by increasing time and reflects the same trend of the limiting current density. As for the influence of different amounts of 12-DHP, copper was deposited in very smooth and compact form up to 30% (v/v) 12-DHP as shown in Figure 8(a). The deposited copper from solutions of 40% - 60% (v/v) 12-DHP was rough and discontinuous as shown in Figure 8(b), which gives an idea about the behaviour of 12-DHP with its composition. Also, this compositional effect of 12-DHP confines with and proves the hypothesis of the departure percent, S. Regarding the temperature effect, and as stated that temperature is an important factor in the electrodeposition of metals [20]. The main features of the surface do not change with changing the temperature, only the deposit roughness as well as the crystallite size increases with increasing temperature.
High current densities or high cathodic overpotentials, accompanied by fast stirring rates can adversely affect electrodeposition process resulting in brittle deposits, which can comprise occlusions of additives and foreign materials [21]. Although, it was stated [22] that an increase of copper ion concentration or agitation increases the size of the particles and obscured their dendritic character, it was found dramatic changes occurred when rotation started, dendrite nodules were formed with high degree of discontinuity as well as very rough deposits as in case of 10% (v/v) 12-DHP solution at 200 rpm, Figure 9(a). The phenomenon of dendritic growth [23] may occur if the rate of the electrodeposition process is partially diffusion controlled, so, on a microrough surface,
 (a)
(a) (b)
(b)
Figure 8. SEM micrographs of electrodeposited copper powder after 20 minutes at 298 K and zero rpm from (a) 30% (v/v) 12-DHP, (b) 40 - 60% (v/v) 12-DHP.
the rate of deposition at surface peaks will be greater than that at troughs. These surface non-uniformities therefore become more pronounced resulting, eventually, in the formation of macrorough deposits. The phenomenon of dendritic growth may also be related to differences in the rate of diffusion at different points on a surface. In the case of macrospiral growth, for instance, spherical diffusion to the tip of the spiral results in a higher rate of mass transport to this point and this may lead to dendritic growth. Contrarily to Figure 9(a) at 200 rpm, grape-like aggregates were formed with low degree of discontinuity at 1000 rpm in case of 10% (v/v) 12-DHP solution, Figure 9(b).
Figure 10 gives the EDS analysis for some chosen specimens that represent most of the experimental conditions, which have been studied. The analysis indicated that the composition of the electrodeposited copper powder under different conditions for all blank solutions was mainly pure copper (94.56 at. %) and oxygen (5.44 at. %), while it was around 99 at. % copper and less than 1 at. % oxygen for all 12-DHP solutions. Tiny percent