A study of the interaction of drugs with liposomes with isothermal titration calorimetry ()
1. INTRODUCTION
Because drug targets usually exist inside the cell, the drugs must cross various cellular barriers by passive and/or transporter-mediated transfer to elicit their pharmacological and therapeutic effects. Transport pathways across the intestinal mucosa are, for example, passive diffusion via a paracellular route, passive diffusion via a transcellular route and a protein-mediated pathway via influx and efflux transporters. Although recently many drugs were proven to be transferred via a variety of transporters [1-3], many drugs are permeated by passive diffusion. The properties of drugs that affect the passive permeation of drugs through biological membranes are lipophilicity, charge, size and hydrogen bonding ability, and the most important property among these may be lipophilicity [4]. Chemicals with low lipophilicity cannot permeate at adequate rates and are thus not suitable for drugs. However, if the drug is too lipophilic, it will remain trapped within the membrane. Thus, a drug with high bioavailability must have optimal lipophilicity. Then, the estimation of the lipophilicities of the drug candidates is performed in the pharmaceutical development of drugs [5]. The most typical method is partition experiments of n-octanol/water. In addition to the partition of n-octanol/water, partition coefficients using other water-immiscible organic solvents such as alkanes, chloroform and dibutyl ether are used, which assay the properties of amphiprotic, hydrogen-bond donor and hydrogen-bond acceptor [6]. The permeability experiment with Caco-2 cells was used as an in vitro absorption parameter [7]. Unfortunately, cultures of cells and assays for the transferred amounts of drugs are often laborious. Liposomes have been used as model membranes to mimic biological membranes, and the interaction of drugs with liposomes has been studied as an estimation of the permeability of cell membranes [8].
Various methods for the measurement of the liposome/water partition have been developed including ultrafiltration [9], equilibrium dialysis [10], a pH-metric method [5,11], NMR spectroscopy [12], immobilized liposome chromatography [13,14], differential scanning calorimetry [15], electrokinetic chromatography [16] and isothermal titration calorimetry (ITC) [17-20]. In the ITC method, small amounts of one substance are injected into a solution of the other substance. At every injection, the heat flow is recorded. For the usual titration, the heat flow near the end-point is not observed due to the saturation of the binding if the dilution of chemicals does not elicit the heat flow. The binding parameters can be calculated from these data. ITC is an effective method for the study of the interaction of substances, and this method is superior to the other methods because the thermodynamic quantities for the binding in problems such as the Gibbs energy change ΔG from the binding constant, the enthalpy change ΔH and the entropy change ΔS can be estimated [21]. These quantities are used to quantify the energetics of the binding. Therefore, ITC has been applied to the investigation of the interaction between chemicals and liposomes by many investigators [19-20,22-25].
In this paper, we also employed ITC to study the binding of various drugs to liposomes. Two different types of experiments are possible regarding the relative roles of the drugs and the liposome: One type is when aliquots of a drug solution are injected into a liposome suspension (type-A titration), and the other is the opposite in which aliquots of a liposome suspension are injected into a drug solution (type-B titration). In type-A titration, the ratio of the number of bound drugs to the number of lipid molecules becomes large especially near the final stage of titration, which may disturb the liposome structure or change the electrical interaction. If we stop the titration at an early stage to avoid the disturbance and the added chemicals all bind to the liposome, we may estimate ΔH but not the dissociation constant due to the lack of information about the binding saturation. Then, we employed type-B titration in which near the final stage of titration, a relatively small number of drug molecules are adsorbed onto a relatively large number of liposomes so that the membrane disturbance is minimal. We derived an equation in which the accumulated heat flow is expressed in terms of the concentration of injected lipid. The observed data were well fitted by this equation to estimate the binding parameters. According to our equation, n, the number of binding sites per lipid molecule, can be estimated, and using this parameter, the partition coefficients of 15 drugs were calculated from the respective dissociation constants. Some drugs showed enthalpy-driven binding instead of the classical hydrophobic interaction in which the entropy change is a major driving force. We proved an approximate rule that for drugs with smaller n (binding involving larger lipid molecules), the entropy changes contribute more than the enthalpy changes. The value of n may be useful for future molecular consideration of the binding.
2. MATERIALS AND METHODS
2.1. Reagents
L-α-lecithin (egg yolk phosphatidylcholine, abbreviated as PC hereafter) was obtained from Avanti Polar Lipids (Birmingham, AL). Tetraphenylborate (TPB) was purchased from Dojindo Laboratory (Kumamoto, Japan), and other chemicals of the highest purity available were from Wako Pure Chemicals (Osaka, Japan). All chemicals were used without further purification.
2.2. Preparation of Liposomes
The liposomes of PC were prepared using the standard extrusion method: Lipids were dissolved in a round flask with chloroform, and the solvent was evaporated by a rotary evaporator under nitrogen to form the thin lipid film. To remove the solvent completely, the lipid film was put in a vacuum overnight. A buffer solution was added to the flask so that the lipid concentration became a determined value. The buffer contained 150 mM NaCl, 10 mM HEPES (4-(2- hydroxyethyl)-1-piperazineethan-esulfonic acid) and 0.1 mM EDTA (2-({2-[bis(carbomethyl)amino]ethyl} (carboxymethyl)amino)acetic acid), and the pH was adjusted to 7.5. This buffer solution is called Buffer-H in this paper. The multilamellar vesicles were formed by mechanical vibration at room temperature in an N2 atmosphere. To achieve a certain size distribution, the vesicle suspension was extruded through polycarbonate membranes by N2 gas of 2000 kPa. Extrusion was performed 5 times using a filter of 200 nm pore size, followed by 5 extrusions using a filter of 100 nm pore size. The lipid concentration was determined by phosphorus content [26, 27].
2.3. ITC Experiments
The experiments were performed with an isothermal titration calorimeter (VP-ITC MicroCalorimeter, MicrocalTM, Northampton MA). The temperature was 25˚C except in the van’t Hoff experiment. The cell (1.4 mL) contained the solution of drugs, into which the liposome suspension (typically 41 mM of PC) was injected unless otherwise noted. The drug and liposome were separately dissolved in Buffer-H. Both solutions were degassed using Thermo Vac Sample Degassing (MicrocalTM Inc., Northampton, MA). The combination of the drug concentration in the cell and the volume of aliquots of the injected liposome suspension at each titration were optimized after preliminary experiments and written in text. The drug solution in the cell was stirred at 300 rpm. The period between two successive titrations was typically 240 sec. The heats of dilution were small compared with the binding interaction and corrected. The analysis was performed using an equation derived in this paper, which will be described below. The fitting calculation was performed with Origin software (MicrocalTM Inc., Northampton, MA).
3. RESULTS AND DISCUSSION
3.1. ITC Experiments Where a Drug in the Cell Is Injected with a Concentrated Liposome Suspension (Type-B Titration)
As described in the Introduction, there are two possible positions of the liposome suspension and drug solution, which are called type-A and type-B titration. Ikonen et al. [18] compared the thermodynamic binding parameters estimated from these two methods and described the significant differences between the values of the two methods. For example, for the binding of labetalol, a ΔH value of −36.1 kJ∙mol−1 and ΔS value of −47.7 J∙mol−1∙K−1 were reported when type-A titration was employed, while a ΔH value of −4.6 kJ∙mol−1 and ΔS value of 53.9 J∙mol−1∙K−1 were obtained from type-B titration. The large difference in ΔH and difference in sign of ΔS are noteworthy. Our preliminary results of type-A titration are as follows. When the PC liposome (0.5 mM) was titrated with 10 mM Na-TPB, we obtained Kd = 1.8 µM and ΔH = −1.2 kcal/mol. When the Na-TPB concentration was 20 mM, the estimated values were different, Kd = 5.5 µM and ΔH = −2.0 kcal/mol. For type-B titration, we obtained Kd = 2.1 - 2.6 µM and ΔH = −8.9 - −9.9 kcal/mol (see Table 1). Type-A titration may be the usual
Table 1. Kd and ΔH estimated from Eq.6.
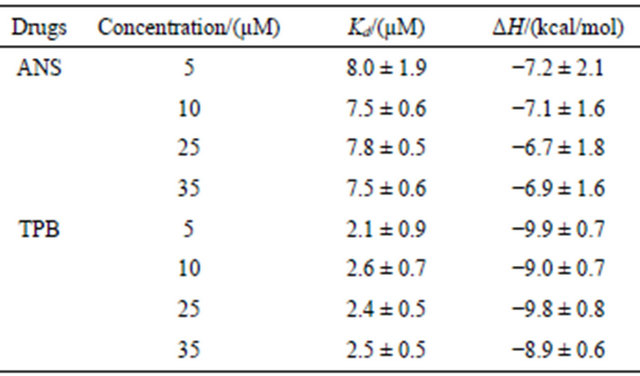
The liposome suspension (41 mM lipid concentration) was injected into ANS or TPB solutions in the cell whose concentrations were varied as shown in the table. The injected volume of each titration was 3 mL for TPB and 8 mL for ANS, and the titration continued until no heat was produced (except the dilution heat). The buffer solution was Buffer-H (pH 7.5). The temperature was 25˚C. The listed values were averaged and deviated for 5 independent experiments.
method, but this method has a drawback. Near the endpoint of titration, the maximum binding of drugs to liposomes is attained. Near this point, many drug molecules bind to the liposomal membrane so that the membrane is disturbed from the natural state. However, for type-B titration, more liposome vesicles are present in comparison with the drug molecules (except for the initial stage) so that the membrane is not disturbed. Therefore, we employed type-B titration here. This method has been used by previous authors [17-19].
Figure 1 shows the ITC data chart of heat flow when 35 µM of ANS (1-anilino-8-naphtarenesulfonate) was titrated with the concentrated PC liposomes (41 mM of lipid) with aliquots of 8 µL injected at each titration. The buffer solution was Buffer-H. The first aliquot addition of the liposome suspension yields a large heat flow (exothermic), and for every injection, the heat flow gradually decreases. Finally, no heat flow is observed, implying that all ANS molecules in the cell are bound to liposomes. Heat flows are accumulated or integrated from the initial to last injection where the heat flow becomes marginal (most likely due to the very small mixing heat). This accumulated value should be equal to the heat associated with the binding of all the drugs in the cell to liposomes provided that the number of liposomes is larger than the number of drug molecules. Because the total number of moles of the drug is known, the molar enthalpy change of binding, ΔH, can be calculated.
This estimation of ΔH was applied to the binding of TPB and ANS. The PC liposome (41 mM of lipid) was injected with 3 µL of each titration. We set the TPB con-
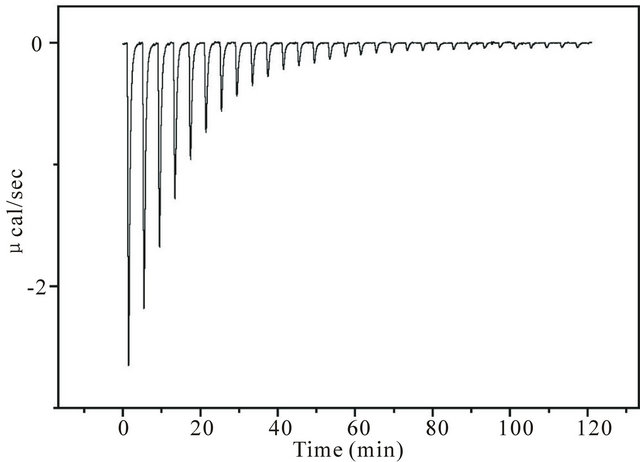
Figure 1. An example of an ITC data chart. The ordinate represents the heat flow (units of µcal/sec) at each titration, and the abscissa is time. The downward deflection represents the exothermic reaction. The cell contained ANS solution (35 µM), into which aliquots of 8 µL of PC liposome (41 mM of lipid) were injected. The buffer solution was Buffer-H whose composition can be found in the Materials and Methods section. Near the end points, heat flow does not occur, suggesting that almost all ANS molecules bind and no dilution heat is produced.
centrations in the cell to 10, 25 and 35 µM to ascertain the independence of the drug concentration in the cell. The estimated values were 9.4 kcal/mol for 10 µM, 9.3 kcal/mol for 25 µM and 9.0 kcal/mol for 35 µM, which reveals that the constant is independent of the drug concentration. Similar experiments were performed for ANS, and the values were 7.8, 7.5 and 7.6 kcal/mol, respecttively, for 10, 25 and 35 µM in the cell. Although the estimated ΔH values seem constant, the “true” values might be slightly different from the estimated values. Because of the presence of free drug molecules in excess of liposomes, the “true” value might be larger than the estimated value.
3.2. Analysis of ITC Data to Obtain the Binding Parameters
The heat flows at every titration were accumulated or integrated from the first injection, and the accumulated values (ΔQ) were plotted against the concentration of the titrant (lipid) in the cell, CL. One typical result is shown in Figure 2, where the liposome solutions (41 mM) were injected into the cell containing 25 µM of TPB or ANS. The volume at each injection was 3 µL for TPB and 8 µL for ANS. As described, an initial large change in ΔQ is observed followed by gradual small changes at every titration, and finally ΔQ plateaus. We will derive the equation of ΔQ as a function of the injected lipid concentration.

Figure 2. A ΔQ vs. CL plot to estimate binding parameters. ΔQ (accumulated heat) is defined as the integration of the heat flow shown in Figure 1 from the first to the i-th titration. The abscissa is the total lipid concentration in the cell at the i-th titration, CL. Both the TBP and ANS concentrations in the cell were 25 µM. For ANS, an aliquot of 8 µL of liposome suspension (41 mM of lipid) was injected, while for TPB, 3 µL of liposome suspension of the same concentration was injected at each titration. The buffer was Buffer-H, and the temperature was 25˚C. The solid curves are the fitting of Eq.6.
We assume the following equilibrium equation holds:
 (1)
(1)
In this equation,  = the dissociation constant,
  = the concentration of unbound sites on the liposome,
  = the concentration of free chemicals in the aqueous solution, and
  = the concentration of bound chemicals. Although there may be various binding sites on the liposomal membrane with different dissociation constants, we assume that there is only one type of binding site. Then, the
  value in Eq.1 may be an averaged value of the various binding sites.
  denotes the total lipid concentration that has been injected in the cell, and
  is the number of binding sites per lipid molecule. The mass balance equation of the binding sites is:
 (2)
(2)
Elimination of  from Eqs.1 and 2 and rearrangement yield:
 (3)
(3)
The total concentration of the chemicals in the cell,  , is represented by:
 (4)
(4)
The accumulated heat flow, ΔQ, should be represented by:
 (5)
(5)
Here,  represents the cell volume (1.4 mL).
From Eqs. 3-5, we obtained:
 (6)
(6)
In this equation,  is expressed as a function of
 . By a non-linear least square method, we can estimate the values of
 ,
,  and n. Note that
  is given. As described below, the value of n, the number of binding sites per lipid molecule, is essential for the estimation of the partition coefficient (see Eq.9). The comparison of Eq.6 with the experimental data is shown in Figure 2. Estimated values are listed in Table 1, and they are almost constant and independent of the concentrations of ANS and TPB. However, the ΔH values of ANS in Table 1 are smaller than those estimated by the total accumulation of heat flow divided by the numbers of ANS molecules. As described above, the presence of free drugs at the end point of titration may cause the opposite estimation. The reason is not clear. However, the value of TPB is almost the same. This result might occur because of the high binding affinity of TPB. In spite of the discrepancy in ΔH observed in the ANS binding, we consider the obtained ΔH values to be consistent, and we will employ type-B titration and analysis with Eq.6.
3.3. Estimation of ΔH Using the van’t Hoff Equation
When the temperature was changed from 10˚C to 40˚C, ANS of 35 µM was titrated with 8 µL of 41 mM PC liposome, and  and ΔH were estimated at various temperatures. The results are shown in panel A of Figure 3. The value of ΔH is almost constant (~6.9 kcal/mol), independent of the temperature. The
  values increase with an increase of temperature (binding affinity becomes weak), as is consistent with the negative
 . Panel B shows the van’t Hoff plot where K in the ordinate is defined as
 , binding constant. From the slope of this plot, we calculate a ΔH value of −6.9 kcal/mol that is equal to the value in panel A.
 (a)
(a)
Figure 3. The temperature dependence of Kd and ΔH of the ANS binding to liposomes (panel A) and the van’t Hoff plot (panel B). In Panel A, the values of Kd and ΔH estimated from Eq.6 are plotted against the temperature. Panel B shows the van’t Hoff plot. The value of ΔH from the slope of the van’t Hoff plot is the same as those in Panel A. The concentration of ANS solution was 35 µM, into which aliquots of 8 µL of 41 mM liposome solution were injected at each titration. The buffer was Buffer-H, and the temperature was 25˚C.
3.4. Estimation of the Partition Coefficient of the Drugs/Liposome
For the discussion of the interaction of drugs with the liposomal membrane, partition coefficients are frequently used instead of Kd. Therefore, we consider the evaluation of  the partition coefficient of the drug/liposome, from
 . Because
  is the concentration of the bound drug in the cell (the volume of which is
  (1.4 mL)), the total amount of the bound drugis
 , and the concentration within the liposomal membrane is repressented by
 , where
  represents the lipid volume in the cell and equals
  Here a is the lipid volume per mole of lipid, and 0.755 mL/mmol is reported (27). Therefore, the partition coefficient
  should be represented by:
 (7)
(7)
Because the partition coefficient is considered at the concentration range where the binding is proportional to the concentration, i.e., where the approximation  holds, Eq.3 can be approximated to:
 (8)
(8)
Inserting Eq.8 into Eq.7, we obtain the following simple equation:
 (9)
(9)
Note that  is dimensionless, and thus, the partition coefficient derived is also dimensionless. Eq.9 contains n, the number of binding sites per lipid molecule.Then,
  is not proportional to
 , the binding constant. For example, as shown below in Table 2, the logPm values of chloropromazine and miconazole are the same (4.74), but the
  values are different (3.80 and 5.26, respectively). For nortriptyline and nifedipine, the logPm values are similar (4.35 and 4.38), but the Kd values are different and twice as large as one another (2.36 and 5.55 µM).
The partition coefficients were determined for various drugs, and the results are listed in Table 2. The chemical structures of these drugs are shown in the Appendix. In addition to these drugs, we tested the following 15 drugs, but the heat flows were so small that we failed to estimate the Pm values. These drugs were lidocaine, tetracaine, furosemide, naproxen, ibuprofen, ketoprofen, tolmetin, fenbufen, brompheniramine, salicylic acid, acetylsalicylic acid, sulindac, warfarin, probenecid and carbam
Table 2. Partition coefficients of various drugs estimated by the present ITC method.
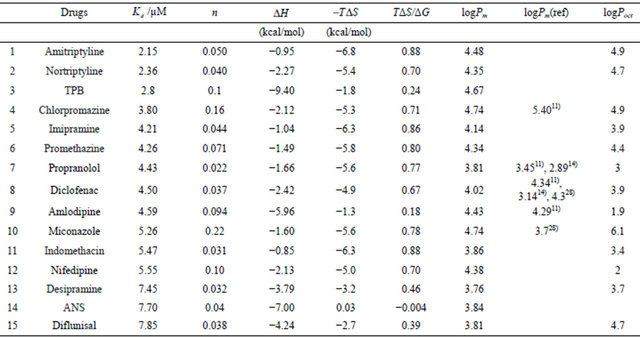
The drug concentrations in the cell were 30 µM except for TPB and ANS. Each injection volume was 5 µL of 41 mM lipid suspension. The buffer was Buffer-H (pH 7.5), and the temperature was 25˚C. For TPB and ANS, the averaged values of Table 1 are used. The values of logP(ref) denote the partition coefficients for liposomes from the references, and the logP values (octanol/water partition coefficients) were taken from the database (29).
azepine. The ITC method has a shortcoming in that it is not applicable to chemicals with small enthalpy changes of binding.
In this table, Pm(ref) represents the values taken from the references in which the partition coefficients to liposomal membranes were experimentally determined, while the logPoct values (the partition coefficients of octanal/water) are obtained from experimental values written in the DrugBank web site [28]. The partition coefficients of liposomes are affected by the liposome type [9, 30], lipid composition (especially the head polar group) [12,29], fluidity of the hydrocarbon chain core [30], ionic strength of the solution, pH and others. In spite of these factors, the partition coefficients of  and logPm(ref) are almost similar. In addition, except for propanol, amlodipine, miconazole, nifedipine and diflunisal, the logPoct values are nearly equal to the logPm values. However, Balon et al. [31] reported a poor correlation between
  and logPoct. For amlodipine, the values of
  and logPm(ref) are almost equal, while Poct is much smaller than these values by 2.2 - 2.4 log units. Although no value of logPm(ref) was reported, the same result may be true for nifedipine. Thus, these drugs may have attracttive interactions with lipid molecules through hydrogen bonding, the electric interaction, and/or the interaction with water molecules. However, for miconazole, logPoct is larger than
  by ~1.4 or 0.9 log units. Miconazole has the largest value of n, implying that the drug may interact with a small number of lipid molecules (because 1/n represents the number of lipid molecules that interacted with one molecule of the drug or the number of lipid molecules involved in the process of binding). The chemical structure is referred to in the Appendix. One possibility is that the ring (s) of miconazole might penetrate the lipid molecules, which would lead to a smaller partition coefficient of the liposome. Thus, we might say that the n values are useful for the consideration of molecular interaction between drugs and lipid membranes. Further study is necessary.
3.5. Thermodynamic Parameters of Drug Binding to Liposome
The thermodynamic quantities of the binding, such as the Gibbs energy change, and the entropy change, were calculated by the thermodynamic equations.
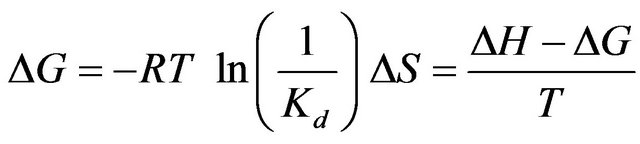 (5)
(5)
The data listed in Table 1 list −0.43 - 0.35 and −2.1 - −1.2 kcal∙mol−1 for TΔS of ANS and TPB, respectively. The values of TΔS are very small or even negative. These are hydrophobic anions, and generally, the binding of lipophilic compounds to liposomes is governed mainly by the entropy-change (the so-called hydrophobic interaction). In contrast, the driving force of these two is instead the enthalpy change. The seventh column of Table 2 shows TΔS/ΔG, and many drugs have values of 70% - 90%, implying that the entropy change is a major factor in the free energy change. As described above, we failed to estimate the binding parameters for 15 drugs because no heat flows were observed. The binding of these drugs is, of course, caused by the entropy change. However, for TPB (#3), amlodipine (#9), desipramine (#13), ANS (#14) and difllunisal (#15), the values of TΔS/ΔG are small (Table 2), implying the enthalpy is a major driving force. ANS (#14) has a negative ΔS, meaning that the binding is enthalpy-driven. Seelig and colleagues [17] named the enthalpy-driven binding of a hydrophobic substance as a “non-classical hydrophobic effect”. What factors determine the enthalpyor entropy-driven binding? This important question must be clarified in the future. Figure 4 shows the plot of –TΔS/ΔH vs. n. The drugs whose ordinate values are less than unity have small values in comparison with the values. As in Table 2 and this figure, TPB (#3), amlodipine (#9), desipramine (#13), ANS (#14) and diflunisal (#15) show small entropy changes in comparison with the enthalpy changes. The numbers attached to the data points in Figure 4 represent the drug numbers in Table 2. Because the order of drugs in this table is that of Kd, this figure indicates no correlation of –TΔS/ΔH with Kd. Interestingly, except for #4 and #10, the ordinate values decrease as n increases and seem to plateau. The drugs that require the interaction with large numbers of lipid molecules (large values of 1/n) show larger ratios of entropy to enthalpy changes. Note that n is the number of binding sites per lipid molecule, and 1/n is the number of lipid molecules involved in the binding. Further study is needed to check whether this relationship holds for a variety of drugs. We observed that the driving force for TPB and amlodipine toward dipalmitoyl phosphatidylcholine (DPPC) liposomes is entropy-driven for low temperature at 10˚C (gel phase of DPPC) while the driving force is enthalpy-driven at 50˚C (fluid phase of DPPC) in fluid phase. Thus, we propose that the binding affecting a large number of lipid molecules (large value of 1/n or gel phase of lipid) is entropydriven.
As shown in the Appendix, desipramine and nortrip-

Figure 4. Plot of –TΔS/ΔH vs. n for various drugs listed in Table 2. The numbers attached to the data points represent the drugs in Table 2.
tyline are demethylated derivatives of imipramine and amitriptyline, respectively. For these two combinations, the demethylated compounds with the larger Kd values have larger ΔH absolute values, smaller TΔS absolute values and smaller n. Interestingly, only one replacement of CH3 with H influences the thermodynamic quantities. Amlodipine and nifedipine are homologs. As shown in Table 2 and Figure 4, for the binding of amlodipine (#9), the contribution of entropy is much smaller than that of nifedipine (#12), which might be caused by the aminogroup of amlodipine.
4. CONCLUSION
In this paper, we applied ITC to investigate the interaction between liposomes and drugs, and the liposome suspension was injected into the drug solution (type-B titration). In this method, the liposomes were present in excess amounts of the drug except in the early stage. Then, the disturbance of liposomes may be small. Data were analyzed with Eq.6, and this method gave the ordinary binding parameters such as Kd(ΔG) and ΔH, in addition to n, the number of binding sites per lipid molecule. The partition coefficients were calculated using n and agreed well with those reported values of liposomes or the octanol/water partition coefficients, except for some drugs (amlodipine, nifedipine, miconazole and diflunisal). For many drugs, the binding is entropydriven according to the hydrophobic interaction, but for some (TPB, ANS, amlodipine, desipramine and diflunisal), the enthalpy is the major driving force (non-classical hydrophobic interaction [17]). The nature of the non-classical hydrophobic interaction is a further problem to be investigated. For the binding of chemicals with small n (in which a large number of lipids is involved), the contribution of the entropy change is larger, although this rule was only approximately true. We were able to estimate the partition coefficients with n.
5. ABBREVIATIONS
ITC, isothermal titration calorimetry; Kd; dissociation constant; n, the number of binding sites per lipid molecule; Pm, partition coefficient of drug/liposome; ANS, 1-anilino-8-naphtarensulfonate; TPB, tetraphenylborate; type-B titration; aliquots of a liposome suspension are injected into a drug solution; PC, egg yolk phosphatidylcholine; Buffer-H, a buffer solution containing 150 mM NaCl, 10 mM HEPES (pH 7.5) and 0.1 mM EDTA; CL, lipid concentration in the cell during a titration; Ct total drug concentration (bound and free) in the cell; Poct, partition coefficient of octanol/water.
APPENDIX
Chemical structures used in this experiment.
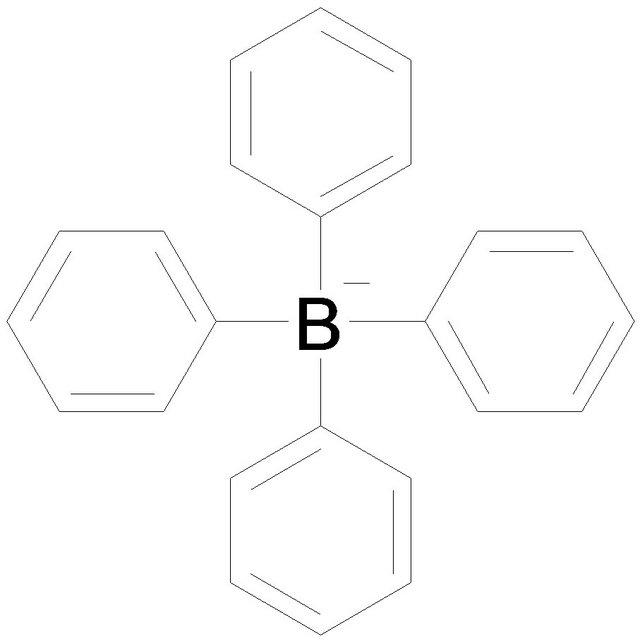
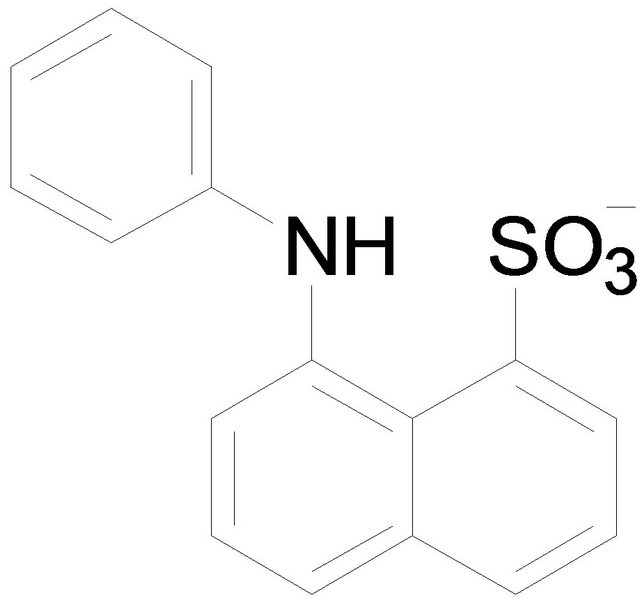
Tetraphenylborate (TPB) 1-Anilino-8-naphtarenesulfonate (ANS)

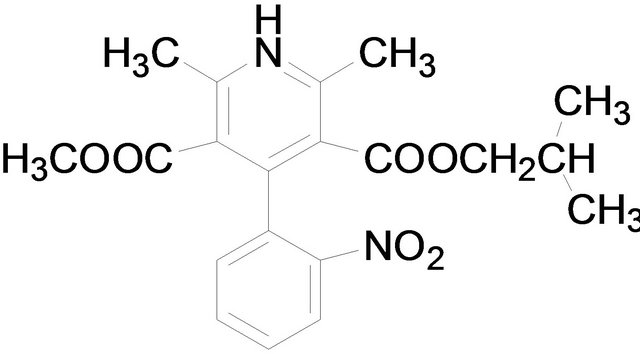
Amlodipine Nifedipine

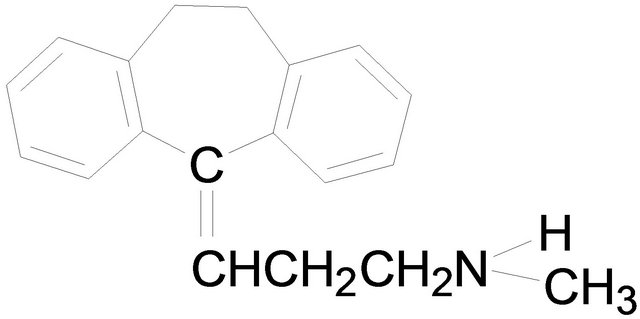
Amitriptyline Nortriptyline

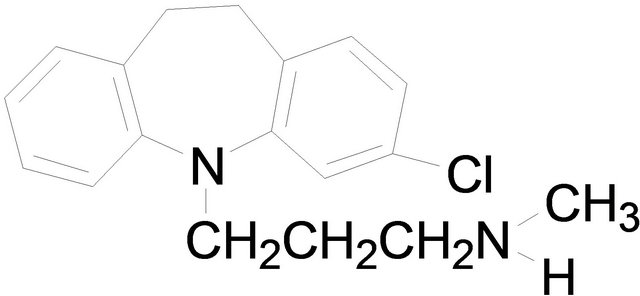
Imipramine Desipramine


Propranolol Chlorpromazine


Promethazine Indomethacin


Diclofenac sodium Diflunisal
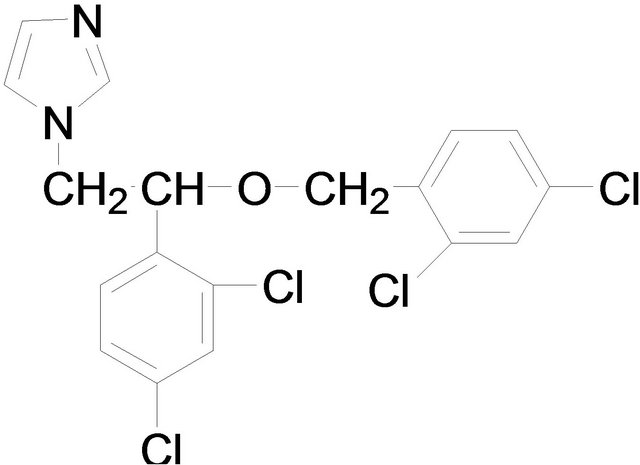
Miconazole