Quantum dots induce hot-start effects for Taq-based polymerase chain reaction ()
1. INTRODUCTION
Polymerase chain reaction (PCR), a powerful DNA amplification technique, has been widely used in biological and medical sciences for many years. However, PCR technology has not reached its summit because it is still frequently impaired by low specificity and sensitivity arising from the non-specific amplification products, such as primer dimers and mispriming products.
Hot start PCR (HS PCR) is one important technique to prevent those unwanted non-specific PCR products. Commonly, there are three methods existing for performing hot start reactions. The first one is to withdraw one key component (e.g., dNTP or DNA polymerase) and introduce it once the desired temperature is reached through the manual addition or a temporary barrier [1-4]. The second approach is inactivation of the DNA polymerase by temporary chemical modifications, or through the use of antibodies or oligonucleotide aptamers bound to the polymerase [5-8]. The third approach achieves HS effects by the modifications of the primers or dNTP [9-11].
Nanoparticles, such as gold nanoparticles [12,13], carbon nanotubes [14-16] and carbon nanopowder [17] were found to improve the general performance of polymerase chain reactions under many circumstances. More importantly, it was discovered recently that Au could modulate the activity of Pfu DNA polymerase and be used in Hot-start PCR [18]. Quantum dots (QDs), as a new kind of fluorescent nanomaterials, have attracted more and more attention in recent years due to their excellent chemical and physical features [19,20]. Recently, QDs have been used as additives to improve PCR yield and specificity [21-23]. All these reports highlighted a fact that nanoparticles including quantum dots have a potential to modulate some of the key molecular biology techniques. In the results of this study, CdTe QDs apparently improved the general PCR efficiency in the form of hot-start performance.
2. MATERIALS AND METHODS
2.1. Materials
SpeedSTAR HS polymerase was purchased from TaKaRa (Japan). Taq DNA polymerases were purchased from Sangon (Shanghai, China). Human genomic DNA was isolated from human whole blood by spin column whole blood genomic DNA minipreps kit (Sangon). Primers were synthesized from Sunbiotech company, and their sequences are shown in the Table 1. All other reagents, including molecular weight markers DL2000 (2000, 1000, 750, 500, 250, and 100 base pair) and λDNA/HindIII (23,130, 9416, 6557, 4361, 2322 and 2027 base pair), were purchased from Sangon.
2.2. Preparation and Characterization of CdTe QDs
Quantum dots (stock solution 1 μM) were provided by Prof Jicun Ren’s lab at Shanghai Jiao Tong University. Briefly, water-soluble CdTe QDs were prepared using the reaction between Cd2+ and NaHTe solution in the presence of mercaptopropionic acid (MPA) as a stabilizer [24-27]. QDs were finally dissolved in water. So ddH2O was used as the negative control in all experiments. Emission spectra were recorded using a Varian Cary spectrometer, and absorption spectra were obtained by a Lambda 20 UV-visible spectrophotometer (PerkinElmer). CdTe QDs with an emission wavelength of 698 nm were used in this study.
2.3. PCR Amplifications
PCR amplifications were set up in a final volume of 12 ml using NPK02 PCR kit (GREDBIO). Each reaction contained 0.25 μM each primer, 200 mM each dNTP and 0.4 ng/ml template DNA. The concentration 0.33 mM (optimized concentration for most amplifications, Figure 1) of CdTe QDs was used in most cases. HS DNA polymerase (1 U) or Taq (1 U) were used in the 12 ml PCR (Table 2). All PCR reactions were performed on a TGradient Thermal device (Takara) with programs as listed in Table 3. The PCR products were separated in 1.2% agarose gel with ethidium bromide and visualized using WD-9413C electrophoresis image analysis system (Liuyi, Beijing). Furthermore, QDs-facilitated PCR products were analyzed by Sanger sequencing after purification in order to determine the amplification fidelity.

Table 1. Primers used in this study.

Figure 1. The hot-start effects of QDs at different concentrations. The PCR target was 941 bp with primer B13-14. PCR products were analyzed by agarose gel electrophoresis (1.2%). Lane M: MW DL2000. The arrow indicated the target amplicon positions (as in all following figures).
3. RESULTS
3.1. The Effects of Quantum Dot Concentration on Hot Start Features
The concentration of the additives is very important for obtaining optimal PCR results. Here, we firstly examined the feasibilities of using different concentration of QDs to enhance the hot start effects. Several concentrations of QDs (0 - 0.83 mM) were pre-incubated with PCR mixtures at 50˚C for an hour. As shown in Figure 1, lane 1 (without QDs added) showed a high level of undesired amplification products forming smearing band and no target band attained. In contrast, the addition of 83 nM to 0.33 mM QDs apparently resulted in the specific amplifications of the target product. It was obvious that an increase in the concentration of QDs enhanced the specificity and yield of the PCR, with maximal augmentation at 0.33 mM. However, when QDs concentration was high to 0.5 mM, no PCR products were attained, which suggested that hot start PCR was inhibited obviously when excessive QDs were added. Therefore, 0.33 mM QDs was chosen as the optimal concentration for the rest experiments.
3.2. HS PCR with QDs-Engineered Taq
Native Taq DNA polymerase was widely used in the conventional PCR due to its low price and decent performance. However, it doesn’t possess hot-start character by itself. Many expensive commercially available hotstart DNA polymerases are recombinant versions of Taq polymerase. So it is still greatly valuable to test if a PCR additive could facilitate Taq polymerase with hot-start features.
In the first experiment, three different primer pairs with the length of 1000 bp target from human genomic DNA were randomly chosen. Taq was incubated with QDs at the optimal concentration (0.33 mM) for 1hr at different temperatures (30˚C - 56˚C) before PCR amplification. Interestingly, quantum dot engineered Taq exhibited apparent hot start features. As shown in Figure 2,PCR amplification using Taq led to forming high level of undesired amplification products as displayed by smearing bands in electrophoresis, and no target bands were obtained. In contrast, the addition of 0.33 mM QDs apparently resulted in much more specific amplifications of the target products, though primer dimers were largely preserved. Although the yields with the QDs were relatively lower than those of the HS Polymerase sometimes, these primary results suggested that Taq DNA polymerase activity could be partially blocked by QDs at prestages of PCR.
In order to further validate the hot start features of QDs, we firstly incubated Taq with QDs at 30˚C for various time (0 to 3 hr). As shown in Figure 3, when Taq was added to the PCR system immediately before amplification, a fairly specific target band was usually obtained. However, with the pre-incubation time extended at 30˚C, the brightness of the target bands became weaker and the nonspecific band accumulated. There were no specific target bands obtained after 2 hr preincubation step at 30˚C. Surprisingly, the presence of QDs completely eliminated strong smearing bands, and much specific target bands were attained. And even with 3 hr preamplification incubation at 30˚C, much cleaner specific bands were still obtained. This long-term suppression effect of QDs is very important for PCR consistency, especially in high-throughput PCRs where the long time was often needed due to the reagent mixing and dispensing steps. In most figures of this study, primer dimers heavily existed, but this didn’t compromise the apparent hot-start effects brought by QDs or HS DNA polymerase.
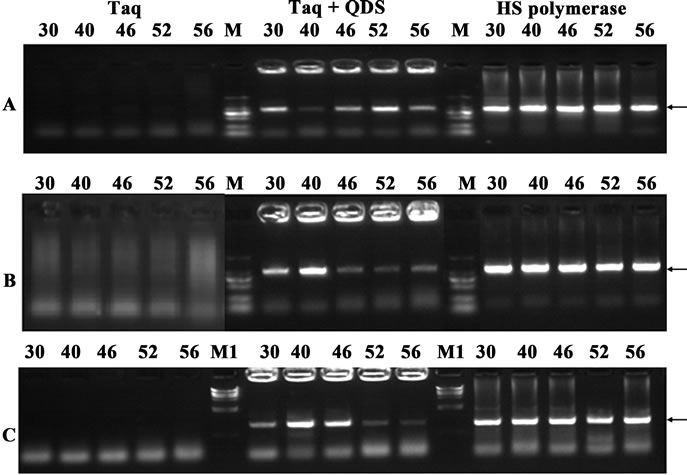
Figure 2. Hot start effects of the QDs after incubation for an hour at different temperatures (30˚C - 56˚C). A: primer B9-10; B: primer B13-14; c: primer B17-18. PCR products were analyzed by agarose gel electrophoresis (1.2%). Lane M: MW DL2000. Lane M1: MW λDNA/HindIII.
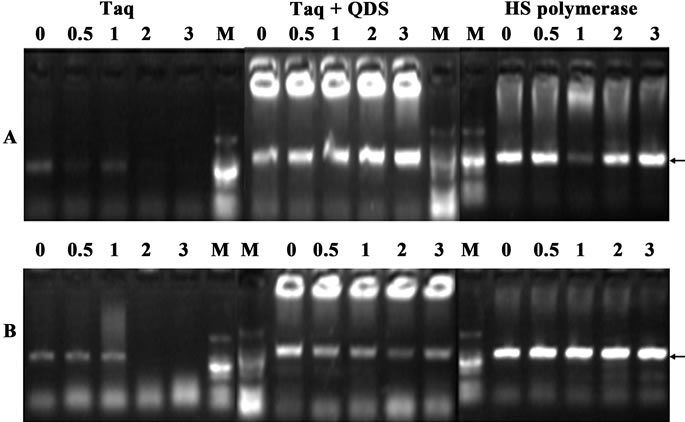
Figure 3. Confirmation of hot start effects of QDs after incubation for different time (0 - 3 hr) at 30˚C. A: primer A99-100; B: primer B17-18. PCR products were analyzed by agarose gel electrophoresis (1.2%). Lane M: MW DL2000.
Secondly, we further incubated Taq with QDs for different time (0 to 1 hr) at 50˚C. As shown in Figure 4, when Taq was added to the PCR system immediately before amplification, faint target bands or no target bands were obtained. More importantly, nonspecific smearing bands increased along with the elevation of the pre-amplification incubation time. However, the specific target bands were attained when QDs were added immediately before amplification, which further confirmed the reports that quantum dots (QDs) dramatically improved the yield and specificity of PCR [23,24]. More significantly, the presence of QDs completely eliminated strong smearing bands, and the specific target bands were still obtained even with the 1-hr pre-incubation time at 50˚C. Therefore, all above data demonstrated that the nonspecific amplifications were suppressed during the temperature ramps of the PCR process and further authenticated the hot start capacity of quantum dot engineered Taq.
3.3. HS Effect of QDs Engineered Taq Using Different DNA Lengths
Non-specific amplification artifacts, such as mis-priming products or primer dimers are common problems in quantitative real time PCR with fluorescent dyes, because they elevate the background signals and interfere with quantification of the results. Therefore, another two primer pairs with the length of 280 bp target from human genomic DNA were randomly chosen. Taq was still incubated with QDs at different temperatures for 1 hr. As shown in Figure 5, similar HS effects were observed using QDs engineered Taq. These data further illustrated that HS PCR with QDs engineered Taq would become a powerful tool in quantitative real time PCR with fluorescent dyes.
3.4. Mechanism
In order to elucidate the mechanism for the HS effect of QDs on Taq-based amplification, QDs were firstly either mixed with Taq before the pre-amplification incubation step (pre-treatment) or added to the PCR mixtures after the incubation(post-treatment). As shown in Figure 6, the pre-treatment with QDs exhibited a significant suppression effect of non-specific products, and the specific target bands were still obtained even with pre-incubation 1 hr at 50˚C. However, the post-treatment did not lead to obvious improvements of the PCR amplification which were the same as the results with Taq alone. The control results illustrated that QDs could avoid such nonspecific amplification arising from mispriming at low temperatures, whereas post-treatment with QDs were not able to eliminate such amplification. Furthermore, the main reasons probably attributed to the interactions of QDs with some key components of PCR in pre-incubation, such as DNA or Taq DNA polymerase.

Figure 4. Confirmation of hot start effects of QDs after incubation for different time (0 - 60 min) at 50˚C. A: primer B5-6; B: primer B9-10; C: primer B13-14. PCR products were analyzed by agarose gel electrophoresis (1.2%). Lane M: MW DL2000.

Figure 5. Demonstration of hot start effects with the amplicon of 280 bp from human genome after incubation for 1 hr at different temperatures (30˚C - 56˚C). A: primer WHY5; B: primer WHY1. PCR products were analyzed by agarose gel electrophoresis (1.6%). Lane M: MW DL2000.

Figure 6. Comparison of the PCR amplification performance with pre-incubation at 50˚C for different times (0 - 1 hr). Primers A85-86 were used. PCR products were analyzed by agarose gel electrophoresis (1.2%). Lane M: MW DL2000.
It has been reported that increased polymerase concentrations could reverse the effect of gold nanoparticle [13]. Therefore, in order to illustrate the interaction of QDs with some key components in pre-incubation, the effects of PCR components concentrations on PCR with 1 hr pre-incubation at 50˚C were studied. We found that increasing the concentration of template, primers or dNTP did not alter the repressive effects of 0.5 mM QDs (data not shown), but that increasing the concentration of Taq completely reversed the suppression effects of QDs on PCR, as shown in Figure 7. So these data suggested that there was an interaction between QDs and Taq DNA polymerase.
On the other hand, the enhancing effect of gold nanoparticles on PCR could be duplicated simply by reducing polymerase concentration [13]. The adsorption of Taq polymerase by QDs could also lead to a reduction in polymerase concentration. We then designed a control experiment to elucidate whether the observed hot-start effect is primarily due to the reduced polymerase concentration. Various concentration Taq was added to four different PCR: QDs free with 1 hr pre-incubation at 50˚C or not, 0.33 mM QDs added with 1 hr pre-incubation at 50˚C or not. As shown in Figure 8, there were no target bands obtained at 0.1 - 0.6 U Taq for different PCR reactions. Moreover, smearing bands in electrophoresis were shown for control (without QDs added) with 1hr preincubation, whereas the addition of 0.33 mM QDs resulted in much more specific amplifications of the target products. Moreover, there were no significant differences in the results of three PCR (QDs free without pre-incubation, QDs added with pre-incubation or not). Therefore, this control experiment indicated that hot-start effect is not primarily due to the reduced polymerase concentration.
4. CONCLUSION
People have found different types of PCR enhancers, including formamide [28], betaine [29], DMSO [30], gold nanoparticles [12,13], carbon nanotubes [14-16], carbon nanopowder [17], proteins [31-33], ethylene glycol/propanediol [34], dendrimers [35,36], nucleotide analogs [37], and other chemicals [38-40]. In this report, the enhancing effects of CdTe quantum dots in the context of hot-start performance for Taq DNA polymerasebased polymerase chain reaction were demonstrated,

Figure 7. Increased Taq concentration reversed the inhibitory effect of QDs nanoparticles with 1hr pre-incubation at 50˚C on PCR. 0.5 M QDs was added (ref. Figure 1). Primer B13-14 was used. PCR products were analyzed by agarose gel electrophoresis (1.2%). Lane M: MW DL2000.

Figure 8. The effect of Taq concentrations on hot-start PCR. 0.33 μM QDs was added. Primer A99-100 was used. PCR products were analyzed by agarose gel electrophoresis (1.2%). Lane M: MW DL2000.
while several other papers [18,21-23] haven’t touch this specific question. We found the strong inhibition effect of CdTe QDs on the nonspecific amplification, which obviously suppressed unwanted amplification at temperatures between 35˚C and 56˚C. Though QDs didn’t display good effects in eliminating primer dimers as frequently seen in most of the figures, and addition of QDs led to accumulation of DNA products in the gel wells (the reason of which needs further investigation in the future), it didn’t compromise the general hot-start advantage of QDs for target band amplification. The target bands were still attained even with pre-incubation 3 hr at 30˚C or 1 hr at 50˚C, which would make it convenient for daily manual high-throughput amplification set-up in labs. The suppression effect could be reversed by increasing polymerase concentration, indicating that there was an interaction between QDs and Taq. The results also demonstrated that hot-start effect was not primarily due to the reduced polymerase concentration.
5. ACKNOWLEDGEMENTS
This work was funded by NSFC (No.31071170), HITWH-985 project, GREDBIO fund, HIT (hitwh200904), and HIT-NSRIF (2011101). We are grateful for Prof. Ren Jicun’s lab for the quantum dots preparation.

