1. INTRODUCTION
India is home to the largest number of undernourished children. Globally, the status of under-nutrition is improving over time; still, India contributes to the largest number of underweight children in the world. Physical growth and malnutrition situation are the comprehensive reflections of child nutritional status. The main indicator of malnutrition among children is the protein-energy malnutrition and this is usually reflected by the anthropometric measures of relative values of height, weight and age of children. Underweight, wasting and stunting of children can be measured through weight-for-age, weight-for-height and height-for-age respectively. Under weight and wasting are the effects of acute deficiency and stunting is the result of chronic deficiency. Growth during infancy depends on children’s duration of breastfeeding and their birth weight. Data from last five decades prove that exclusive breast-feeding first six months is most effective for normal growth of babies. However, exclusive breastfeeding beyond six months should not be practiced as it causes poor growth among infants. Infants are likely to suffer from various types of morbidity if they are not brought up in a hygienic condition and semisolid food is not introduced from six months onwards. Malnutrition has also been seen to cause morbidity among children in developing countries [1-6].
In India, Universal Immunization Programme (UIP) for six vaccine-preventable diseases (Tuberculosis, Diaptheria, Whooping Cough, Tetanus, Polio and Measles) are launched in 1985 with the objective of reducing morbidity, mortality and disabilities among the children. This programme envisaged immunization to all eligible children by 1990. Immunization was chosen as the most effective way to tackle disease because measles in a healthy child is not very serious but mortality due to measles is 400 times greater in an undernourished population. Similarly, if an adequate drinking water is made available, poliomyelitis will cease to be a problem and it inhibits morbidity.
From many studies, it becomes clear that a number of factors affect the child nutrition either directly or indirectly. These factors are food availability, dietary intake, breast-feeding, prevalence of infectious and parasitic disease, water supply and sanitation, socio-economic status. Several studies also show that repeated episodes of infectious diseases adversely affect children nutritional status [7,8]. Thus, the objectives of the present study are 1) to assess the status of infant health through three dimensions of health namely nutritional, morbidity and immunization and 2) to find the most effective socio-economic factors towards prevention of malnutrition, morbidity and lack of immunization of infants.
2. METHODOLOGY
The data on growth and nutritional status of children was accessed from the third round National Family Health Survey (NFHS-3) of 2005-2006. The survey was coordinated by International Institute for Population Sciences (IIPS) [9] in collaboration with the Ministry of Health and Family Welfare. Children of age 0 - 11 months (i.e., less than one year as it is taken last birth day) are taken for our study. The sample sizes for India is 8225. For assessing the nutritional status, this survey collected data on weight and height of the infants as well as computed “Z” scores through weight for age, height for age and weight for height indices.
Z-score value “−2” was used as a cut-off point for prevalence estimation [10]. Z-score is defined as the deviation of the value observed for an individual from the median of the reference population, divided by the standard deviation (SD) of the reference population i.e.
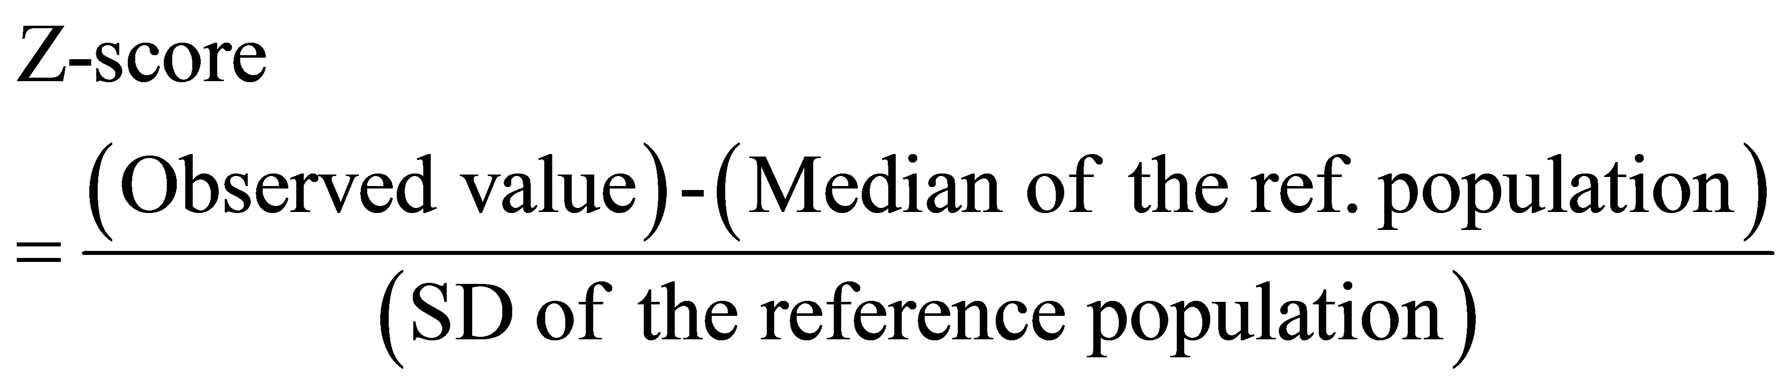
The classifications of Z-score (followed by NCHS/ WHO) are “below normal” (<−2), “normal” (2 to +2) and “above average” (>+2).
The infant is considered as fully vaccinated if the infant has taken one dose for BCG, three doses for DPT and Polio and single dose of measles before one year. Data on immunization status are verified from vaccination cards and in case, where a vaccination card was not available or a vaccination was not recorded on the card, the mother’s recall of vaccination was accepted.
For assessing three morbidity statuses of infants like diarrhea, fever and cough, mother of infant was asked if the children was suffering from the disease during the two weeks preceding the survey by recall method. It should be noted that the morbidity data collected on the basis of mother’s perceptions of illness without validation by medical personnel.
For socio-demographic data, places of residence are taken as “rural” and “urban”. Sex of infants has also been considered. Ethnicity wise four groups have been taken namely Scheduled Castes, Scheduled Tribes, Other Backward Classes and “Others”. Religions are grouped into four categories as Hindus, Muslims, Christians and
“Others”. Mother’s educational status have four categories namely Illiterate (those who can neither read nor write), Primary (literate up to Class IV standard), Secondary (Class V to Class X standard) and Higher (i.e. Higher Secondary, Graduate or Post Graduate, etc.). Wealth index is a measure of the economic status of the household [11]. Though it is an indicator of the level of the wealth in the household, it is consistent with expenditure and income measure. It is based on 33 household assets and housing characteristics like household electrification, type of windows, sources of drinking water, types of toilet facility, flooring, roofing, cooking fuel and house ownership, material of exterior walls, number of household members per sleeping room, ownership of a bank or post-office account, ownership of a mattress, a pressure cooker, a chair, a cot/bed, a table, an electric fan, a radio/transistor, a black & white television, a colour television, a sewing machine, a mobile telephone, and any other telephone, a computer, a refrigerator, a watch or clock, a bicycle, a motorcycle or scooter, an animaldrawn cart, a car, a water pump, a thresher, and a tractor. Here each household was assigned a score for each asset and the scores were summed for each household and divided into five quintile groups starting from lower strata to higher strata like poorest, poorer, medium, richer and richest. These categories were however supplied along with the data.
To see the relative and effective intervention, the risk of Z-score value for under-nutrition, immunization status and morbidity were regressed on socio-economic variables using categorical logistic regression analysis. Dependent variables are taken as binary. Children whose Z-scores are below −2 are coded as “1” and those with Z-scores −2 or higher are coded as “0”. For immunization status, not-immunized has taken as “1” and immunized is coded as “0”. For morbidity status, morbidity was considered as “1” and others are coded as “0”. An estimated odd ratio of “1” indicates that the nature of dependent variable is not different from the reference category. If the estimated odd ratio is >1, the probability of becoming affected is more in this category compared to the reference category and if it is <1, then it is just opposite to that of “>1” case.
3. RESULTS
Table 1 indicates that in India, according to third phase of national family health survey data, 27.8% infants are underweight, 22.5% are stunted and 26.7% are wasted. By gender differences, underweight boys are 28.0% while girls are 27.6%. 23.5% boys and 21.5% girls are stunted while 26.5% boys and 26.9% girls are wasted. Percentages of underweight and stunted infants have an increasing trend over ages in months, whereas percentage of wasted children has a decreasing trend.
Table 2 presents the non-immunization status of in-