On Infrasound Standards, Part 1 Time, Frequency, and Energy Scaling ()
1. Overture
Infrasound is used to characterize manifold natural and anthropogenic sources, from tsunamigenesis in the mHz frequency range to wind turbines near the audio range. The spectrum of atmospheric waves propagating at infrasonic speeds can span over four orders of magnitude (2 mHz - 20 Hz), a decade broader than the audio range (20 Hz - 20 kHz). Signals can be nearly continuous or transitory, and their energy spectrum can vary by more than twelve orders of magnitude (120 dB). The spatial distribution of infrasonic sensing systems may vary from meters to kilometers. Due to these diverse spatial, temporal, spectral, and intensity scales, it can be challenging to process infrasonic signals using consistent, reproducible parameters.
This paper is an invitation to standardize infrasound metrics using historical and ongoing efforts by diverse communities as a compass, and an entreaty to extend familiar algorithms and accepted standards into a slightly different, more transportable framework. It proposes a scaling of time, frequency and amplitude that may permit comparative calibrations, data quality assessments, and tests on sensing systems, as well as the benchmarking and validation of propagation models, detection algorithms, and classification taxonomies. Although this work presupposes a familiarity with digital signal processing of waveform signatures and some intimacy with spectral analysis, it does not require expertise in infrasound. This paper should provide sufficient information to permit the computational implementation of the proposed methodology and algorithms for further evaluation and improvement.
2. Infrasonic Pressure Signatures
Most infrasound data in the 21st century consists of 24- bit digital pressure waveforms with precise GPS time stamps, fixed station locations, and stable sampling rates. These data, with channel code BDF, are readily available through the IRIS DMC (http://www.iris.edu/dms/dmc/). A waveform associated with a source or event of interest is referred to as a signal. Its signature usually consists of the temporal, spectral, amplitude, and phase relationships that help identify the signal.
In general, we wish to detect, characterize, locate, and identify a signal of interest within an infrasonic pressure record. Yet these signals are often emergent, transient, immersed in ambient noise, and have distinguishing features that are not evident in raw pressure waveforms. In addition, a source signature can be significantly altered by atmospheric variability.
In practice, the first step in the inspection of a record is the assessment of waveform data quality and its statistical properties in the time domain. This step identifies data gaps, electronic noise, timing issues, clipping, or any other system problems that will degrade the usability of the data. If data are worthy of further processing, the next step in characterizing a signature is to compute its time-varying spectral amplitude. Figure 1 shows the broadband infrasonic signature of the Russian meteor captured by International Monitoring System (IMS) infrasound array I31KZ in Kazakhstan. This exploding fireball produced one of the most intense broadband signals captured by the IMS network, with sound radiated beyond the 4.5 mHz - 9 Hz passband shown in Figure 1. With properly scaled spectral parameters, the frequency domain representation is often more useful than the raw pressure record for identifying robust infrasonic signal features specific to an event of interest.
One of the keys in signal detection and identification is the ability to separate the signal spectrum from the noise spectrum, and eliminate as much of the noise as possible from subsequent analyses. A network of single microphones can readily identify energetic impulsive signals where the amplitude is much higher than the ambient noise within a given passband. By defining the total energy per frequency bin over the record duration in Figure 1 as the ambient intensity levels, it is possible to readily estimate a signal-to-noise (S/N) intensity ratio per timefrequency bin (Figure 2). A more sophisticated approach to estimating S/N is discussed in Section 7. However, a single sensor cannot differentiate between wind noise or competing acoustic sources, so the signal should be loud and clear for single-sensor or network processing.
At distances from tens to thousands of kilometers, or in situations where competing acoustic sources are present, more sophisticated systems are preferable. Four or more calibrated sensors precisely time-stamped and deployed as arrays can provide reliable signal detection within a designated frequency (f) band, or wavelength (l = cs/f) range, where cs is the (infrasonic, seismic, hydroacoustic, or gravity wave) signal speed at the array. An excellent review of array design criteria is given by [1]. A single array yields the direction of arrival (backazimuth) and the apparent signal velocity across the array aperture and can discriminate between dissimilar but simultaneous competing sources. With the notable exception of overhead regional sources, most infrasonic arrivals have an apparent acoustic signal speed close to that of the sound speed (c) at the array site. By using intersecting backazimuths, two properly sited arrays can locate and identify a source. Although infrasound arrays are used routinely by the international infrasound community for detection, location, and identification of natural and man-made events (e.g. [2]), there are no stan-

Figure 1. Russian meteor waveform and its spectral features at I31KZ observed on 15 February 2013 at a range of ~600 km from the source. This is one of the most broadband signals captured by the IMS network, and a bandwidth of 0.0045 Hz (4.5 mHz) to 9 Hz is shown in the logarthmic frequency axis. The upper panel is the bandpassed waveform, and the panel below it is the FFT spectrogram with a fixed time window duration (Equation (1)) and units of Pa2/Hz. The third panel from top is the sound pressure level (SPL) with the same time window as the spectrogram but in 1/3 octave bands. Since the FFT window duration is set by the lowest frequency, the temporal resolution is very coarse and there is substantial energy leakage between overlapped time windows, reducing signal onset precision. The lowermost panel is the SPL using the INFERNO multiresolution energy estimator described in Section 6, with a substantial increase in the accuracy and temporal resolution of the signal energy distribution.

Figure 2. Close up of beamformed waveform and its S/N ratio in dB relative to the averaged intensity over the record, without instrument correction.
dardized detection parameters for the validation and benchmarking of array processing algorithms.
To optimize array performance, the signal wavelength should be neither excessively large nor small relative to the array aperture L [3]. If the wavelength is too large, the errors in trace velocity and azimuth increase. If the wavelength is too small, we have spatial aliasing. For a typical four-element tripartite (centered triangle) array, the aperture can be approximately by the longest distance between elements, which is (generally) approximately twice the smallest inter-element distance. Aliasing would become prominent when l < L, but would be somewhat tolerable between the main lobe and the first grating lobe (L/2 < l < L). When l > L (with 12L as an empirical limit), oversampling [3] yields degraded precision in arrival azimuth and velocity estimates. In practice, we have much better performance than anticipated with high signal-to-noise (S/N) broadband transients, but if the S/N ratio decreases or the signal is more tonal one must be mindful of the reliability of array results. Taking L/2 < l < 12L as a practical array wavelength range leads to an array bandwidth of c/(12L) < f < c (2/L). Thus array I59US, Hawaii, with an aperture of 2 km, would have a bandwidth of [0.014 Hz - 0.34 Hz]. However,I59US routinely detects surf signals with a high S/N up to 4 Hz, with good performance at 1 Hz (l ~ L/6), where aliasing is predicted to be prominent but there is a decrease in ambient noise levels and a corresponding increase in S/N.
In contrast, array UH MENE in Volcano, Hawaii, with an aperture of 0.1 km, would have a detection bandwidth of [0.3 Hz - 6.8 Hz], yet also routinely detects signals well outside the band when the S/N is sufficiently high. Infrasound data for both I59US and MENE are available through the IRIS DMC. Note that a network can turn into an array if the frequency or propagation velocity are within the aforementioned optimal array bandwidth, for example when considering deep infrasound recorded by the IRIS US Array [4].
Array and network processing can separate signal from noise, although sometimes a signature is sufficiently distinct in amplitude and frequency to permit ready extraction with a single sensor. Signal detection parameters can be tuned to a known source signature, yet in exploratory research we don’t always have a priori knowledge of a signal’s signature and it is useful to have a robust, broadband detection parameter set that permits the identification of anomalous signals relative to an ambient sound field.
3. Conservation Principles
It is essential to identify parameters that can robustly and consistently characterize infrasonic signatures. Both continuous and transient signals and their combinations compose the ambient field, and should be considered.
In a linear acoustic system, the signal spectrum is preserved from source to the receiver, and no frequency component absent in the source can be observed at the receiver. However, Earth’s complex atmosphere and diverse topography conspire against linearity, which leaves the more interesting problem of quantifying how the source energy spectrum is repartitioned along the propagation path to the receiver. To consistently account for this energy repartitioning, it is useful to define a standardized set of frequency bins tuned to the signal of interest. The design of such frequency banks will be discussed in Section 5.
The conservation of apparent horizontal phase velocity, or ray parameter, during propagation in heterogeneous anisotropic atmospheres (e.g. [5,6]) is applicable for vertically stratified propagation environments. Most telesonic signals of interest arrive at the array with a nearlyhorizontal incidence angle, with an apparent velocity corresponding to the local sound speed at the receiver. The observed signal velocity across the array is valuable for identifying coherent signals and can be useful for the discrimination of overhead sources at close ranges. However, horizontal refraction near Earth’s surface, heterogeneities along the propagation path, multipathing, and simultaneous arrivals from competing sources can lead to low robustness in using the apparent horizontal phase velocity as an unambiguous arrival identifier. The apparent speed, or celerity, defined as the ratio of the total propagation range to the total travel time, was introduced in [7,8] as a more stable parameter for identifying multipath arrivals and locating telesonic ( >250 km) sources [9]. If the origin time and location of an event is well known, it is useful to plot the waveform celerity along the time axis for phase identification [10]. Winds transverse to the propagation direction will introduce an angular deviation from the expected arrival azimuth, which is often estimated with ray tracing algorithms [5]. Observed azimuth deviations can vary substantially (up to ±15 degrees) due in large part to the variability of atmospheric winds.
Causality is a fundamental requirement, one of the primary discriminants for signal association, and the main reason why the celerity estimates are useful. A signal associated with an event must not arrive before its fastest predicted propagation time, and not much later than permitted by the slowest propagation speed along a prescribed path. One can readily estimate the expected arrival times by using a nominal celerity range of Cel ~ [0.21 - 0.34] km/s, with propagation times of TCel = R/Cel, where R is the range (km) of the great circle path from the source to the receiver. However, temporal correlation does not imply causation, and assuming a signal corresponds to a known source only because of its time of arrival will lead to an overabundance of false detections and misidentifications. Furthermore, reradiation of sound by topography and bathymetry presents a coupled wave problem that may shift the expected sound reception window earlier or later, depending on the final sourcereceiver path [11].
Substantial effort has also been placed on amplitude scaling relationships (e.g. [12]). Sach’s scaling [13] exemplifies a robust set of scaling relationships between source pressures, period, yield, and range representative of the hydrodynamics of explosive detonations, but should only be applied to the near-field regime and physical processes for which they were designed. Attempts have been made at deriving scaling laws using either peak overpressure or peak period applicable to distances extending well beyond the hydrodynamic regime where the Sach’s scaling is valid. However, due to nonlinearities inherent in finite amplitude effects at high altitudes, atmospheric attenuation, and scattering, neither peak period (frequency) or amplitude (overpressure) have a physical conservation law that justifies their preservation during telesonic propagation.
In summary, in infrasonic propagation the transfer function between the source and receiver is nonlinear and anisotropic. The source spectrum is not always preserved, the apparent horizontal velocity is not a reliable discriminant for infrasonic arrivals, azimuth deviations are temperamental, causality is essential but ambiguous, and existing scaling laws can be fickle. Conservation of momentum is already used in the governing acoustic-gravity wave equations, and the only remaining, reliably invariant principle is the conservation of energy, with the caveat that it is necessary to isolate the system in consideration. This could include, but not be limited to, geomagnetic perturbations, gravity wave fields, solar tides, severe weather disturbances, and wave coupling in Earth’s solids, liquids, gases, and plasmas, and combinations thereof.
The next sections focus on developing a standardized methods for estimating the energy, or intensity, of an observed infrasonic pressure signature with substantial energy below 20 Hz. Due to the aforementioned complications introduced by the source physics and propagation environment, it will be instructive to accurately track the changes in the statistical properties of a signal as a function of time and frequency as it travels across a network of sensors or arrays. These statistical properties provide a measure of the variability of the source processes and propagation media.
4. Scaling Time
Acoustics is a branch of fluid mechanics, where scaling and nondimensionalized numbers are routinely used to create numerical and laboratory models of complex fluid behavior. For systems with intrinsic characteristic frequencies, dimensions, speeds, or time constants, it is often possible to identify a flow regime for which these intrinsic values are interrelated. Self-similar relationships reproduce themselves at different scales in such a way that they replicate nondimensionalized attributes [14].
This section develops self-similar time window durations for processing and characterizing waveform data using pre-existing standards for reference and validation. Although this paper concentrates on infrasonic pressure in Pascals (Pa), the proposed methodology is transportable to other measurements amenable to Fourier synthesis, such as displacement, velocity and acceleration, or even counts in the absence of a calibration value. The primary scaling variables would be the effective array aperture L and either the lowest frequency (for Fourier synthesis) or the center frequencies (for filter banks)
within a prescribed signal bandwidth. In doing so, it is possible to extend the basic principles of Fourier synthesis to high-resolution multispectral analysis techniques in logarithmic-frequency space with time-window autoscaling.
Spectral decomposition using the Fast Fourier Transform (FFT) is routine in the acoustics community. Power spectral densities and spectrograms are commonly applied to sound records, with the probability density function of the power spectral density providing a useful measure of confidence levels. Not surprisingly, Fourier synthesis performs well on tones and harmonics that can be accurately represented as discrete sinusoids, although eigenvalue-based superresolution algorithms can outperform FFTs (e.g. MUSIC [3]). These algorithms are an essential part of the sound hunter quiver, and the reader should be familiar with them. Well-established algorithms and standards in the geophysical infrasound and seismic communities are described in [15]. However, these geophysical algorithms usually use arbitrary spectral computation parameters that are generally not transportable to other applications of infrasound, such as historical studies, noise and vibration control, and other research in low-frequency acoustics which adhere to ANSI and ISO standards for noise characterizations.
A limitation of Fourier synthesis is that the minimum window duration TW for array processing is fixed (Figure 1) and set by the lowest frequency (fci, in Hz), or the longest period (Tci = 1/fci) of interest,
 , (1)
, (1)
where NP is the number of periods in the window, L (km) is the array aperture or maximum element distance under consideration, and c (km/s) is the slowest speed of propagation of the wave type of interest, so that TL = L/c is the maximum time a signal may take to arrive at all the sensors. M is a scaling coefficient that compensates for window edge effects, filter ringing, and signal duration. M has a recommended range of 2 - 4, with a minimum of M = 2 when using a tapering window. If the microphones are collocated, or very close relative to a wavelength, then L = 0 and this contribution vanishes.
Fourier analysis is well suited for narrowband signals and linearly-spaced tones, when a high spectral resolution is desirable. However, the FFT fixed window duration does not generally provide a sufficiently fine temporal resolution. When analyzing a time-varying sound field over four decades in frequency, this type of windowing often leads to signal undersampling in the low frequency bands and oversampling at high frequencies (Figure 1). For commonly encountered non-stationary infrasonic signals, this often leads to unreliable statistics at both ends of the bandpass as well as unacceptable levels of ambiguity in arrival times and phase discrimination. For broadband non-stationary signals it is useful to consider alternative processing techniques that improve the temporal resolution in the characterization of signal and noise variability.
Fractional octave bands (Section 5) are traditionally used in environmental acoustics, sound and vibration [16]. Fractional octave schemas divide a bandpass of interest into overlapping, narrow bandpassed filter banks. For a narrowly bandpassed signal with a center frequency fc (with period Tc = 1/fc), a scaleable time window length for that passband may be defined as:
 (2)
(2)
where NP represents the number of periods per band. In the absence of any preexisting knowledge about the target signature NP could have a range of 5 - 15, with NP = 10 (ten center periods per time window) a reasonable compromise. TL represents the minimum window length needed for the signal to traverse across the array at a speed c, and often sets the finest time resolution at high frequencies.
Using c = lc∙fc, this expression can be nondimensionalized as
 (3)
(3)
The second term in Equation (3) shows explicitly the effects of spatial aliasing and oversampling. From Section 2, this second term will be increasingly important in the spatially aliased wavenumber region where l < L.
As an example, for an array aperture of 2 km, a sound velocity of 0.34 km/s, NP = 10, and M = 4, Equation (2) can be simplified to:
 . (4)
. (4)
Note that as fc increases, TW approaches a constant value of 24 s. In effect, there is a cutoff frequency for which the 1/f scaling given by Equation (2) is not useful. This cutoff frequency is defined by
 (5)
(5)
Let fci and fcf be the lowest and highest center frequencies in a filter bank. If fci > fcut, there is not much point in using 1/f scaling as it only makes the windows longer and degrades temporal resolution. In this case it is useful to set NP = 0 and use a constant window duration given by
 (6)
(6)
If fcf < fcut, it is counterproductive to use the constant array correction TL as this also degrades temporal resolution. In this case it is practical to set TL = 0 and use a window duration given by
 (7)
(7)
This corresponds to perfect 1/f scaling, and is the default solution to the case of L = 0 for processing single, adjacent sensors or networked sensors far from each other. For rapidly changing source processes, such as moving sources, TW should we minimized and could theoretically be lowered to the Gabor limit (Section 5).
These expressions provide a self-consistent method to autoscale a time window TW to the lowest frequency of interest fci when using standard FFTs with fixed window lengths, or to a center frequency fc when using filter banks. For the purposes of comparison, it is useful to select fci so that it matches the lowest third octave center frequency in a bandpass of interest.
Some array processing algorithms, such as Progressive Multiple Channel Correlation (PMCC), version 4 [17, 18], have already incorporated time window algorithms compatible with Equations (1)-(7) (Appendix A). Although the number of periods is here assumed to be an integer, this is not a requirement. For 1/f scaling, constant values for NP and M can be recovered from the relationships in Appendix A, where for fci < fcut
 , (8)
, (8)
and for fcut < fcf,
 , (9)
, (9)
where Twi, fci are first and Twf, fcf are the last window durations and center frequency bands of interest. The aforementioned relationships can help an analyst reduce the number of free parameters and facilitate comparisons when designing detection configurations for a particular signal type and array geometry. More sophisticated expression with NP as a function of frequency could be developed, but are beyond the scope of this paper.
5. Scaling Frequency: Logarithmic Filter Banks
As mentioned in Section 3, to reproducibly track signal features over time and frequency along a propagation path it is useful to design a standardized set of frequency bins. In the case of classic Fourier synthesis the frequency bin size is fixed and is set by the fixed time duration, Df = 1/Twi (Equation (1)). However, in the case of filter banks the bandwidth increases with the center frequency, and it is possible to either have a constant time window or scale the time window so that it shrinks with increasing center frequency (Figure 1).
To standardize bandwidth scaling, this work extends fractional-octave band schemas [19,20] down to 0.001 Hz (1000 s periods), which includes some of the deepest acoustic-gravity and interface waves captured by the global IMS infrasound network [21]. However, some of these relationships could be applicable to the analysis of other propagating perturbations, such as barometric pressure [22] and surface wave height and wind speeds [23], whose records may extend over periods of months, years, or decades.
Filter banks in linear frequency spaces are used extensively in analogue and digital signal processing. Audio equalizers are examples of applied filter banks, with value placed on the ability to reconstruct the original sound. Filter banks in audio applications usually apply the discrete Fourier or continuous wavelet transforms, which are optimized with window lengths of 2n points. Although some software packages can create fractional octave bands in the audio range with ease, the algorithms in this section permit the ready construction of constant-quality-factor fractional octave filter banks with an arbitrary level of overlap down to the deep infrasound range.
Infrasonic 1/3 octave band central frequencies are specified in [20], which builds on the accepted 1/3 octave filter specifications given in [19, 24]. One advantage of the 1/3 octave filter is that 210/3 = 10.0794 ~ 10, so with some minor adjustments in the intervals it is possible to repeat the same schema every decade. Table 1 defines the preferred (nominal) central 1/3 octave band frequency (fc), lower half-power frequency (f1), and upper half-power frequency (f2). When the lower and upper half-power levels intersect, total power is recoverable by considering adjacent bands, with a possible overestimation of energy if the filter does not roll off sufficiently fast.
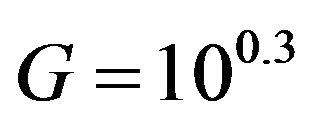
The band number, also referred to as the frequency level, is used to compute the exact band frequencies. In a strictly-defined 1/3-octave band, f2 = 21/3f1 and fc = 2n/3, where n is the band number and n = 0 yields the preferred reference frequency of 1 Hz [19]. The problem with using a binary base is that deviations from the computed and nominal frequencies increase as one moves away from the reference frequency. Instead, the preferred decimal base interval between exact frequencies is recommended, where 100.3 = 1.995 ~ 2. By setting:
 (10)
(10)
and defining the center frequency of an Nth octave band in the infrasound range as

Table 1. Preferred frequencies (fcN, f1N, f2N) for nominal 1/3 octave bands and computed 1/3 octave bands (fc, f1, f2) extended to the infrasound range using G = 100.3. The scaled bandwidth bN1 and the percent error (e) between nominal and exact frequencies are shown in the last three columns. Note exact recurrence with every decade of frequency, so that this schema can be extended as deep in frequency as desired.
 (11)
(11)
where n = [‒30, 13] for N = 3 and , yields a frequency range of 0.001 - 20 Hz. Note that n will rescale with N so that it matches the number of bands per octave, but it is always centered around f0 at n = 0.
Defining
 , (12)
the half-power (bandedge) frequencies are
 (13a)
(13a)
 (13b)
(13b)
(Appendix 3). The central frequency fc of the proportional frequency band is the geometric mean of the lower (f1) and upper (f2) bandedge frequencies of the partitioning,
 (14)
(14)
with
 (15)
(15)
Yielding a constant-bandwidth filter set with scaled bandwidth
 . (16)
These stable, scalable properties make Nth octave bands useful building blocks. Unless otherwise stated, throughout the rest of this paper, fc, f1, f2 refer to the center frequency and upper and lower half-power bandedge frequencies for Nth octave bands. When referring to a specific band number n, the notation fcn or fc(n) is used.
Table 1 shows the computed 1/3 octave bands in the infrasound range, as well as the errors relative to the nominal bands. Errors are at most on the order of 1% from nominal, and both the computed frequencies as well as the errors recur every decade, as expected. This fractal schema can be propagated as deep into the infrasound range as desired with predictable results. Due to the small errors, it is preferable to use the exact rather than the nominal frequencies in computations. However, as per [24,30], the nominal rounded values should be used in labeling for simplicity.
For 1/3 octave bands, kN = 1.12 and bN = 0.0231, as shown in Table 1. Note these formulations can be used for any Nth octave band, but are particularly well suited for intervals of thirds, where . Table 2 shows the fractal nature of logarithmically spaced fractional octave bands and how this schema imbeds a recurring binary system within a decimal system. When N is an odd multiple of three we can contract from higher to lower orders quite exactly, whereas when N is even we have to split bands to recover an octave.
When designing fractional octave band filters in logarithmic frequency spaces it is desirable to use evenlyspaced center frequencies as they yield the most stable and self-similar filter amplitude and phase responses. This can be readily accomplished by using Equations (10)-(16). However, an alternative method, used in PMCC4 and consistent with the aforementioned intervals, defines the lowest and highest frequency of interest, as well as the number of bands NF (Appendix B).
Figure 3 shows evenly log-spaced 1/3 octave bands with −3dB (half-power) bandedgeoverlap using 2nd order Chebyshev bandpass filters, which may not yield the highest precision on energy estimates but are stable over the 0.01 - 5 Hz IMS monitoring band (Appendix C). An assessment of detector performance using various filter banks with varying bandedge overlap is beyond the scope of this paper, although preliminary tests demonstrated that the accuracy of the infrasonic energy estimates will depend on these filter bank properties.