Evaluation of the Optimal Image Reconstruction Interval for Noninvasive Coronary 64-Slice Computed Tomography Venography

Abstract

Objective: We investigated the appropriate reconstruction interval required to generate optimal quality images of the coronary veins and to evaluate the size of each vein at the systolic and diastolic phases using coronary computed tomography (CT) venography. Methods: Coronary CT venograms obtained from 30 patients using 64-slice CT were reconstructed at 0% to 90% of the cardiac cycle in 10% increments. Two radiologists assessed the image quality of the anterior interventricular vein (AIV), the great cardiac vein (GCV), the posterior vein of the left ventricle (PVLV), the posterior interventricular vein (PIV), the coronary sinus (CS) and the small cardiac vein (SCV). We determined the sizes of measurable CS (n = 16) and GCV (n = 12) at the end systolic and mid diastolic phases. Results: The most appropriate reconstruction point for all coronary veins turned out to be at the mid-diastolic phase. The size of the CS and GCV was greater at a 30% than that at a 70% R-R interval (p < 0.01). Conclusions: Image quality was optimal at the mid-diastolic phase for each coronary vein, but the sizes of the coronary veins varied during the cardiac cycle. The cardiac cycle must be considered when measuring the sizes of cardiac veins.

Share and Cite:

Y. Ohta, S. Fujii, S. Kakite, E. Mizuta, M. Hashimoto, T. Kaminou and T. Ogawa, "Evaluation of the Optimal Image Reconstruction Interval for Noninvasive Coronary 64-Slice Computed Tomography Venography," Open Journal of Radiology, Vol. 3 No. 2, 2013, pp. 66-72. doi: 10.4236/ojrad.2013.32010.

1. Introduction

Successful percutaneous procedures such as biventricular pacing [1,2], catheter ablation [2,3], cellular cardiomyoplasty [4], and percutaneous mitral valve annuloplasty [5] require considerable understanding of the cardiac veins. Balloon-occlusion coronary sinus (CS) angiography is a popular method of visualizing the coronary veins, but this method is technically challenging [6], and it does not provide information on relationships between cardiac veins and other cardiac structures. Multidetector row computed tomography (MDCT) with retrospective electrocardiogram (ECG)-gating and intravenous administration of contrast medium provides accurate images of cardiac structures with high spatial resolution less invasive. Such measurement of the coronary venous system helps plan preoperatively for several procedures mentioned above [5,7-10].

ECG-gated MDCT images are generally reconstructed at a point between end systole and mid diastole that represents minimal cardiac motion. However, little has been reported about image quality and reconstruction intervals of coronary veins using MDCT [11,12]. In addition, the size of the coronary sinus differs during the cardiac cycle, and coronary veins have not been numerically compared among the cardiac cycle using MDCT.

Our aims of this study are to investigate which reconstruction interval is required to generate optimal quality images of the coronary veins and to evaluate the sizes of coronary veins at the systolic and diastolic phases. 

2. Materials and Methods

2.1. Study Population

We retrospectively reviewed data from consecutive 30 patients (14 males and 16 females; mean age, 67 years; age range, 52 - 86 years) who had undergone MDCT to evaluate the coronary arteries. Patients had atypical chest pain combined with a high risk of coronary artery disease.

The exclusion criteria comprised an irregular heart rate, allergy to contrast medium containing iodine, renal insufficiency (estimated glomerular filtration rate: eGFR < 30 mL/min/1.73 m2), pregnancy, hemodynamic instability, previous bypass surgery, and/or contrast density in the coronary sinus below 150 Hounsfield units (HU). None of the patients corresponded with these criteria. 

Our institutional ethics committee approved this retrospective study; written, informed consent from patients was not required. 

2.2. Patient Preparation

Patients who were not prescribed with beta-blocker drugs orally received 20 mg of metoprolol for heart rates over 70 beats per minutes one hour before MDCT imaging. Sublingual nitroglycerin was given to all patients before image acquisition.

2.3. CT Protocol

All scans were acquired in the craniocaudal direction using a 64-slice CT scanner (Aquilion 64, Toshiba, Otawara, Japan) during a single breath-hold. A bolus of non-ionic iodinated contrast agent (Iohexol, Omnipaque 350 mgI/ml, Tokyo, Japan) was injected at a rate of 0.06 ml/kg/sec for 13 seconds via a 20-gauge catheter placed in the right antecubital vein with 25 ml of saline chaser using a dual head power injector (DualShot, Nemoto, Japan). The scanning delay was controlled by bolus tracking (SureStart, Toshiba, Japan) with a region of interest placed in the aortic root. Data acquisition was started 6 seconds after CT attenuation reached a threshold of 120 HU from the baseline.

Data were acquired in the craniocaudal direction under the following conditions: detector collimation, 0.5 mm (64; gantry rotation time, 330 millisecond; tube voltage, 120 kV; tube current, 500 mAs. ECG was digitally recorded during data acquisition and stored with unprocessed CT datasets. Patients who were not prescribed with beta-blocker drugs orally received 20 mg of metoprolol for heart rates over 70 beats per minutes one hour before MDCT imaging. Sublingual nitroglycerin was given to all patients before image acquisition.

2.4. CT Protocol

Datasets were reconstructed in 10% steps from 0% to 90% of the R-R interval using retrospective ECG gating with a slice thickness of 0.5 mm. We used a muticycle recon-struction algorithm that provided heart rate-dependent temporal resolution between 89.2 and 175.0 millisecond from a 330 millisecond gantry rotation. All reconstructed images were transferred to a separate workstation (Zio-station, Amin, Japan).

2.5. Image Analysis

Two independent experienced cardiac radiologists (Y.O and S.F) evaluated the reconstructed data. The anterior interventricular vein (AIV), great cardiac vein (GCV), posterior interventricular vein (PIV), and small cardiac vein (SCV), as well as the posterior vein of the left ventricle (PVLV) and the posterior coronary sinus (CS), were evaluated from volume-rendered images (Figure 1).

Each cardiac vein in all 10 data sets from 0% to 90% of the R-R interval was evaluated in three orthogonal planes using multiplanar reformatting by both readers with regard to the presence of motion artifacts. Image quality was assessed using the described confidence scale of 5, no motion artifacts; 4) minor artifacts (mild blurring); 3) moderate artifacts (moderate artifacts without discontinuity; 2) severe artifacts (doubling or discontinuity in the course of the vein; 1) nonvisible (unable to differentiate target vein from other veins or nonexistent) [13,14]. The score for each vessel was then determined by consensus. A score of 3 was considered diagnostic in terms of image quality for clinical diagnostic purposes. Likewise, scores of 4 or 5 were considered appropriate for measuring the sizes of veins. Figure 2 shows examples of image grading.

We measured the cross-sectional area of the CS and the diameter of the GCV, both of which were measured at end-systolic (30%) and mid-diastolic (70%) phases of the R-R interval. Cross-sections of the CS are not circular, so we measured cross-sectional areas of this vessel [5,8].

2.6. Statistical Analysis

Data were statistically analyzed using SPSS software version 17.0 (SPSS, Chicago, IL, USA). Data are ex-

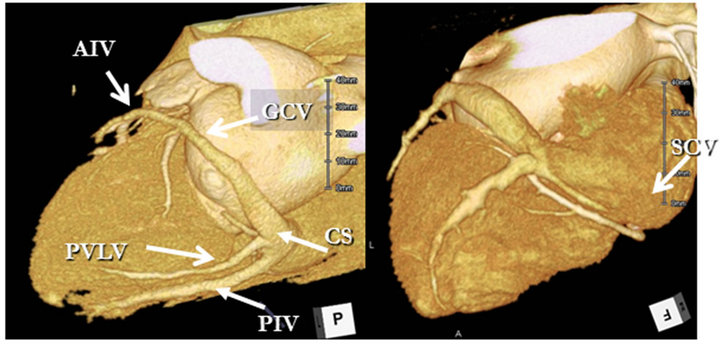
Figure 1. Coronary CT venogram of a representative case. CS: Coronary sinus; PIV: Posterior interventricular vein; PVLV: Posterior vein of left ventricle; GCV: Great cardiac vein; AIV: Anterior interventricular vein; SCV: Small cardiac vein.

pressed as mean ± standard deviation for continuous variables and as frequencies for categorical variables. We analyzed 300 sets of CT data acquired from coronary veins (10 per patient). Analyses proceeded at the pervessel level with seven coronary veins for each of the 30 patients, resulting in 210 vessels for each reconstructtion and 10 reconstruction intervals for a total of 2100 vessels.

The null hypothesis that not all ratings for reconstructtions have the same mean was tested using the multivariate analysis of variance for related multiple repeated measurements (ANOVA). Multiple pairwise comparesons of means of related samples were assessed using the Scheffé test.

A P value of <0.05 indicated a statistically significant difference. The sizes of coronary veins were compared using the Wilcoxon signed-ranks test and a P value of <0.01 indicated a statistically significant difference.

3. Results

Table 1 summarizes the patients’ characteristics and scan

Conflicts of Interest

The authors declare no conflicts of interest.

References

[1] S. Cazeau, C. Leclercq, T. Lavergne, S. Walker, C. Varma, et al., “Effects of Multisite Biventricular Pacing in Patients with Heart Failure and Intraventricular Conduction Delay,” The New England Journal of Medicine, Vol. 344, No. 12, 2001, pp. 873-880. doi:10.1056/NEJM200103223441202
[2] R. C. Hendel, M. R. Patel, C. M. Kramer, M. Poon, R. C. Hendel, et al., “ACCF/ACR/SCCT/SCMR/ASNC/ NASCI/ SCAI/SIR 2006 Appropriateness Criteria for Cardiac Computed Tomography and Cardiac Magnetic Resonance Imaging: A Report of the American College of Cardiology Foundation Quality Strategic Directions Committee Appropriateness Criteria Working Group, American College of Radiology, Society of Cardiovascular Computed Tomography, Society for Cardiovascular Magnetic Resonance, American Society of Nuclear Cardiology, North American Society for Cardiac Imaging, Society for Cardiovascular Angiography and Interventions, and Society of Interventional Radiology,” Journal of the American College of Cardiology, Vol. 48, No. 7, 2006, pp. 1475-1497. doi:10.1016/j.jacc.2006.07.003
[3] C. Weiss, R. Cappato, S. Willems, T. Meinertz and K. H. Kuck, “Prospective Evaluation of the Coronary Sinus Anatomy in Patients Undergoing Electrophysiologic Study,” Clinical Cardiology, Vol. 22, No. 8, 1999, pp. 537-543. doi:10.1002/clc.4960220810
[4] C. A. Thompson, B. A. Nasseri, J. Makower, S. Houser, M. McGarry, et al., “Percutaneous Transvenous Cellular Cardiomyoplasty. A Novel Nonsurgical Approach for Myocardial Cell Transplantation,” Journal of the American College of Cardiology, Vol. 41, No. 11, 2003, pp. 1964-1971. doi:10.1016/S0735-1097(03)00397-8
[5] A. J. Choure, M. J. Garcia, B. Hesse, M. Sevensma, G. Maly, et al., “In Vivo Analysis of the Anatomical Relationship of Coronary Sinus to Mitral Annulus and Left Circumflex Coronary Artery Using Cardiac Multidetector Computed Tomography: Implications for Percutaneous Coronary Sinus Mitral Annuloplasty,” Journal of the American College of Cardiology, Vol. 48, No. 10, 2006, pp. 1938-1945. doi:10.1016/j.jacc.2006.07.043
[6] E. Meisel, D. Pfeiffer, L. Engelmann, J. Tebbenjohanns, B. Schubert, et al., “Investigation of Coronary Venous Anatomy by Retrograde Venography in Patients with Malignant Ventricular Tachycardia,” Circulation, Vol. 104, No. 4, 2001, pp. 442-447. doi:10.1161/hc2901.093145
[7] S. Abbara, R. C. Cury, K. Nieman, V. Reddy, F. Moselewski, et al., “Noninvasive Evaluation of Cardiac Veins with 16-MDCT Angiography,” American Journal of Roentgenology, Vol. 185, No. 4, 2005, pp. 1001-1006. doi:10.2214/AJR.04.1382
[8] M. R. Jongbloed, H. J. Lamb, J. J. Bax, J. D. Schuijf, A. de Roos, et al., “Noninvasive Visualization of the Cardiac Venous System Using Multislice Computed Tomography,” Journal of the American College of Cardiology, Vol. 45, No. 5, 2005, pp. 749-753. doi:10.1016/j.jacc.2004.11.035
[9] J. P. Singh, S. Houser, E. K. Heist and J. N. Ruskin, “The Coronary Venous Anatomy: A Segmental Approach to Aid Cardiac Resynchronization Therapy,” Journal of the American College of Cardiology, Vol. 46, No. 1, 2005, pp. 68-74. doi:10.1016/j.jacc.2005.04.017
[10] L. F. Tops, N. R. Van de Veire, J. D. Schuijf, A. de Roos, E. E. vander Wall, et al., “Noninvasive Evaluation of Coronary Sinus Anatomy and Its Relation to the Mitral Valve Annulus: Implications for Percutaneous Mitral Annuloplasty,” Circulation, Vol. 115, No. 11, 2007, pp. 1426-1432. doi:10.1161/CIRCULATIONAHA.106.677880
[11] H. Tada, K. Kurosaki, S. Naito, K. Koyama, K. Itoi, et al., “Three-Dimensional Visualization of the Coronary Venous System Using Multidetector Row Computed Tomography,” Circulation Journal, Vol. 69, No. 2, 2005, pp. 165-170. doi:10.1253/circj.69.165
[12] R. Mlynarski, M. Sosnowski, A. Wlodyka, K. Chromik, W. Kargul, et al., “Optimal Image Reconstruction Intervals for Noninvasive Visualization of the Cardiac Venous System with a 64-Slice Computed Tomography,” The International Journal of Cardiovascular Imaging, Vol. 25, No. 6, 2009, pp. 635-641. doi:10.1007/s10554-009-9463-0
[13] S. S. Shim, Y. Kim and S. M. Lim, “Improvement of Image Quality with Beta-Blocker Premedication on ECG-Gated 16-MDCT Coronary Angiography,” American Journal of Roentgenology, Vol. 184, No. 2, 2005, pp. 649-654. doi:10.2214/ajr.184.2.01840649
[14] S. Leschka, L. Husmann, L. M. Desbiolles, O. Gaemperli, T. Schepis, et al., “Optimal Image Reconstruction Intervals for Non-Invasive Coronary Angiography with 64 Slice CT,” European Radiology, Vol. 16, No. 9, 2006, pp. 1964-1972. doi:10.1007/s00330-006-0262-x
[15] S. Achenbach, D. Ropers, J. Holle, G. Muschiol, W. G. Daniel, et al., “In-Plane Coronary Arterial Motion Velocity: Measurement with Electron-Beam CT,” Radiology, Vol. 216, No. 2, 2000, pp. 457-463.
[16] B. J. Wintersperger, K. Nikolaou, F. von Ziegler, T. Johnson, C. Rist, et al., “Image Quality, Motion Artifacts, and Reconstruction Timing of 64-Slice Coronary Computed Tomography Angiography with 0.33-Second Rotation Speed,” Investigative Radiology, Vol. 41, No. 5, 2006, pp. 436-442. doi:10.1097/01.rli.0000202639.99949.c6
[17] L. Husmann, S. Leschka, L. Desbiolles, T. Schepis, O. Gaemperli, et al., “Coronary Artery Motion and Cardiac Phases: Dependency on Heart Rate—Implications for CT Image Reconstruction,” Radiology, Vol. 245, No. 2, 2007, pp. 567-576. doi:10.1148/radiol.2451061791
[18] M. Tschabitscher, “Anatomy of Coronay Veins,” Springer Verlag, New York, 1984.
[19] R. Nezafat, Y. Han, D. C. Peters, D. A. Herzka, J. V. Wylie, et al., “Coronary Magnetic Resonance Vein Imaging: Imaging Contrast, Sequence, and Timing,” Magnetic Resonance in Medicine, Vol. 58, No. 6, 2007, pp. 1196-1206. doi:10.1002/mrm.21395
[20] A. J. Einstein, M. J. Henzlova and S. Rajagopalan, “Estimating Risk of Cancer Associated with Radiation Exposure from 64-Slice Computed Tomography Coronary Angiography,” The Journal of the American Medical Association, Vol. 298, No. 3, 2007, pp. 317-323. doi:10.1001/jama.298.3.317
[21] J. Hausleiter, T. Meyer, M. Hadamitzky, E. Huber, M. Zankl, et al., “Radiation Dose Estimates from Cardiac Multislice Computed Tomography in Daily Practice: Impact of Different Scanning Protocols on Effective Dose Estimates,” Circulation, Vol. 113, No. 10, 2006, pp. 1305-1310. doi:10.1161/CIRCULATIONAHA.105.602490
[22] J. P. Earls, E. L. Berman, B. A. Urban, C. A. Curry, J. L. Lane, et al., “Prospectively Gated Transverse Coronary CT Angiography Versus Retrospectively Gated Helical Technique: Improved Image Quality and Reduced Radiation Dose,” Radiology, Vol. 246, No. 3, 2008, pp. 742-753. doi:10.1148/radiol.2463070989

Copyright © 2024 by authors and Scientific Research Publishing Inc.

Creative Commons License

This work and the related PDF file are licensed under a Creative Commons Attribution 4.0 International License.