Optimization of LPS-Induced Inflammation Model and Its Feasibility as a Fast Screening Model for Cosmetics ()
1. Introduction
With the increase in factors such as environmental pollution, lifestyle stress, late nights, and excessive use of cosmetics, most people’s skin has become sensitive to external stimuli, leading to symptoms like stinging and itching [1] [2] . This phenomenon is primarily attributed to micro-inflammation resulting from compromised skin barrier function. Consequently, cosmetic ingredients with anti-inflammatory properties have become a focal point of research in the cosmetics industry.
Currently, the LPS-induced inflammation model is a commonly used method for screening anti-inflammatory drugs [3] [4] [5] . However, this inflammation model has certain limitations when applied in the cosmetics industry. Firstly, most of the research in this area is concentrated in the fields of medicine and life sciences, focusing on signaling pathways and complex mechanisms, whereas the cosmetics industry is application-oriented, emphasizing application over mechanisms. In the early stage of product development, cosmetics companies need to screen out a few excellent raw materials from a large number of raw materials, so the testing process should be simplified as much as possible. Thus, existing models are overly complex and redundant for the cosmetics industry. Secondly, many studies employ immune cells for experiments, but skin inflammation is a process involving both immune cells and skin cells, where skin cells play a crucial role [6] . Therefore, a more scientific approach may involve studying the combined effect of immune cells and skin cells. Thirdly, there is no uniform LPS concentration when inducing inflammation, leading to variations in results due to differences in the LPS used by different research institutions. As a result, the existing LPS-induced inflammation model is not particularly suitable for screening cosmetic ingredients that can inhibit skin inflammation.
The goal of this research is to optimize the existing LPS model, primarily by combining skin cells and immune cells, considering the impact of LPS on inflammation markers closely associated with skin inflammation in both cell types, including inflammatory factors (IL-1α, IL-8, TNF-α) and reactive oxygen species (ROS). This aims to develop a straightforward, application-focused in vitro skin inflammation model for the rapid screening of anti-inflammatory activity.
2. Materials and Methods
Chemicals and reagents
KC were purchased from Cell Application, INC. (San Diego, USA); THP-1 were purchased from American Type Culture Collection (ATCC) (Virginia, USA); LPS (E. coli 0111:B4) was from Sigma-Aldrich (St. Louis, MO, USA); MTT was from Biosharp Life Science, (Anhui, China); Kits for Enzyme-linked immunosorbent assay (ELISA) were from Abcam (Cambridge, UK); DCFH-DA was from Sigma-Aldrich (St. Louis, MO, USA); Multifunctional plate reader was from PerkinElmer (Massachusetts, USA); Keratinocytes -Serum Free Medium (KSFM) and RPMI 1640 Medium were from Gibco (Massachusetts, USA).
Cell culture
KC and THP-1 culture were done in complete KSFM and complete RPMI-1640, respectively. Culture incubation conditions were set at 37˚C in a humidified atmosphere with 5% CO2. Medium for cells was changed after every other day. Cells were harvested by centrifugation at 1000 rpm for 5 minutes.
Cell viability assay
KC were seeded at a density of 5 × 10³ cells per well in 96 well-plates. After incubation for 3 days, the cells were treated with 0.01~100 µg/mL LPS for 24 h. Added 0.5 mg/mL MTT and continued to incubate for 3 h, then added DMSO and the absorbance was measured with plate reader at 560 nm. MTT can reduce succinate dehydrogenase in living cells to blue-violet crystal formazan, DMSO or other organic solvents can dissolve formazan in cells, and its absorbance can be measured at 560 nm, which can indirectly reflect the number of living cells.
THP-1 were seeded at a density of 1 × 10⁵ cells per well in 96 well-plates, and treated with 0.01 - 100 µg/mL LPS for 24 h, 5 mg/mL MTT was added for further 3 h incubation, then a triplet solution (a mixture of hydrochloric acid, isopropanol and sodium dodecyl sulfate) was added to extract the generated formazan [7] . After 18 h of inocubation, the absorbance was measured with plate reader at 560 nm.
Cytokine assay
KC were seeded at a density of 5 × 10⁴ cells per well in 24 well-plates. After incubation for 3 days, the cells were treated with varied concentrations of LPS for 24 h, the culture supernatant were collected.
THP-1 were seeded at a density of 5 × 10⁵ cells per well in 24 well-plates. After 24 h, the cells were treated with varied concentrations of LPS for 24 h, the culture supernatant were collected.
When detecting the anti-inflammatory activity of Rucika KGM, the control group was treated with the inducible concentration of LPS screened above, and the experimental group was co-treated with the inducible concentration of LPS and Rucika KGM together.
The concentrations of IL-1α, IL-8 and TNF-α in the culture supernatant of KC and THP-1 were detected by ELISA kit. The ratio of cytokine protein concentration to the corresponding total protein content is shown in this paper.
Intracellular ROS measurement
KC were seeded at a density of 5 × 10³ cells per well in 96 well-plates. After incubation for 3 days, the cells were treated with varied concentrations of LPS for 1 h, then were labeled with 10 μM DCFH-DA for 30 min, the fluorescence intensity was measured by plate reader at 485 nm/535nm [8] .
THP-1 were seeded at a density of 5 × 10⁵ cells per well in 24 well-plates. After 24 h, the cells were treated with varied concentrations of LPS for 1 h, then were added with 10 μM DCFH-DA for 30 min, the fluorescence intensity was measured by plate reader at 485 nm/535nm.
To test the anti-inflammatory effect of Rucika KGM, KC or THP-1 should be treated with Rucika KGM for 24 h before LPS treatment, and the staining method is the same as described above.
Statistical analysis
The data for all experiments shown are the means of three assays in a single experiment and presented as the means ± standard deviation (SD). The results were analyzed using t-test to determine any significant differences. Differences were considered significant with the following P values: *P < 0.05; **P < 0.01; ***P < 0.001.
3. Results
The cell viability of KC and THP-1 stimulated with LPS
Cell viability assays were performed to determine LPS concentrations that were not cytotoxic to KC and THP-1.
After 0.01 - 100 µg/mL LPS treatment, the cell viability of KC were around (all above) 80% of NT group (Figure 1(a)) and the cell viability of THP-1 were around (all above) 90% of NT (Figure 1(b)).
![]()
Figure 1. The cell viability of KC (a) and THP-1 (b) stimulated with 0.01 - 100 µg/mL LPS. 0.01 - 100 µg/mL LPS didn’t show high cytotoxicity to KC and THP-1 (Statistical analysis with NT, *P < 0.05; **P < 0.01).
These results represented that LPS in the concentration range of 0.01 - 100 µg/mL didn’t show high cytotoxicity to KC and THP-1, so these concentrations can be used in subsequent experiments.
The inflammatory cytokine expression of KC and THP-1 stimulated with LPS
After determining the concentration range of LPS without cytotoxicity, the effects of LPS on several important inflammatory factors closely related to skin inflammation (including IL-1α, IL-8, TNF-α and ROS) in KC and THP-1 were studied and compared.
The IL-1α expression of KC and THP-1 stimulated with LPS
Compared with NT group, IL-1α levels in KC were not significantly changed after 0.01 - 10 µg/mL LPS treatment, while 100 µg/mL LPS induced a 17% up-regulation of IL-1α levels (*P < 0.05). The results showed that only when the concentration reached 100 µg/mL, LPS could induce KC to produce a great deal of IL-1α (Figure 2). After treatment with 0.01 - 100 µg/mL, the level of IL-1α in KC did not change by more than 10% compared with NT group.
Besides, after treated with 0.01 - 100 µg/mL LPS, the OD value measured by ELISA experiment in THP-1 were near the blank well value (data not presented), indicating that the content of IL-1α in the supernatant was low and didn’t meet the conditions for analysis. It shows that the stimulation of THP-1 with 0.01 - 100 µg/mL LPS would not cause the change of IL-1α level. Thus, IL-1α may not be used as an indicator of THP-1 inflammatory response.
The IL-8 expression of KC and THP-1 stimulated with LPS
IL-8 level in KC fluctuated slightly in 0.01 - 1 μg/mL LPS treatment, but increased by 46% and 513% compared with NT group in 10 μg/mL and 100 μg/mL LPS treatment, respectively. The results showed that when the LPS concentration is eaqual to or greater than 10 µg/mL, the abumdant expression of IL-8 in KC could be induced, and 100 µg/mL LPS had a more obvious induction effect (Figure 3(a)).
![]()
Figure 2. The IL-1α expression of KC stimulated with 0.01 - 100 µg/mL LPS. IL-1α levels in KC were not significantly changed after 0.01 - 10 µg/mL LPS treatment, while 100 µg/mL LPS increased IL-1α levels by 17% compared with NT (Statistical analysis with NT, *P < 0.05).
![]()
Figure 3. The IL-8 expression of KC (a) and THP-1 (b) stimulated with 0.01 - 100 µg/mL LPS. (a) 0.01 - 1 µg/mL LPS had no significant effect on IL-8 level in KC, 10 µg/mL and 100 µg/mL LPS increased IL-8 level by 46% and 513%, respectively (Statistical analysis with NT, *P < 0.05; **P < 0.01; ***P < 0.001). (b) The IL-8 level showd a same magnitude increases after 0.01 - 100 µg/mL LPS treatment, up-regulated 1200% compared with NT group. (Statistical analysis with NT, **P < 0.01; ***P < 0.001)
LPS treatment at 0.01 - 100 µg/mL induced a dramatic increase in IL-8 level of THP-1, and the degree of effect was similar at all LPS concentrations in the 0.01 - 100 µg/mL range (Figure 3(b)), so 0.01 - 100 µg/mL LPS could be used to induce THP-1 to produce ample IL-8.
The TNF-α expression of KC and THP-1 stimulated with LPS
Similar to the situation with IL-1α in THP-1, after 0.01 - 100 µg/mL LPS treatment, the TNF-α level in KC was also close to the background value of the blank well (data not presented), indicating that LPS at the test concentration couldn’t cause the production of a wealth of TNF-α in KC. For this reason, TNF-α may not be used as an indicator of KC inflammatory response.
TNF-α level in THP-1 after 0.01 - 10 µg/mL LPS treatment showed a gradient increase. Compared with 10 µg/mL, the TNF-α level treated with 100 µg/mL LPS decreased slightly, but there was no significant trend. That is, the level of TNF-α in THP-1 was similar between 10 µg/mL and 100 µg/mL LPS treatment group (Figure 4). Therefore, LPS can upregulate the expression of TNF-α in THP-1 in a dose-dependently manner, and when the concentration of LPS was greater than 10 µg/mL, the induction reached a plateau.
![]()
Figure 4. The TNF-α expression of THP-1 stimulated with 0.01 - 100 µg/mL LPS. The TNF-α level in THP-1 showed a dose-dependently increase after 0.01 - 100 µg/mL LPS treatment, when the concentration of LPS was greater than 10 µg/mL, the induction reached a plateau. (*** indicates the significant difference between NT group and 0.01 - 100 µg/mL LPS treatment, P < 0.001; n.s. indicates that there was no statistically significant difference between the 10 µg/mL LPS and 100 µg/mL LPS treatment groups)
The ROS expression of KC and THP-1 stimulated with LPS
With the increase of LPS concentration, the level of ROS in KC showed an overall gradient upward trend. The ROS level in the 100 µg/mL LPS treatment group was slightly lower than that in the 10 µg/mL LPS treatment group, but there was no significant difference, this is somewhat similar to the expression of TNF-α in THP-1. It shows that the ROS level in KC is positively correlated with the LPS concentration. (Figure 5(a)).
0.01 - 100 µg/mL LPS exposure of THP-1 causes a gradient increase in ROS level, demonstrating that LPS can dose-dependently induce THP-1 to generate ROS (Figure 5(b)).
Application of LPS-induced skin inflammatory model
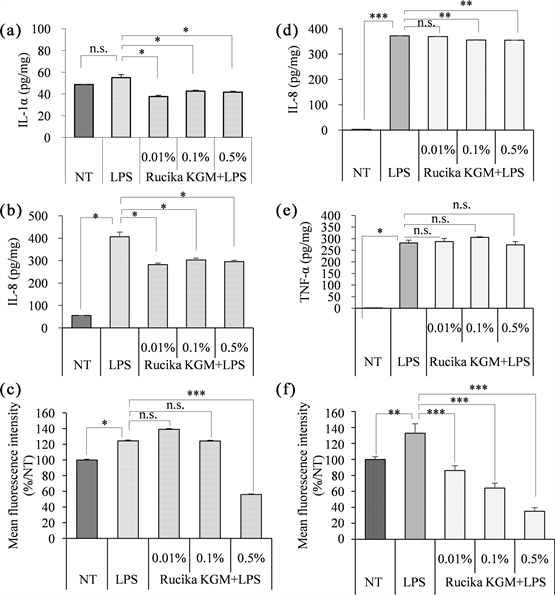
Based on the data presented above, it is recommended to induce IL-1α, IL-8, and ROS in KC cells and IL-8, TNF-α, and ROS in THP-1 cells using a concentration of 100μg/mL LPS to optimize the LPS-induced inflammation model. Subsequently, we evaluated the feasibility of this approach by conducting anti-inflammatory activity tests on the cosmetic ingredient Rucika KGM (Figures 6(a)-(f)). Rucika KGM is a mixture of extracts derived from magnolia, peony root bark, and scutellaria baicalensis root and is supplied as a cosmetic ingredient by a reputable supplier.
Cytotoxicity experiments showed that Rucika KGM had no cytotoxicity to THP-1 and KC at 0.01% - 0.5% (data not shown). When used the LPS-induced model treatment with Rucika KGM, the levels of IL-1α and IL-8 in KC were significantly decreased by 20% - 30% compared with LPS-induced group, indicating that 0.01% - 0.5% Rucika KGM could inhibit LPS-induced IL-1α and IL-8 levels (Figure 6(a), Figure 6(b)). In the ROS level detection experiment, 0.5% Rucika KGM could reduce the LPS induced ROS level in KC by 55%, while
![]()
Figure 5. The ROS expression of KC (a) and THP-1 (b) stimulated with 0.01 - 100 µg/mL LPS. The ROS level in KC and THP-1 were increased in dose-dependently manner after 0.01 - 100 µg/mL LPS treatment. (Statistical analysis with NT, *P < 0.05, **P < 0.01; ***P < 0.001; n.s. indicates that there was no statistically significant difference between the 10 µg/mL LPS and 100 µg/mL LPS treatment groups)
0.01% and 0.1% Rucika KGM showed no such inhibitory effect. (Figure 6(c)).
Rucika KGM slightly inhibited the LPS-induced increase of IL-8 in THP-1 at the concentration eaqual to or above 0.1% (Figure 6(d)). 0.01% - 0.1% Rucika KGM didn’t suppress the TNF-α level in THP-1 compared with LPS-induced group, 0.5% Rucika KGM reduced TNF-α level by 3%, but there was no significant difference (Figure 6(e)), it shows that Rucika KGM couldn`t inhibit the expression of TNF-α induced by LPS in THP-1. Besides, Rucika KGM significantly reduced the increase of ROS induced by LPS in THP-1 and present a classical dose-dependent trend. Compared with LPS-induced group, 0.5% Rucika KGM reduced ROS level by 66% (Figure 6(f)).
4. Discussion
From a perspective rooted in the biological mechanisms of skin inflammation, we have opted to integrate both keratinocytes (KC) and immune cells in our
research. Keratinocytes, serving as the outermost layer of skin cells, represent the initial line of defense against external stimuli. Upon exposure to external factors, keratinocytes can secrete a substantial quantity of anti-inflammatory factors, actively participating in the regulation of skin inflammation. On the other hand, THP-1 cells, a type of monocyte, constitute the largest immune cell population within the bloodstream and function as sentinels patrolling the body to prevent bacterial and fungal invasions. Upon stimulation by external factors, THP-1 cells can secrete inflammatory factors, initiating adaptive immune responses. Consequently, THP-1 cells are commonly employed tools in conventional inflammation research. By simultaneously investigating the impact of LPS on both KC and THP-1 cells, our study bridges the gap between research conducted at the skin cell level and that at the classical immune cell level.
In this study, we deliberately selected inflammation markers closely associated with the symptoms of skin inflammation, including inflammatory factors (TNF-α, IL-1α, IL-8) and reactive oxygen species (ROS). These markers play distinct roles within the cascade of inflammation. For instance, IL-1α is capable of recruiting various immune cells, thus promoting the development of chronic inflammation and fever symptoms [1] . IL-8 possesses the capacity to induce the local accumulation of neutrophils, resulting in increased vascular permeability and a sensation of pain [9] . TNF-α can stimulate neutrophils and lymphocytes, leading to fever, heightened endothelial cell permeability, and the synthesis and release of additional cytokines [10] [11] . Furthermore, ROS can enhance the upregulation of prostaglandin E2 (PGE2) synthesis, thereby causing skin erythema while amplifying the overall inflammatory response [12] .
Upon establishing that the influence of LPS on KC and THP-1 cell activity could be negligible, we proceeded to conduct experiments using LPS at concentrations ranging from 0.01 to 100 µg/mL. The experimental outcomes indicated that this concentration range did not result in significant alterations in the levels of IL-1α in THP-1 cells or TNF-α in KC cells. This observation can be explained by the theoretical link between the secretion of inflammatory factors and specific cell types. Research by Ankit Malik, Giuseppe Malleo, and others suggests that IL-1α is primarily expressed in epithelial cells, endothelial cells, and stromal cells, while TNF-α is predominantly secreted by mononuclear cells or macrophages [13] [14] . Our findings align with these studies. Therefore, when conducting related research, it may be advisable to omit the measurement of these two inflammatory factors.
Concerning the experimental results for KC, it was observed that substantial induction of IL-1α in KC cells only occurred when LPS reached a sufficiently high concentration (100 µg/mL, as described in this study). Both 10 µg/mL and 100 µg/mL of LPS induced a notable increase in IL-8 levels in KC cells, with the latter exhibiting a more pronounced effect. As for ROS levels, concentrations of 0.01 to 100 µg/mL LPS induced a dose-dependent increase. Consequently, when inducing an inflammatory response in KC cells using LPS, the experimental conditions can be categorized into four different groups, each corresponding to the selection of an appropriate LPS concentration. For the measurement of IL-1α levels in KC cells, induction with 100 µg/mL LPS is recommended. For assessing IL-8 levels in KC cells, both 10 µg/mL and 100 µg/mL of LPS are viable choices, with the latter providing a more pronounced induction effect. When measuring ROS levels in KC cells, although the concentration range of 0.01 to 100 µg/mL of LPS is technically feasible, induction with 100 µg/mL of LPS is still recommended. This is because the experimental method of measuring ROS content using the DCFH-DA fluorescence probe is susceptible to various factors, especially substantial fluctuations in fluorescence measurements. Due to potential biases in certain experimental details, using lower LPS concentrations for induction may result in imprecise experimental results. Lastly, when there is a need to simultaneously measure the expression of IL-1α, IL-8, and ROS in KC cells, the use of 100 µg/mL of LPS is strongly recommended as it aids in inducing these proteins more comprehensively and prominently.
The effects of LPS on the inflammatory factors in THP-1 cells yielded different results. LPS exhibited an equipotent and particularly significant impact on IL-8 levels in THP-1 cells, while it showed typical dose-dependent induction effects on TNF-α and ROS levels. Therefore, if the sole objective is to measure the expression of IL-8 or TNF-α in THP-1 cells, the use of 0.01 to 100 µg/mL of LPS is sufficient to meet experimental requirements. When assessing ROS expression in THP-1 cells, inducing with 100 µg/mL of LPS is the wiser choice. Likewise, when there is a need to simultaneously measure the expression of IL-8, TNF-α, and ROS in THP-1 cells, the use of 100 µg/mL of LPS is strongly recommended.
The recommended LPS-inducing concentrations for different experimental requirements are summarized in Table 1.
We have distilled the above findings into a recommended model. This model prescribes the use of 100 μg/mL LPS for inducing KC and THP-1 cells, while simultaneously evaluating the levels of IL-1α, IL-8, and ROS in KC, as well as IL-8, TNF-α, and ROS in THP-1 cells.
Subsequently, we employed this model to assess the anti-inflammatory efficacy of a cosmetic ingredient (Rucika KGM). Our research indicates that Rucika KGM exerts inhibitory effects on the expression of IL-1α, IL-8, and ROS in KC cells, as well as IL-8 and ROS in THP-1 cells. Rucika KGM primarily mitigates immediate symptoms of inflammation, such as fever and stinging, by downregulating the expression of IL-1α and IL-8. Furthermore, it effectively reduces chronic inflammation caused by oxidative stress by inhibiting ROS levels. These results align perfectly with the "immediate soothing effect" findings obtained from human efficacy trials conducted by the raw material supplier. This underscores the rapid screening capabilities of our model for identifying cosmetic ingredients with anti-inflammatory properties in a fast and comprehensive manner.
There is a schematic diagram of LPS-induced skin inflammation model summarized based on the data of this study and the way Rucika KGM exerts anti-inflammatory effect (Figure 7).
![]()
Table 1. The recommended LPS-inducing concentrations for different experimental needs.
![]()
Figure 7. Schematic diagram of LPS-induced skin inflammation model. The inflammation model developed in this paper studied KC on the skin surface and monocytes inside the skin (THP-1 was used to simulate monocytes in vitro). First, after LPS stimulation, KC secretes copious IL-1α, IL-8 and ROS. The up-regulation of IL-1α in KC and exogenous LPS can stimulate THP-1 in the blood vessels of skin to secretes quantities of IL-8, TNF-α and ROS. IL-1α, IL-8, TNF-α and ROS can cause skin inflammation symptoms such as fever, pain, increased vascular permeability and erythema, respectively, and can recruit other immune cells to amplify the inflammatory response. However, Rucika KGM can reduce the secretion of IL-1α, IL-8, ROS in KC and the secretion of IL-8, ROS in THP-1, indicating that Rucika KGM mainly relieves the inflammatory symptom of fever, pain, erythema.
However, skin inflammatory is an intricate physiological process involving the participation of a variety of cells and inflammatory factors. For example, in addition to keratinocytes, other skin-resident cells (Langerhans cells, melanocytes, mast cells, and macrophages) also secrete cytokines involved in local immune regulation. Future work is demanded to obtain more accurate experimental results by further simulating the inflammatory response of the skin from the perspective of different cells, different factors, etc.
In conclusion, this study has optimized the LPS-induced inflammation model from various perspectives, including cell types, induction concentrations, and the selection of inflammatory factors. In contrast to traditional inflammation models, this study comprehensively assesses the inflammatory response by incorporating skin cells (KC) and monocytes (THP-1). The chosen inflammatory factors are directly relevant to redness, swelling, heat, and pain, making them suitable for marketing claims and consumer education. Additionally, this model, which employs enzyme-linked immunosorbent assay to measure characteristic markers closely associated with inflammatory symptoms, offers simplicity of operation, cost-effectiveness, and relatively comprehensive coverage of anti-inflammatory targets. It can serve as a valuable tool for cosmetic companies to rapidly conduct initial screening of effective anti-inflammatory ingredients.
Acknowledgments
This study was supported financially by the OSM Biology Co., Ltd.