Influence of Some Climatic Elements on the Growth of Two Experimental Varieties of Peanuts from the Bagarine Community Center in Ouaddaï (Chad) ()

1. Introduction
The history of the rural world is combined with that of the climate. Years of high or low harvests are traditionally associated with extreme climatic conditions [1] . Studies on the functioning of terrestrial ecosystems, their possible modifications and their adaptations to climate and human changes, as well as the effects and impacts of these modifications on biotic resources, have an important place in current research. These interactions are particularly interesting in fragile ecosystems. The relationships between agricultural production and climate have even been used for the reconstruction of ancient climates. Thus, harvest dates provide information on annual temperature variations. And variations in the width of tree rings make it possible to understand climatic variations. Very naturally, research has therefore been concerned since the first IPCC publications with the consequences of climate on agrosystems. Indeed, climate affects plant growth through the modification of numerous environmental factors as well as the yield of cultivated plants. In certain ecosystems, species grow close to their limits of tolerance in relation to climatic factors, we observe responses of vegetation to these climatic changes, over the last decades: evolution of the limits and areas of forest formations, increase in biomass, modification of biodiversity, among others [2] [3] . The main effects are, among others, the increase in CO2 content, the increase in temperature, and the increase in the frequency and intensity of extreme weather events. The consequences on plant growth are variable and observable depending on the climatic parameters observed. These consequences can be reproductive development, reduction or increase in plant sizes, etc. For this study, the parameters concerned are the rainfall and temperature observed during the development period of two varieties, namely the local variety called “soudani” and the improved variety Fleur 11 obtained from the varieties monitored by the Chadian Institute of Agronomic Research (ITRAD). The present study aims to evaluate the impact of climate elements on the development of two plant varieties (Soudani and Fleur 11) being tested in the Bagarine Center in order to understand if one of them is more resilient to climate variability. in this Sahelian part of Chad.
2. Study Methodology
2.1. Presentation of the Experimentation Center
The Bagarine Community Learning Center is located in the Ouaddaï province, in the Sahelian zone of the country. It was created by the World Food Program 2018 and scientific supervision was entrusted to the Adam Barka University of Abéché. This 13-hectare center is divided into two compartments: one compartment is reserved for logistics (5 hectares) and the other for resilience (8 hectares) where participants belonging to six cooperatives from six villages in the area of influence of the center are trained. These are: Bagarine, Khoumi, Arboudji, Mandafana, Atilo and Aldjazira. The Center is located to 6 km north of the town of Abéché (latitude: 13˚52'0.235"N; longitude: 20˚49'4.277"E) (Figure 1). The objective of the Center is to promote community learning through various horticultural activities (arboriculture, market gardening, floriculture) through the introduction of productive technological innovations and to strengthen the capacities of farmer organizations by transferring knowledge to them. It is done through practical training (Photography 1). 200 participants
![]()
Figure 1. Presentation of the study area.
belonging to 6 cooperatives from 6 villages located in the rural area of the town of Abéché are among the direct beneficiaries of the Center.
2.2. Methods
For this study, two types of data were used: climate data obtained at the Abéché station and field data obtained through monitoring the development of plants and their characteristics. The climate data used includes daily rainfall and average daily temperatures for the monitoring period of 2021. For monitoring varieties, we followed the randomized complete block system set up by the Bagarine Community Center. For this, the definition of a precipitation height threshold from which we can consider that the day is dry is necessary. This study, which generally focuses on the adaptation of peanuts to the behavior of certain climatic elements, a threshold of 5 mm was retained, in order to take into account, the daily needs of the plant and the losses linked to evaporation [4] . For plant behavior linked to the high temperature in the region, the thermal scalding index was used. This involves assessing the frequency of high temperatures during the plant growing season. It corresponds to the number of days, on an annual basis, where the daily maximum temperature is higher than a given temperature, depending on the crop and phenological stage. Considering the phenological stage of the plant, these high temperatures can cause abortion of growing plants or water stress if water availability is limited. Developmental delays are also reported in some crops. Indeed, plants are sensitive to the thermal “scalding” phenomenon which is an accident in plant growth due to high temperatures. It is accepted that scalding occurs at a temperature of 25˚C.
The growth of the characteristics of the varieties studied was monitored through experimental plots contiguous to each other (same spacing between rows) and arranged in three rows. Each variety is sown on 10 lines of 13 m long and 5 m wide corresponding to a plot or an area of 76 m2. The sowing method must respect the average spacing of 60 cm between the lines and 15 cm between pockets on the line. Thus, each Fischer block was made up of 3 experimental plots with an area of 10 lines of 13 m each where the three (3) central lines formed the useful plot. Five (5) plants were selected on each useful line for observation purposes. The trial was conducted from July to September 2021, i.e., 4 months.
Monitoring consisted of evaluating the vegetative and production parameters which is done at the end of each week.
- Determination of emergence percentage
The emergence percentage is a measure of the evolution of germination time and is generally expressed as a percentage. It allows us to assess the germinative capacity of a seed. This evaluation consisted of counting the number of seedlings emerged in the field for each variety after sowing.
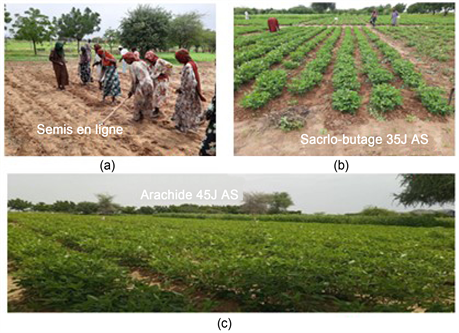
Photography 1. Variety development phase: (a): Row sowing operations, (b): Weeding of the fields, (c): State of flowering of the varieties.
- Determination of the duration of appearance of the first flower after sowing
The duration of appearance of the first flower after sowing was determined after daily observations on the experimental plot; until the very first flower appears in the elementary plots of each variety. Thus, we have the number of days at which this first flower appeared as the period of beginning of flowering of the variety.
- Determination of the population density per hectare
The population density was determined by counting the plants raised on the plots of each variety.
- Determination of the diameter at the collar
The caliper allowed us to measure the diameter at the collar for the plants in the useful plot.
- Determination of the average number of pods per plant
The determination of the average number of pods per plant was carried out by counting the ripe fruits on the plants of the useful plot of each variety after having husked them and taking the average. The number of pods per plant is one of the parameters that integrates the components that make it possible to evaluate yield [5] .
- Determination of the weight of 100 pods and 100 seeds per variety
The pods and seeds were first dried beforehand. The weight of 100 pods and 100 seed-seeds were determined by counting and weighing using a branded precision balance. The hundred pods were chosen at random. These two observations are yield components and specific characteristics of the varieties.
- Determination of the yield in wet and dry aerial and underground biomass of each variety.
The yield in wet and underground aerial and underground biomass makes it possible to assess the productive quality of each variety in these elements. The determination of the aboveground and belowground wet biomass yield of each variety was carried out after weighing using a TOSHIBA brand precision electronic sensitive balance. These parameters make it possible to assess the productive quality in dry and wet matter of the varieties. At the end of the campaign, the production of each of the plots was weighed, and the yields (kg) for each of the experimental units were determined using the following formula: Production of the plot (Kg) Yield = Area of the plot (m2).
2.3. Statistical Analysis
At the end of the season, the data were entered in Excel, then analyzed with SPSS (Statistical Package for the Social Sciences) software and the indices were deduced. The graphs are constructed with the Excel spreadsheet.
3. Results
3.1. Climatic Indices Explaining the Development of Varietie
Frequencies of dry periods detrimental to plant development Daily rainfall data were accumulated by week to understand the stages of development of the varieties. In fact, an average rainfall is less important than cumulative rainfall for a farmer since the water needs of a plant differ depending on the stage of its development. The modeled variable is the weekly cumulative rainfall during the year 2021.
Figure 2 shows the rainfall fluctuations during the observation season (2001). This rainfall distribution is disparate and varies from one week to another. It indicates that the evolution of the weekly rainfall values of the said locality is disparate. From 3.05 millimeters in the first week of June, it reached 89.92 mm in the first week of August before dropping to 1.02 mm in the second week of August to remain almost stationary in September. To corroborate the low rainfall values, we wanted to understand the xeric character of the climate through the xerothermic index based on the definition of the “dry month” and on the duration of the dry season. For this, we determined the Bagnouls and Gaussen ombrothermal diagram which allows us to differentiate between the wet and dry period. “A dry month is one where the monthly total precipitation (P) expressed in millimeters is equal to or less than twice the monthly average temperature (T), expressed in degrees centigrade: P ≤ 2T [6] . Therefore, a month is considered dry when the temperature curve (T) is greater than that of precipitation (P, with P = 2T). In our case, the diagram specifies that only the first week of August is rainy and the rest of the season is characterized by rainfall which remains below the temperature (Figure 3).
For the determination of prolonged dry sequences, the “onset-offset” index was used. This index developed by [7] based on the [8] method was used to determine the number, duration and period of dry sequences. This index is calculated
![]()
Figure 2. Rainfall in july-august 2021 at the Bagarine meteorological monitoring station.
![]()
Figure 3. Ombrothermal diagram of Bagnouls and Gaussen, Abéché station of 2021, 1˚C = 2 mm.
from daily precipitation data, the following equation: The cumulative anomaly (A) is calculated from the sum of the differences between the daily precipitation value (R(n)) and the value average precipitation (R) taking into account all days of a specific period (calendar year for example). An agronomic dry sequence for a given period is the maximum number of consecutive days without “useful” rain for the plant. For this, the definition of a precipitation height threshold from which we can consider that the day is dry is necessary. For this study a threshold of 5 mm was chosen, in order to take into account, the daily requirement of the plant and the losses linked to evaporation [4] .
It appears that of the 22 rainy events, dry sequences represent 72.7% compared to wet frequencies (Table 1). Indeed, the number of dry spells was on average 16 for the 2021 campaign; which is consistent with what was obtained in the Sahelian zone of Niger by [9] which indicate the dry sequences are increasing in the Sahelian zone because they went from 6 days before 1979 to 16 in 2000. For these authors, the dry sequence occurring just after the emergence of millet can be favorable for the development of the plants if it is not too long but, in our case, we realized that these sequences are observed even during the growth of the plants and this can have repercussions on the productivity of the plants. This dry sequence index cannot alone explain the frequency of days affecting the growth of the two peanut varieties and this is why we used the thermal scalding index to indicate the impact of temperature on this growth. Calculating the number of hot days simply consists of counting, between the two dates selected, the days where the maximum daily temperature is greater than or equal to 25˚C (Table 2).
We realize that the number of days where the temperature exceeds 25˚C is four (4) times higher than those where it is below 25˚C; reflecting the severe nature of the temperatures in this region even if the rains intervene to mitigate their effects. Although the observations and modeling must be put into perspective
![]()
Table 1. Comparison of dry and wet periods in July-August 2021 at Bagarine station.
Source: Rainfall data 2021.
![]()
Table 2. Number of hot days in the observation period.
NB: T = temperature, Nber = number. Source: Temperature july-august 2021. Source: Temperature data for the year 2021 at the Abéché station processed under SPSS.
with caution, these values reflect the plausible impact of temperatures on plants because the increase in hot days affects the development of annual crops.
3.2. Vegetative Characteristics Affected by Climate Elements Emergence Rate
Emergence began 4 days after sowing for the two peanut varieties studied.
Table 3 shows that 4 days after sowing, the emergence rate was different depending on the varieties. The improved variety recorded a higher emergence rate of 95.21% than the local variety of 63.25%. This difference is significant at the threshold of p = 0.05. These results could be explained by the fact that the seed of the local variety presents unselected seeds.
These results are superior to those obtained by [10] in Côte d’Ivoire for other peanut varieties.
Furthermore, in our tests, germination was epigeal. At the time of the various sowings the humidity and temperature conditions were good for germination. The proof is that we obtained a germination rate of 95.21% 4 days after sowing for the improved variety F11.
3.2.1. Phenology of the Varieties Studied
The start of flowering for the improved variety F11 occurred less than or equal to 21 DAS and that of the local variety at 35 DAS.
Table 4 shows the results relating to the appearance of flowers of the peanut varieties studied. Thus, on the 21st day after sowing, 50% of the shoots of the F11 variety bear flowers while it is necessary to wait until the 35th day for 50% of the shoots of the Soudani variety to produce flowers. This shows a very highly significant difference at the threshold of P = 0.05. We found that flowering is quantitatively dependent on precipitation and continues until the end of the vegetation but the flowers produced towards the end do not have time to produce ripe fruits at harvest.
3.2.2. Plant Height
Figure 4 summarizes the average value of peanut growth for the two varieties tested in compliance before the amount of rain recorded and the number of weeks of monitoring.
The graph indicates that as we record rains, the varieties observed grow but this growth can be slowed down in case dry sequences are observed. This is why
![]()
Table 3. Monitoring the emergence of the two varieties after 4 days of sowing.
Source: Monitoring carried out by Djallah Hissein July 2021.
![]()
Table 4. Monitoring the appearance of flowers in the two varieties studied.
Source: Monitoring carried out by Djallah Hissein July 2021.
![]()
Figure 4. Growth in height of plants according to the weeks of monitoring, Source: Field monitoring data 2021.
![]()
Figure 5. Cumulative rainfall interaction and growth of varieties.
between the 5th and 7th week of observation the level of the curve has a lower slope; however, the humidity of the soil means that the fall is not sudden. This sequence occurring between the 5th and 7th week could impact plant growth if in terms of duration it is longer. In any case, the local variety pays the price during all stages of plant growth since its growth remains inferior to the improved variety. However, we notice that it seems to be less affected by dry sequences compared to the improved variety which seems to require more water. Cumulative annual rainfall is an essential factor in plant growth because the more rain we record, growth is maintained even if the duration of the sequences is detrimental to them (Figure 5). These plant behaviors linked to rainy events remain indicators allowing farmers to decide on the direction to give to their agricultural production.
4. Conclusion
In this work, we set out to evaluate the impact of some climate elements on the agronomic performances of a promising variety of peanut from the research environment (Flower 11) and a local variety (Soudani) in the agro-ecological conditions of the Bagarine Community Learning Center. To achieve this, a Fisher device was adopted. This study made it possible to realize that communities in the western zone of Niger are aware of the main climatic risks in rainfed agriculture. Three most frequent and most pernicious agroclimatic risks emerge for the two varieties of peanuts monitored. These risks are the frequencies of dry sequences, thermal scalding and long dry periods which affect the growth of plants which are sometimes very sensitive or less. However, the frequency of dry spells and thermal scalding impacting agricultural production in recent years have not allowed communities in this area to obtain agricultural yields beyond their expectations. The direct impacts of these risks revealed include seeding failure, loss of quality seeds and loss of crops. Faced with this, the main strategy that producers must adopt is the use of adapted varieties. This strategy can prove to be a source of hope if the communication and use of climate information is put forward. The use of this type of information can be useful to farmers since it can contribute to optimizing their agricultural practices through adequate choices of sowing dates and suitable varieties. This will also allow the adoption of new techniques for reducing crop yields. The impact of water deficits on the growth and development of rainfed crops in the region.