Optimisation of a Renewable Energy System for Rural Electrification ()
1. Introduction
Renewable Energy Sources (RESs) do not include fossil-based resources but instead include wind, solar, marine, hydro, and bioenergy [1] [2] [3]. RES can be used in each node of the supply chain: supply, production, distribution, demand, and reverse logistics; and it can be converted to fuels, electricity, heat (power), chemicals, or food [2]. Ellaban et al. define renewable energy sources as energy sources that are continually replenished by nature and derived directly or indirectly from the sun or from other natural movements and mechanisms of the environment (such as geothermal and tidal energy) [3].
Currently, the majority of the world’s energy derives from conventional sources such as natural gas, oil, and coal [3] [4] [5]. However, fossil fuel-based energy is prone to price fluctuations, the resources are limited [4], and stakeholders expect focal companies to mitigate their extensive use of non-sustainable energy [6]. Though conventional energy sources are primary sources due to accessibility and amplitude [5], a change is evident and needed as the global need for energy is estimated to continuously grow [4] [7] [8]. Despite the fact that the global energy sector is exceptionally complex and challenging to balance due to economic, environmental, political, and social dynamics [9], the use of renewable energy sources has grown, and for example, in 2017, 17.5% of the energy consumed in the EU was derived from renewable energy sources [10].
Apart from the ability to generate energy in remote areas, renewables possess several other advantages namely:
1) They are non-polluting due to their low or nearly zero greenhouse emission.
2) With proper planning and infrastructure in place, renewables offer a reliable source of energy.
3) They are sustainable.
4) Maintenance for renewable energy facilities could be less expensive as compared to traditional generators.
Renewable energy offers the much-needed flexibility needed in power generation leading to a reduction in the dependence on fossil fuels [11].
Despite Uganda’s vast renewable energy potential, the performance of the power sector in Uganda has been going through fluctuating and insufficient power generation. The sole dependence on hydropower for electricity in Uganda has significantly contributed to its energy problems with increasing climatic changes.
The digesters are increasingly being used on rural farms and incorporate energy cogeneration, forming biomass waste into energy conversion systems. Some dairy farms in Canada and the USA use these biomass waste-to-energy conversion systems to manage the disposal of manure and mitigate odour. These farms did not previously pay for manure disposal, but spread the manure on the land or stored it in lagoons for extended periods. This caused a bad odour and attracted flies, resulting in complaints from neighbours. Anaerobic digestion of the manure in a biomass waste-to-energy conversion system is an alternative method of manure disposal. The biogas produced by these systems is combusted to generate electricity and heating.
The capital cost of a biomass waste-to-energy conversion system is very high. Gordondale Farms with 850 dairy cows paid USD 520,000 [12], Stencil Farm with 1000 cows paid USD 500,000 [12] and New Horizons Dairy with 2000 cows paid USD 1,526,000 [12] for their biomass waste-to-energy conversion systems. These costs are prohibitive to farmers with small herds whose primary concern is to dispose of manure. In addition, there are problems faced by existing systems due to poor sizing and operation. The challenge is to maximise the revenue of these systems to cover their high capital cost, besides providing another revenue source for the farms. Revenue is obtained from the sale of electricity to the grid and from food waste tipping fees. The farms’ costs are also reduced by avoiding the use of electricity from the grid and the use of propane for heating. By-products of the biomass waste-to-energy conversion system can also be used as animal bedding after further processing. This is also a cost-saving.
The objective of the optimisation being carried out is to determine the maximum revenue that can be obtained from these systems, for a given number of cattle. Revenue is maximised by optimal sizing and operation of the system. This minimises the production of excess biogas and also reduces capital costs and the payback period. Maximisation of revenue from such a system will be a result of savings from avoided usage of grid electricity, revenue from selling electricity to the grid and savings from reduced heating costs. A Tabu Search technique is used for the optimisation. In [13], mixed integer linear programming was used to optimise the utilisation of waste heat from industries. An evolutionary strategy was used to determine the optimal choice of compressor power ratings, effluent mass flow rate and volume of storage tanks in a heat pump system in [14]. In [15], genetic algorithms and sequential quadratic programming were used to optimise a multi-biomass tri-energy supply system. In [16], the energy production process for a biomass-based system was optimised using mixed integer linear programming and mixed integer non-linear programming. The Tabu Search technique was chosen for two reasons: 1) the biomass waste-to-energy conversion system has a very large solution space and 2) the system is complex and computationally demanding. Variables that impact on the objective function are used, in the optimisation. The solution space has a total of 1,261,656 variables. Although the variables are discrete, the problem cannot be solved by enumeration of potential solutions due to a large number of combinations of variables. In addition, the optimisation problem being solved is a non-linear constrained problem. The system comprises of functions used to determine the electricity and heat generated. The problem is computationally complex and has many local optima. The problem is therefore better suited to a heuristic approach to problem-solving [17]. The choice of which heuristic to use was between population-based heuristics like 56 genetic algorithms, and trajectory-based heuristics like Tabu Search. In population-based heuristics, a whole set of solutions is updated simultaneously, whereas in trajectory-based heuristics single solutions are evaluated and updated [17]. Population-based heuristics are more efficient with regard to exploring the whole space [17], however, they are computationally expensive. Trajectory-based heuristics are more suited to computationally demanding problems. The Tabu Search technique was chosen in particular because it is good for exploring a discrete search space with a finite set of neighbouring solutions [17]. This is the case for the optimisation problem being solved.
The Study Area
Maddu is a town in Gomba district in the Central region of Uganda. The town is approximately 30 kilometres (19 mi), by road, northwest of Kanoni, the site of the district’s headquarters [18]. The town is approximately 128 kilometres (80 mi) west of Kampala, the capital and largest city of Uganda [19].
Maddu is an agricultural community and Livestock forms the backbone of economic activity in the area. Milk and meat are important products produced by medium and small-scale farmers in the area. The produce is sold locally in the popular Friday cattle markets and also marketed to Kampala. Prominent farms and ranches are located in areas of Kilasi (Katende Farm, Bitali family ranch), Kisozi YK Museveni farm and more towards Sembabule on one side, Buyanja and Kyayi on the other side.
Located at an elevation of no meters (0 feet) above sea level, Maddu has a Tropical rainforest climate (Classification: Af) [20]. The coordinates of Maddu are 0˚12'58.0"N 31˚40'02.0"E (Latitude: 0.216111; Longitude: 31.667222) [20]. The district’s yearly temperature is 22.55˚C (72.59˚F) and it is −0.92% lower than Uganda’s averages [20]. Maddu typically receives about 181.36 millimeters (7.14 inches) of precipitation and has 240.08 rainy days (65.78% of the time) annually [20]. Annual high temperature is 25.74˚C (78.33˚F), Annual low temperature is 17.5˚C (63.5˚F), Average annual precipitation is 181.36 mm (7.14 in), Warmest month is February (27.81˚C/82.06˚F), Coldest Month is June (16.57˚C/61.83˚F), Wettest Month is November (337.67 mm/13.29in), Driest Month is July (44.71 mm/1.76in), Number of days with rainfall (=1.0 mm) 240.08 days (65.78%), Days with no rain = 124.91999999999999 days (34.22%), Humidity is 72.45% [21].
2. Description of the Cattle Waste-to-Energy Technology
The system model consists of a digester, a lagoon, an internal combustion engine, an induction generator, a boiler, a propane tank, a heat exchanger and the electricity grid. The source of biomass waste is cattle manure. Manure is stored in a lagoon that allows for variation of flow into the digester. Biogas is generated from the anaerobic digestion of the manure in the digester and combusted in an internal combustion engine to generate torque. The torque is applied to an induction generator to produce electricity. Some of the biogas generated is combusted in a boiler to produce heat. The exhaust heat from the internal combustion engine is captured by a heat exchanger. A propane tank is included in the system to provide a backup fuel supply. This is in the event that biogas generated is insufficient to run both the generator and the boiler, to meet the heating demand. The electricity grid connection is included since excess electricity can be sold to the grid or electricity can be obtained from the grid. The digester requires heating, which is obtained from the system. The following is a description of the modeling of the components of the biomass waste-to-energy conversion system. The model is based on a completely stirred reactor with a single input and output waste stream and a constant liquid volume with gas above it.
A mass balance of the components is carried out. The mass balance is the rate of mass change of the components [22] [23]. The mass change occurs as a result of the biochemical and physico-chemical reactions. The structure has two extracellular steps: disintegration and hydrolysis, and three intra-cellular steps: acidogenesis, acetogenesis and methanogenesis.
There are 19 biochemical reactions, designated by j. Reactions j = 1, 2, 3, 4, are disintegration and hydrolysis reactions and
, are acidogenesis, acetogenesis and methanogenesis reactions. The mass balance of the substrates in the liquid phase [23] [24] [25] is calculated by:
kgCOD/m3/day,
for
,
(1)
where Sliq is the concentration of the component in the digester, qin is the volume flow rate of manure going into the digester, Sin is the concentration of the component going into the digester, qout is the volume flow rate of the effluent leaving the digester, Vliq is the volume of the digester, ρ is the kinetic rate of the reaction and v is the stoichiometric coefficient of the reaction. kgCOD/m3 is the chemical component base unit used to model the anaerobic digestion process. COD (Chemical Oxygen Demand) is the mass of oxygen required to completely oxidise a given organic compound. The calculation of the stoichiometric coefficients v of the different reactions is detailed in [24]. The kinetic rate ρ depends on the type of reaction. The kinetic rate of the disintegration and hydrolysis reactions [26] is calculated by:
kgCOD/m3/day,
for i= 13, 14, 15, 16 and j = 1, 2, 3, 4,
(2)
where ρ is the kinetic rate of the reaction, k is the first order rate coefficient of the reaction and X is the concentration of the active biomass component. In [24], the substrate concentrations were obtained from experimental work and the rate coefficients were obtained from both experimental work and literature review [27] [28] [29].
The kinetic rate of the acidogenesis, acetogenesis and methanogenesis reactions is calculated by:
kgCOD/m3/day,
for
, and
,
(3)
for
kgCOD/m3, (4)
where ρ is the kinetic rate of the reaction, km is the maximum specific rate of substrate utilisation, S is the concentration of the waste component, K is the concentration giving half the maximum rate of utilisation of the component, X is the concentration of active biomass in the component, I1 is hydrogen inhibition, I2 is free ammonia inhibition and I3 is pH inhibition. In [24], the concentration of the active biomass and the substrate were obtained from both literature review and experimental work.
The half-saturation coefficient and the maximum specific rate of substrate utilization used in [24] were also obtained from literature review [27] and experimental work.
The mass balance equation [22] for the gas phase is:
kgCOD/m3/day, (5)
where Sgas is the concentration of the biogas component, qgas is the volume flow rate of biogas from the digester, Vgas is the volume of the gas headspace in the digester, ρT is the kinetic rate of the liquid-gas transfer reaction of the biogas component and Vliq is the volume of the digester. The kinetic rates of the liquid-gas transfer reactions for hydrogen, methane and carbon dioxide are calculated by:
kgCOD/m3, (6)
kgCOD/m3, (7)
kgCOD/m3, (8)
where
,
and
are the kinetic rates of the liquid-gas transfer reactions of hydrogen, methane and carbon dioxide respectively, kL is the overall mass transfer coefficient, a is the specific transfer area,
,
and
are the concentrations of hydrogen, methane and carbon dioxide respectively,
,
and
are the Henry’s law coefficients of hydrogen, methane and carbon dioxide respectively and
,
and
are the partial pressures of hydrogen, methane and carbon dioxide respectively. The mass balance equation of the gas phase calculates the volume flow rate of biogas produced. The internal combustion engine model requires the mass flow rate of biogas, the air-fuel ratio of biogas and the lower heating value (LHV) of biogas in order to calculate torque output. The volume flow rate of biogas, qgas is required to solve the differential Equation (5). This is calculated by:
m3/day, (9)
where qgas is the volume flow rate of biogas, kp is a pipe resistance coefficient, Pgas is the pressure of biogas and Patm is atmospheric pressure. The mass flow rate of biogas is calculated from the density and the volume flow rate of biogas. The density of biogas is calculated by:
kg/m3, (10)
where ρgas is the density of biogas, Mgas is the molar mass of biogas, Pgas is the pressure of biogas, R is the universal perfect gas constant and Tbiogas is the temperature of biogas. The pressure of biogas is the sum of the partial pressures of hydrogen, methane, carbon dioxide and water vapour, which are calculated by:
bar, (11)
bar, (12)
bar, (13)
where
,
and
are the partial pressures of hydrogen, methane and carbon dioxide respectively,
,
and
are the concentrations of hydrogen, methane and carbon dioxide respectively, R is the universal perfect gas constant and Tbiogas is the temperature of the biogas. The partial pressure of watervapour is calculated by:
bar, (14)
where
is the partial pressure of water vapour and Tbiogas is the temperature of the biogas. The molar mass of biogas (Mgas) is required to calculate the density of biogas and is given by:
kg/mol,
(15)
where Mgas is the molar mass of biogas,
,
,
and
are the molar masses of methane, carbon dioxide, hydrogen and water vapour respectively,
,
,
and
are the partial pressures of methane, carbon dioxide, hydrogen and water vapour respectively, and Pgas is the pressure of the biogas. The second input required for calculation of the torque output is the air-fuel ratio of biogas. This is calculated by:
(16)
where AF is the air-fuel ratio of biogas,
is the partial pressure of methane,
is the partial pressure of hydrogen, Mair is the molar mass of a standard composition of dry air, Pgas is the pressure of biogas and Mgas is the molar mass of biogas. The third input required for the calculation of the output torque, the LHV of the biogas is determined from the heat of combustion of the reactants in the digester:
kJ/kg, (17)
where LHVgas is the Lower Heating Value of the biogas, hrpo is the total heat of combustion of the gases at standard conditions, ΔHp is the enthalpy change of the manure from standard temperature to the operating temperature of the digester, ΔHgas is the enthalpy change of the biogas from standard temperature to the temperature of the biogas, ΔHair is the enthalpy change of air from standard temperature to the operating temperature of the digester and Mgas is the molar mass of the biogas.
3. The Tabu Search Algorithm
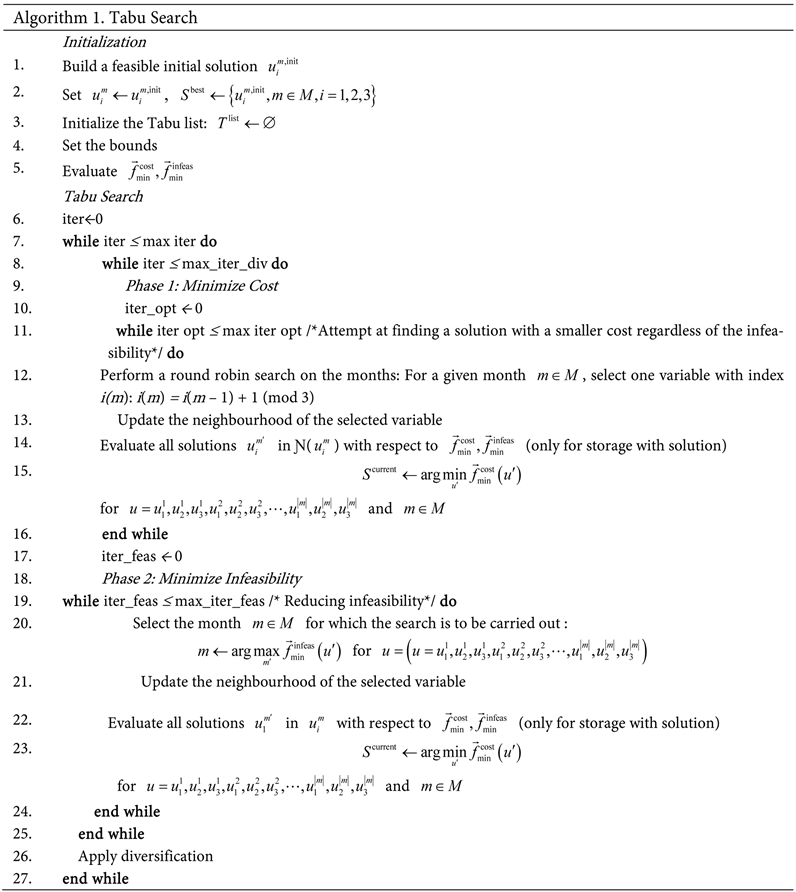
This section describes the adaptations of the Tabu Search algorithm developed for optimisation of the cattle Waste-to-Energy Technology (WET). The Tabu Search is described in Algorithm 1. The notation and the parameters of the Tabu Search are given in Table 1 and Table 2 respectively. Four aspects of the Tabu Search have been developed for adaptation to the problem being solved. These are: use of the Pareto optimal front method to evaluate the multi-period and multi-objective function, constraints handling, the multi-period optimisation strategy and the diversification strategy. This section describes the adaptations developed.
![]()
Table 2. Parameters of the Tabu Search.
3.1. Inputs of the WET for Determination of Maximum Revenue
The following is an explanation of how the inputs to the WET were determined. The inputs of the WET are: number of cattle, n, electricity demand,
, heating demand,
, and volume flow rate of manure from the livestock,
, for
.
A number of cattle, n, were selected from a typical dairy farm [34]. The volume flow rate of manure from the livestock, vin, was calculated from the volume flow rate of manure produced per animal [35]. The electricity demand
, was also obtained from the typical dairy farm [34].
The heating demand
includes the heating demand of the farm and the digester. A monthly heating demand profile of the farm is generated based on the number of cattle. Heating demand on dairy farms comprises of hot water for cleaning, and the digester’s heating requirements. Hot water needs were estimated from studies carried out on milking parlour heating needs of dairy farms [36] [37] [38].
3.2. Optimisation Variables for Determination of Maximum Revenue from a WET
Four variables were selected for use in the optimisation (Table 3).
The maximum value of backup propane mass flow rate, (
), was obtained from the propane flow rate that meets the maximum heat demand when the boiler is combusting propane only, and when there is maximum volume flow rate of manure from the lagoon. This is because heating is required to raise the temperature of influent manure to the operating temperature of the digester.
The biogas sharing ratio, (
), is the ratio of biogas sent to the boiler. In selection of the maximum value of the biogas sharing ratio, it is ensured that biogas is sent to the engine for electricity generation at all times.
The maximum value of the volume flow rate of manure from the lagoon, (
), is determined using:
for
m3/day, (18)
where
is the maximum volume flow rate of manure from the lagoon,
is the volume flow rate of manure from the cows,
is the maximum number of days in a month and
is the storage capacity of the lagoon. The ratings of the induction generator, (
), are based on engine-generator sets currently operational on dairy farms.
![]()
Table 3. Variables of the optimisation.
3.3. Parameters of the Optimisation for Determination of Maximum Revenue from a WET
The parameters of the optimisation for the determination of maximum revenue from a WET, for a given number of cattle are given in Table 4. These are used in addition to the Tabu Search parameters given in Table 2.
3.4. Objective Function for Determination of Maximum Revenue from a WET
The objective of the optimisation is to maximise revenue from a WET for a given number of cattle. In order to maximise revenue, costs are minimised, thus the objective function is expressed as a cost minimisation function:
for
USD, (19)
where z is the minimal cost,
is the capital cost amortized monthly,
is the monthly cost of backup propane,
is the value of incentives given monthly for generation of renewable energy and
is the monthly cost of electricity obtained or sold to the grid. The capital cost,
, is obtained from the monthly amortization of the capital expenditure on the WET. The capital expenditure includes building of a digester and lagoon, and purchase of a boiler and engine-generator set. Estimation of the cost of building a digester and purchase and installation of an engine-generator set is based on a literature review [39] [40] and is given in Table 5 and Table 6, respectively. Estimation of the cost of the boiler is based on a literature review [41] and is given in Table 7. The total capital expenditure on the WET is calculated by:
USD, (20)
where Ccost is the total capital expenditure, dcost is the digester cost, gcost is the engine-generator set cost, lgcost is the lagoon cost, bcost is the boiler cost, Ccap_in is the capacity incentive and xanc is an ancillary works factor.
The total capital expenditure is amortized monthly by
![]()
Table 4. Parameters of the optimisation.
![]()
Table 5. Cost estimates for plug flow digesters.
![]()
Table 6. Engine-generator set cost estimates.
for
USD, (21)
where Ccapital is the capital cost amortized monthly, r is the annual interest rate, Ccost is the capital expenditure and p is the number of payments.
Another cost component of the objective function is the monthly cost of propane,
, obtained from the unit cost of propane [42], and the monthly consumption of propane.
The cost of incentives,
, in the objective function is calculated by:
for
USD, (22)
where Cincentives is the monthly cost of incentives, h is hours, nhours is the number of hours for which the system generates electricity, xinc is the performance incentive and y1 is the power output.
The cost of electricity from the grid is calculated using the electricity tariff [43], and the electrical energy obtained from the grid.
4. Maximum Revenue from WET
In Table 2, the solution with the 150 hp engine-generator set gives the maximum revenue of USD 38,133 per annum from the sale of electricity and avoidance of usage of grid electricity for a number of cattle of 500. The sizing of the components of the 150 hp engine-generator set system is a digester of capacity 1350 m3, a lagoon of 40 days storage capacity and a boiler rated at 133 kW.
5. Conclusion
It has been shown that the problem of prediction of maximum revenue from a biomass waste-to-energy conversion system can be solved using a Tabu Search optimisation technique. The system model and the Tabu Search optimisation strategy were described. 500 cows were selected and the Tabu Search algorithm developed was used to optimise the WET. Maximum annual revenue of USD 38,133 for 500 cows was predicted from the optimisation. The Tabu Search optimisation algorithm developed can be used to predict the maximum revenue that can be generated from a given number of livestock for a biomass waste-to-energy conversion system.