1. Introduction
There is increasing interest in applying artificial intelligence in many academic research fields. There are many approaches of artificial intelligence including machine learning and statistical learning, and applied research of artificial intelligence is indeed emerging and increasing (e.g., Chen & Ge, 2019; Shi, 2019; Sirignano & Cont, 2019).
However, previous research that applied random forest methodology—a machine learning algorithm developed by Breiman (2001)—is very limited in business and finance. Hence, testing the effectiveness of this random forest methodology in the fields of business, economics, and finance shall be greatly meaningful. However, as we indicate in Section 2, existing applied works of random forest methodology in the fields of business, economics, and finance are very limited. Therefore, given and motivated by this limited research background, this study newly examines the effectiveness of the random forest algorithm in forecasting exchange rates, which are one of the most representative economic and financial variables.
As a result, this study derives the following significant contribution. That is, we newly signify that evaluating the effectiveness, the predictive performance of random forest approach in exchange rate forecasting is rather high. This shall be beneficial both for academic researchers and industry practitioners as these research results are limited. We thus emphasize that our results are rather new.
The rest of this article is organized as follows. First, Section 2 conducts a short literature review and Section 3 explains the data and methodology employed in this study. After these, Section 4 exhibits our results and Section 5 concludes the article.
2. Short Literature Review
This section concisely reviews recent literature that applied artificial intelligence. First, applying a large-scale deep learning approach to high-frequency data of market quotes and transactions for US equities, Sirignano & Cont (2019) clarified some relations between order flow histories and stock price moving directions. Further, Procacci & Aste (2019) proposed a new method for forecasting stock market states, and after some examinations using US stock data as training and testing data, they suggested that their approach was successful in clustering and detecting different stock market states. We however note that in these studies, random forest methodology was not employed.
In addition, using Hong Kong stock market data, Chen & Ge (2019) empirically showed the effectiveness of recurrent neural network methodology in predicting stock price movements. Moreover, using high-frequency order book data in Korea, Ju et al. (2019) investigated stock and futures market behaviors using neural network approach, and they suggested that their neural network models were successful in learning market features such as order imbalances, volatility correlations, and mean reversions. Furthermore, Lahmiri & Bekiros (2019) empirically tested multiple machine learning methods in predicting corporate bankruptcies, and they suggested the effectiveness of machine learning methods in corporate bankruptcy predictions. However, we again note that in these existing works, random forest methodology was not employed, either.
More recently, Zhu et al. (2021) provided a literature review of artificial intelligence studies on the practices of financial fraud detections. Furthermore, after rigorous quantitative investigations, Tsuji (2022) derived many significant views for risk management using artificial intelligence. However, we also note that in these studies, actual investigations using artificial intelligence were not conducted.
As this literature review clearly shows, existing applied works of random forest methodology in the fields of business, economics, and finance are rather limited. Given this research background, this study attempts to inspect the effectiveness of the random forest algorithm in forecasting the dynamic evolutions of exchange rates, which are one of the most representative economic and financial variables.
3. Data and Methodology
This section documents our data and methodology. The data we analyzed in this study comprise four daily exchange rate time series. Using the notations of USD: US dollars; CAD: Canadian dollars; GBP: Great Britain pounds; AUD: Australian dollars; and EUR: euros, the four exchange rates we analyze in this study are 1) CAD per USD, 2) USD per GBP, 3) USD per AUD, and 4) USD per EUR. All data are provided by Yahoo Inc.
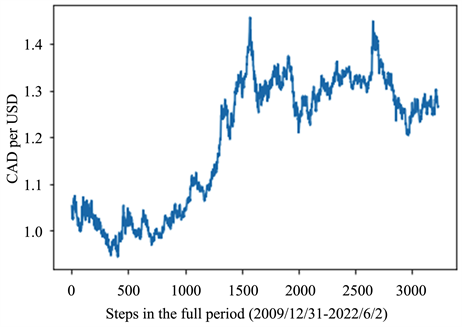
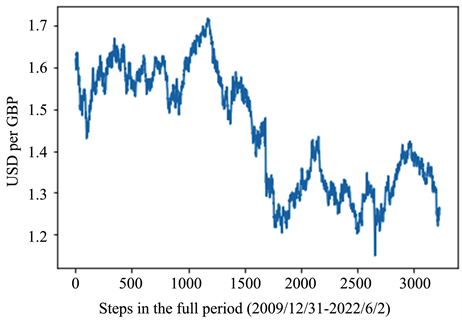
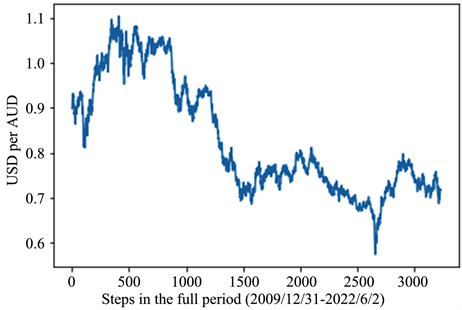
In addition, our full sample period is from December 31, 2009 through to June 2, 2022, and we split the full period into the train data of December 31, 2009 to March 8, 2021 and test data of March 9, 2021 to June 2, 2022. Figure 1 exhibits the dynamic evolutions of the levels of the four exchange rates in the full-sample period. More specifically, Panels A to D in Figure 1 exhibit the time-series evolutions of Canadian dollars per US dollar, US dollars per Great Britain pound, US dollars per Australian dollar, and US dollars per euro, respectively. Moreover, Table 1 provides their descriptive statistics also for the full period.
As documented, this study uses a machine learning method of the random forest algorithm, and attempts to forecast the dynamic evolutions of the four exchange rates in the test data period after training by using the train data. In this study, we employed standard random forest methodology. After forecasting, we evaluate the predictive performance of random forest approach by the R-squared value, which is a very reasonable measure for evaluating the predictabilities of exchange rate levels investigated in this study.
![]()
Table 1. Descriptive statistics for exchange rates for the full sample period of December 31, 2009 to June 2, 2022.
SD: standard deviation value. USD: US dollars; CAD: Canadian dollars; GBP: Great Britain pounds; AUD: Australian dollars; EUR: euros.
Panel A. Canadian dollars per US dollar
Panel B. US dollars per Great Britain pound
Panel C. US dollars per Australian dollar
Panel D. US dollars per euro
4. Results
This section explains our testing results. We provide R-squared values in Table 2 to inspect the predictive performance of the random forest algorithm we employed and tested in this study. According to the R-squared values, we understand that generally, forecasting accuracies of random forest methodology are rather high.
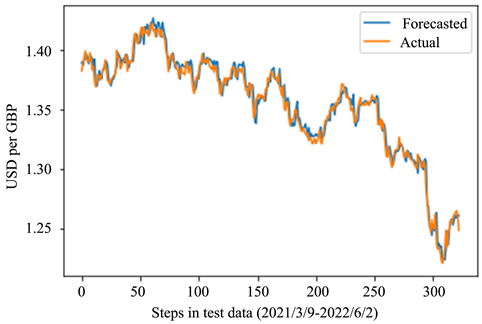
Explaining individually, euros (USD per EUR) are forecasted with the highest accuracy with a R-squared value of 0.987, and Great Britain pounds (USD per GBP) are also well predicted with a very high R-squared value of 0.975. Similarly, the R-squared values for Australian dollars (USD per AUD) and Canadian dollars (CAD per USD) are also high and as in Table 2, they are 0.956 and 0.921, respectively.
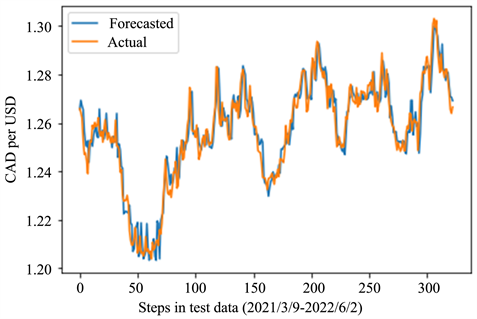
In addition, Figure 2 plots the time-series evolutions of forecasted and actual values of the four exchange rates in the test data period. As this figure shows, all the four forecasted values are well fitted to the corresponding actual exchange rate values, also demonstrating the higher performance of the random forest algorithm in predicting all the four exchange rates analyzed in this study.
![]()
Table 2. Predictive performance in test data for the period of March 9, 2021 to June 2, 2022.
R2: R-squared value. USD: US dollars; CAD: Canadian dollars; GBP: Great Britain pounds; AUD: Australian dollars; EUR: euros.
Panel A. Canadian dollars per US dollar
Panel B. US dollars per Great Britain pound
Panel C. US dollars per Australian dollar
![]()
Figure 2. Forecasted and actual values in test data.
Panel D. US dollars per euro
5. Conclusion
This article has attempted to forecast the dynamic evolutions of exchange rates by applying a machine learning method. More concretely, we attempted to forecast the evolutions of the four exchange rates of Canadian dollars, Australian dollars, Great Britain pounds, and euros, which are all against the US dollar, by using random forest approach.
As a result, all the R-squared values for evaluating the four exchange rate predictabilities were rather high, and this signifies the forecast performance of the random forest algorithm is generally high. Our results derived from this study imply the effectiveness of the use of the random forest algorithm in various contexts in the fields of business, economics, and finance. We consider that testing random forest algorithms by considering some parameter tuning methods is also interesting future research. Hence, further applied research of various other machine learning techniques including random forest approach in many related fields may be one of our future tasks.
Acknowledgements
The author is particularly grateful to the repeated cordial article invitations from Joy Deng (Managing Editor). The author thanks anonymous reviewers for their supportive comments on this paper. The author also appreciates the financial support of the grant program of the Chuo University Promoting Research Period. Furthermore, I deeply thank all the editors of this journal for their kind attention to this paper.