1. Introduction
Cannabis sativa L. (cannabis) produces a number of secondary metabolites (i.e. cannabinoids and terpenes), which are most abundantly found in trichome structures on the bracts of pistillate (female) flowers and generally represent the chemical composition of the end product termed potency (%) [1] [2]. Cannabis producers often sell their product using a combination of potency and end point plant productivity (yield-dry weight) and end point users often make purchasing decisions based on cannabinoid concentrations, smell (terpenes are largely responsible for the characteristic aroma of cannabis [3] [4], appearance (bag appeal), and pharmacological effects, which are largely determined by synergistic interactions of cannabinoids and terpenes [5].
Different environmental conditions can induce variations in the production of secondary metabolites (potency) and yield, within and between different chemotypes (commonly referred to as cultivars or as strains in the cannabis industry) of cannabis [4]. Light is one of the most important environmental factors affecting potency and yield in cannabis plants and specifically in cannabis production facilities using artificial lighting [6] - [17].
Growing cannabis plants using artificial lighting allow producers the ability to achieve continuous and uniform yield and potency, which are important components to the success of cultivation facilities in the cannabis industry [10] [12]. Narrowband width (monochromatic) light with unique spectra has the potential to enhance quality (secondary metabolite profile) and increase yield in cannabis [10] [12] [16] [18]. However, limited published research exists that includes different cannabis chemotype responses to narrowband width light on gas-exchange parameters, concentration of cannabinoids and/or terpenes, and yield in cannabis cultivation facilities, which remain under characterized and poorly understood.
The aims of this study are to 1) determine cannabinoid and terpene concentrations and yield in chemotypes I, II, and III grown under control full spectrum lighting; 2) assess differences in gas-exchange parameters and cannabinoid and terpene concentrations and yield between control lighting, control plus monochromatic UV-A (~390 nm), and control plus the combination of monochromatic blue (~450 nm) and red (~660 nm) lighting in chemotypes I, II, and III. We hypothesized that cannabinoid and terpene concentration would increase in all chemotypes in treatments with the addition of narrow bandwidth UV-A light and the combination of narrow bandwidth blue and red light, with no difference in yield.
2. Methods
2.1. Plant Material and Growth Conditions
80 plants (16 plants per LED light (Fluence Bioengineering (now Fluence by Osram) (SPYDR xPLUS)) of C. sativa L. including 27 plants of chemotype I (Larry OG), 27 plants of chemotype II (Pootie Tang), and 26 plants of chemotype III (Super White) were grown in Denver Colorado, USA, at a state approved cannabis cultivation facility. The morphological groupings used in this study are representative of general characteristics used when genetics/cultivars are chosen for commercial scale cannabis production. All plant cultivars were originally obtained and started from seed and grown under metal halide lights at 250 µmol·m−2·s−1 under similar conditions until sex was established and single “mother” plants were isolated, and all clones were established from the same mother plants. Clones were taken and kept in conditions suitable for root initiation (high humidity, hormones, rockwool, heating pads, T12 fluorescent illumination) for 14 days until roots were clearly established. Plants were then transplanted into 6-inch rockwool cubes [Grodan, Roermond, The Netherlands] where they remained until harvest. The duration of vegetative growth was 14 days with a photoperiod of 18 hours of light. Plants were regularly watered with a complete nutrient solution of Coco A and B [5%
, 0.1%
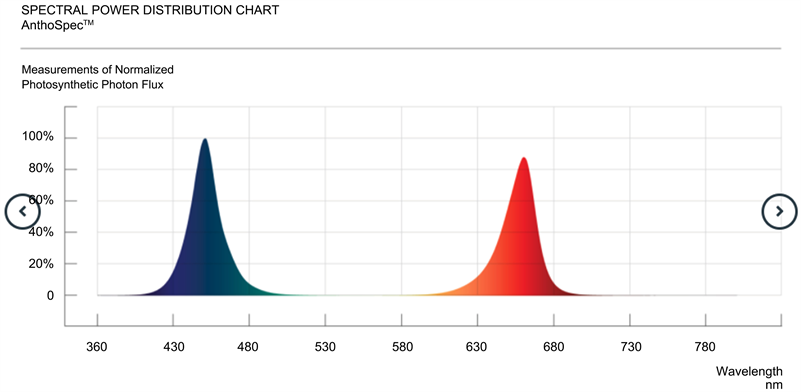
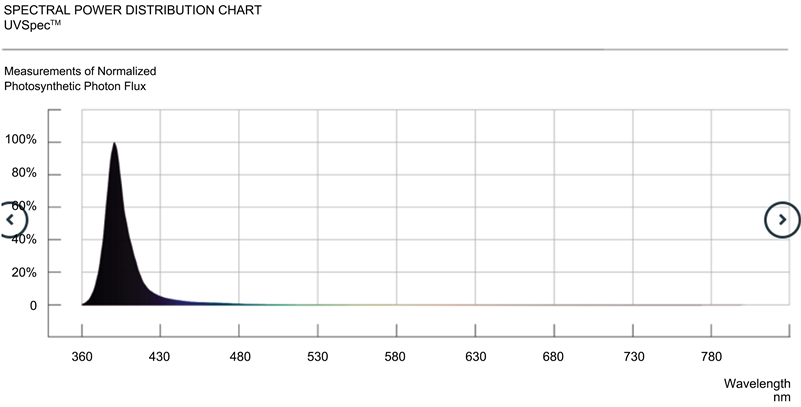
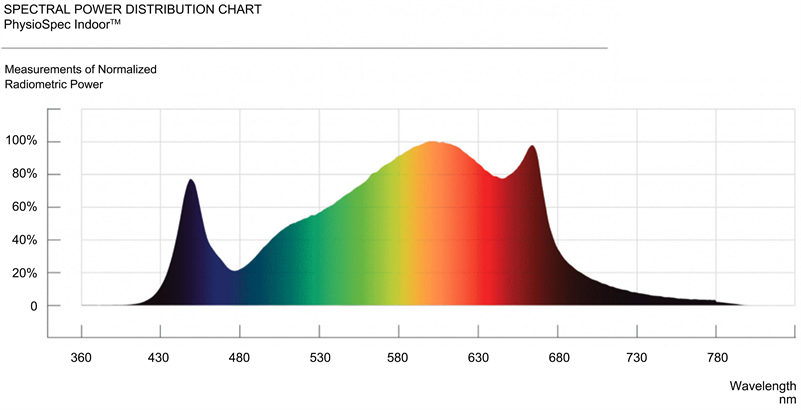
, 4% P2O5, 3% K2O, 7% CaO, 3% MgO, 2% SO3, 0.007% B, 0.001% Cu, 0.02% Fe DTPA, 0.0003% Fe EDTA, 0.01% Mn, 0.002% Mo, 0.007% Zn, 0.5% fulvic and humic acid; CANNA International BV, Oosterhout, The Netherlands] with 1.5 mS/cm of electrical conductivity (EC) and pH 5.8 and kept in a grow room at 20˚C to 30˚C and 50% to 80% RH. Abiotic conditions were adjusted weekly and biotic treatments were performed periodically to maintain maximum productivity. The range of environmental conditions matches what is generally used in cannabis commercial facilities and adjusted to match specific growth stages and IPM strategies. A short photoperiod of 12 hours light and 12 hours darkness was set in the flower room to induce flower induction and EC of the nutrient solution was increased to 1.8 to 2.0 mS/cm. Conditions in the flower room were set to achieve suitable environmental conditions for optimal photosynthetic performance and final product quality and quantity. Photosynthetic indices were measured on all 5 trays illuminated with the control SPYDR xPLUS LED lights during early flower, mid-flower, and late flower on a randomized selection of plants per chemotype to determine differences in gas-exchange parameters before experimental light treatments were introduced (UV-A light (identified as UV in tables and figures), blue and red (identified as Antho Spec in tables and figures)). Thereafter, light treatments were initiated to assess photosynthetic gas-exchange parameters, cannabinoid concentration, terpene concentration, and yield of chemotypes I, II, and III in response to narrow bandwidth illumination UV-A (~390 nm) by Ray44 UVSpec (Fluence by Osram) LED and the combination of blue (~450 nm) and red (~660 nm) by Ray 44 AnthoSpec (Fluence by Osram) LED in addition to control lighting using full spectrum wavelength illumination by SPYDR xPLUS (Fluence by Osram) LED during the final two weeks of flowering (see Supplementary Information section for spectral characteristics of LEDs used in this study).
2.2. Pre-Treatment and Treatment Gas-Exchange Measurements
Pre-treatment photosynthetic measurements were performed on third order sets of leaves of randomly selected plants from each cultivar at different developmental stages during flowering (15, 15, and 8 individual plants for Chemotype I during early flower, mid-flower and late flower, respectively; 15, 14, and 9 individual plants for Chemotype II during early flower, mid-flower and late flower, respectively; and 6, 14, and 9 individual plants for Chemotype III during early flower, mid-flower and late flower, respectively). Light treatment photosynthetic measurements were performed on third order sets of leaves of randomly selected plants from each cultivar (3 individual plants for Chemotype I, II, and III under control lighting SPYDR xPLUS; 6 individual plants for Chemotype I, II, and III under UV-A (~390 nm) at ~66 PPFD by Ray44 UVSpec light in addition to control lighting; and 6 individual plants for Chemotype I, II, and III under blue (~450 nm) and red (~660 nm) at ~158 PPFD by Ray 44 AnthoSpec light in addition to control lighting). Leaf level gas-exchange measurements were conducted using a portable open-mode photosynthesis system (model LI-6800, Li-Cor, Lincoln, NE, USA) with a 2 × 3 cm light source chamber (6400-02B LED, Li-Cor Inc.) and an external CO2 source (set to 1300 µmol·mol−1 for all photosynthetic measurements). An airflow rate of 500 mmol·s−1 was used to maintain a significant differential of CO2 and H2O concentration between the reference and sample infrared gas analyzers. For each measurement, fully mature, light saturated, healthy leaves were clamped into the chamber resulting in the entire 2 × 3 cm chamber area full of leaf material and the chamber gaskets were coated with G35 Qubitac Sealant [Qubit Systems Inc., Kingston, ON, Canada] to minimize CO2 leakage. During all measurements, vapor pressure deficit (VPD), light intensity, relative humidity, and leaf temperature were allowed to vary with conditions inside the cuvette to match the environmental conditions the plants were acclimated to in the production environment. Key gas-exchange parameters during pre-treatment measurements are presented in Table 1. Key gas-exchange parameters during treatment measurements are presented in Table 2. Leaf temperature throughout measurements was within optimal ranges as determined in previous studies (data not shown). The Li-Cor supplemental light source was removed for all measurements allowing the leaf material in the chamber to respond to experimental illumination. Measurements were recorded after stability criteria were met for 3 - 5 min. The harvested plants were cut from the base and dried at 18˚C by hanging them upside down in a dark drying room equipped with dehumidifiers and reducing the RH 5% every two days to achieve a final RH of between 50% and 55% in the dry room. Yield (dry weight per plant (grams)) was recorded from each plant used for secondary metabolite determination.
2.3. Cannabinoid Concentration
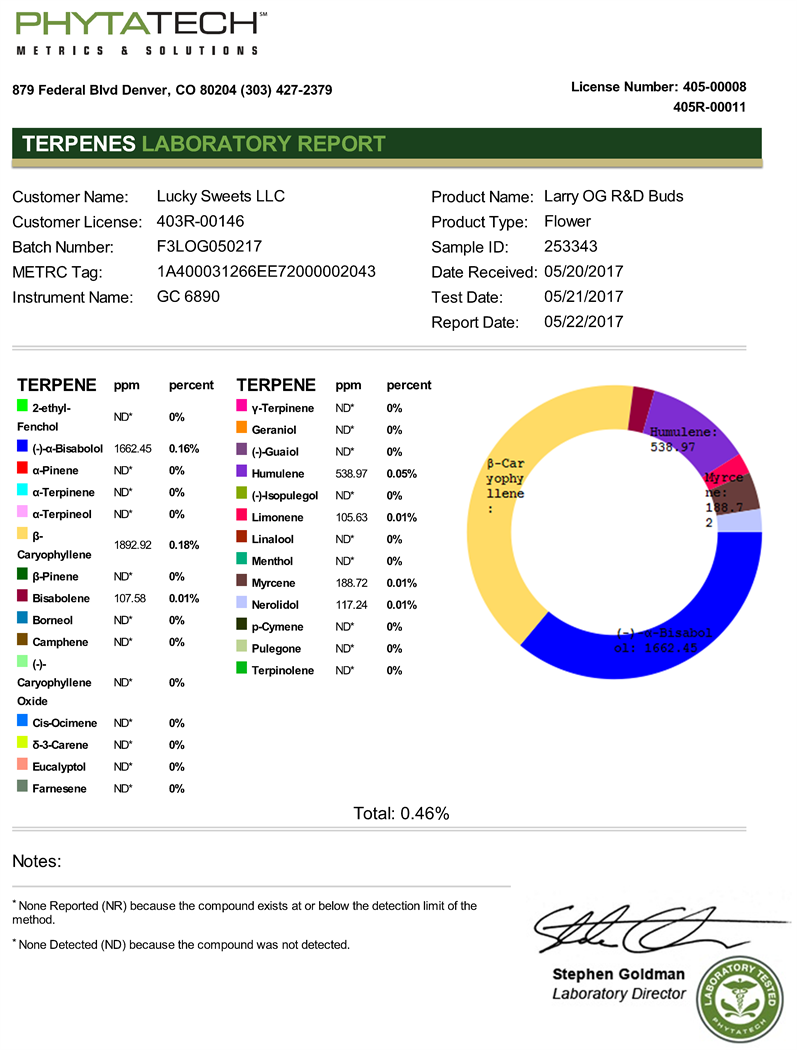
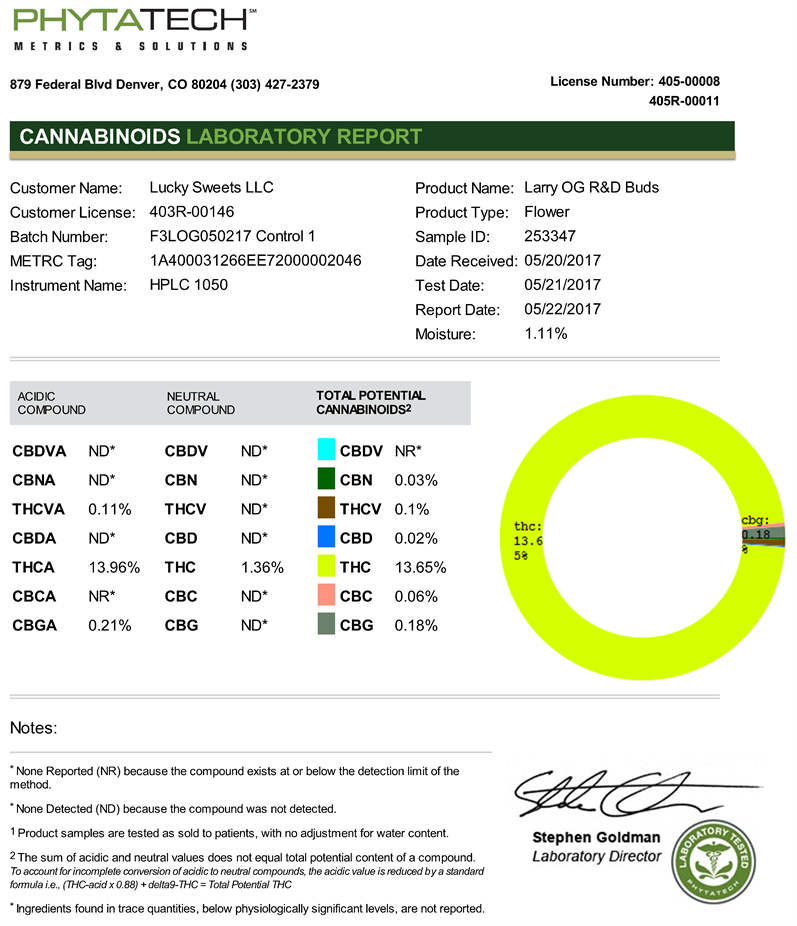
PhytaTech performed liquid extraction and analyses, in accordance with PhytaTech
![]()
Table 1. Key gas-exchange parameters in LiCor-6800 during pre-treatment measurements.
![]()
Table 2. Key gas-exchange parameters in LiCor-6800 during light-treatment measurements.
SOP-020, to monitor the product chemotype. Analysis on PhytaTech’s potency assay, performed on Agilent 1100 HPLCs, are validated annually according to WHO and AOAC validation criteria. Quantitation was performed using reverse phase HPLC columns, DAD detection at 284 nm and 220 nm, quaternary gradient pumps, column ovens and automatic autosamplers. Mobile phases include acidified (formic acid) methanol and acidified water, both LC grade. All analysis was performed with chemstation software and the laboratory’s custom-built LIMS system.
2.4. Terpenoid Concentration
PhytaTech performed liquid extraction and analyses, in accordance with PhytaTech SOP-067, to monitor the product chemotype. Analysis on PhytaTech’s terpene assay, performed on Agilent 6890 GC’s, are validated according to WHO and AOAC validation criteria. Quantitation was performed using direct liquid injection onto Agilent DB-5 GC columns with FID and MSD quantitation. All analysis was performed with chemstation software and the laboratory’s custom-built Laboratory Information Management system (PureLIMS).
2.5. Data Analysis
The data obtained were statistically analyzed using GraphPad Prism version 6.0d for Mac OS X [GraphPad Software, San Diego California USA] the results are presented as mean ± standard error. Statistical analysis for comparison between chemotypes of the pre-treatment gas exchange data was performed with one-way analysis of variance (ANOVA) followed by post-hoc Tukey tests, with the level of significance at 5%. Statistical analysis of gas exchange data for comparison of different light treatments was performed with one-way analysis of variance (ANOVA) followed by post-hoc Tukey tests, with the level of significance at 5%. Statistical analysis for comparison of different light treatments on cannabinoid and terpene concentration was done using the Tukey tests, with the level of significance at 5%. Statistical analysis for comparison of different light treatments on yield was performed with one-way analysis of variance (ANOVA).
3. Results
3.1. Results of Pre-Treatment Gas-Exchange
Key gas-exchange parameters within the leaf chamber of RH (RHchamber), leaf VPD (VPDleaf), and photosynthetic photon flux density (PPFD) incident on the leaf (Qin) used during pre-treatment measurements are presented in Table 1. Pre-treatment net photosynthetic rates (Leaf-AN μmol·m−2·s−1) were similar for all chemotypes during early flower, mid-flower, and late flower with means between 20 and 30 μmol·m−2·s−1 (Figure 1(a)). Pre-treatment stomatal conductance rates (gs, mol·m−2·s−1) were similar for all chemotypes during mid-flower and late flower (Figure 1(b)). Stomatal conductance in chemotype II during early flower was significantly greater than chemotype I (Figure 1(b)). Average stomatal conductance rates across chemotypes decreased by 27% from early to mid-flower and 38% from mid to late flower (0.97, 0.71, to 0.44 mol·m−2·s−1 early flower, mid-flower, late flower respectively (Figure 1(b)). Pre-treatment transpiration rates (EL, mol·m−2·s−1) were similar for all chemotypes during mid-flower and late flower (Figure 1(c)). Leaf transpiration rates in chemotype II during early flower were significantly greater than chemotype I and III (Figure 1(c)). Average transpiration rates across chemotypes decreased by 58% from 0.0092 to 0.0039 mol·m−2·s−1 from mid to late flower (Figure 1(c)).
3.2. Results of Treatment Gas-Exchange
Key gas-exchange parameters within the leaf chamber of RH (RHchamber), leaf VPD (VPDleaf), and photosynthetic photon flux density (PPFD) incident on the leaf (Qin) used during treatment measurements are presented in Table 2. No
![]()
Figure 1. Variations in C. sativa leaf level gas-exchange parameters; photosynthesis (leaf-AN; Panel A), stomatal conductance (gs; Panel B), leaf transpiration (EL; Panel C) in chemotypes I, II, and III at three developmental stages. Significant (P < 0.05) differences between chemotypes are indicated with asterisks in the panels.
difference was found in photosynthetic, stomatal conductance, or transpiration rates between control and the two light treatments or between light treatments in chemotype I (Figures 2(a)-(c)). No difference was found in photosynthetic rates between control and the two light treatments or between light treatments in chemotype II (Figure 2(a)). Stomatal conductance and transpiration rates significantly increased under Antho Spec light treatment (blue ~450 nm and red
![]()
Figure 2. Variations in C. sativa leaf level gas-exchange parameters; photosynthesis (leaf-AN; Panel A), stomatal conductance (gs; Panel B), leaf transpiration (EL; Panel C) in chemotypes I, II, and III during the final two weeks of flowering. Significant (P < 0.05) differences between chemotypes are indicated with asterisks in the panels.
~660 nm) in chemotype II versus control with no difference between UV light treatment (UV-A ~390 nm) versus control or Antho Spec light treatment (Figure 2(b) and Figure 2(c)). Photosynthetic rates significantly decreased under Antho Spec light treatment (blue ~450 nm and red ~660 nm) in chemotype III versus control (Figure 2(a)). No difference was found in stomatal conductance or transpiration rates between control and the two light treatments or between light treatments in chemotype III (Figure 2(b) and Figure 2(c)).
3.3. Cannabinoid Concentration
Significant increases in THC were found in Antho Spec and UV light treatments versus control in chemotypes I with an increase of 2.9% between control and Antho Spec and 3.6% between control and UV light treatments (Figure 3). Significant
![]()
Figure 3. Effect of light treatment during the final two weeks of flowering on cannabinoid concentration in chemotypes I, II, and III. Significant (P < 0.05) differences in specific cannabinoid concentrations between control and light treatments are indicated with asterisks in the panels.
increases in THC were found in Antho Spec and UV light treatments versus control in chemotypes III with an increase of 3.9% between control and Antho Spec and 4.1% between control and UV light treatments (Figure 3).
3.4. Terpenoid Concentration
Terpene concentrations (-)-α-Bisabolol and β-Caryophyllene in chemotype I were significantly decreased in the UV light treatment versus control (Figure 4). Terpene concentrations α-Pinene and β-Caryophyllene in chemotype II were significantly decreased in the UV light treatment versus control (Figure 4). Terpene concentration of (-)-α-Bisabolol in chemotype III were significantly increased in
![]()
Figure 4. Effect of light treatment during the final two weeks of flowering on terpenoid concentration in chemotypes I, II, and III. Significant (P < 0.05) differences in specific cannabinoid concentrations between control and light treatments are indicated with asterisks in the panels.
the UV light treatment versus control (Figure 4). Terpene concentration of β-Caryophyllene in chemotype III was significantly decreased in the UV light treatment versus control (Figure 4).
3.5. Yield
A significant difference between control and light treatments for yield was found in chemotype I with a reduced yield in the UV light treatment (Figure 5).
4. Discussion
Results from this study show that the addition of narrow bandwidth (UV-A and the combination of blue and red) light during the final stages of flowering affects secondary metabolite production in a variety of ways in the chemotypes I, II, and III. The effects were most evident on the increased concentration of THC of chemotype I and III as well as the reduction in some terpene concentrations in all chemotypes in response to UV-A light. However, other cannabinoids were unaffected by the addition of narrow bandwidth light, which is consistent with findings in previous studies on cannabis plants [16] as well as the majority of terpenes. Only under UV-A light was terpenoid concentration ((-)-α-Bisabolol) significantly increased over controls and this affect was only shown in chemotype III. Lydon et al. (1987) reported increased THC concentrations when cannabis plants were grown with supplemental UV-B radiation, suggesting that cannabinoids may play some role in UV protection in cannabis, which is consistent with findings of the accumulation of secondary metabolites acting as light-screening compounds to limit damage caused by high light intensity and UV radiation [19] [20]. It has been suggested that decreased light level may reduce the pool of precursor substrates available for cannabinoid synthesis [1]; however, light level in this study was not determined to be a limiting factor (discussed below). It is important to understand that many parameters outside of abiotic and biotic cultivation conditions may affect secondary metabolite and yield results,
![]()
Figure 5. Effect of light treatment during the final two weeks of flowering on yield in chemotypes I, II, and III. Significant (P < 0.05) differences in yield between control and light treatments are indicated with asterisks in the panels.
such as harvest protocol, post-harvest processes (drying, curing, and trimming), method of storage, storage time before analysis, part of plant used for analysis, and method of sample processing for analysis [3]. In this study, all harvest and post-harvest protocols were used as specified in SOPs for the commercial cannabis cultivation facility where this study was undertaken, and representative of common harvest and post-harvest processing used throughout the cannabis industry.
In this study, pre-treatment net photosynthetic rates (Leaf-AN μmol·m−2·s−1) were similar for all chemotypes during early flower, mid-flower, and late flower with means between 20 and 30 μmol·m−2·s−1 (Figure 1(a)). These results were generally consistent with trends of other studies [6] [7] [13] [16] [17] [21]; although photosynthetic rates in this study were enhanced compared to most published cannabis photosynthetic research. For example, Chandra et al. 2008 observed the maximum rate of photosynthesis of 24.60 μmol·m−2·s−1 at 1500 PPFD at atmospheric CO2 350 ± 5 µmol·mol−1. In this study we observed similar photosynthetic rates under lower light levels between ~472 - 598 PPFD (Table 1); however, gas-exchange measurements in this study were conducted using atmospheric CO2 at 1300 µmol·mol−1. The differences between photosynthetic rates in this study and other cannabis photosynthetic research is most likely a combination of dissimilar environmental conditions used during measurements, water status of plant and root tissue, overall health, growth stages of plants used during measurements, and genetics (chemotypes). It is important to understand that achieving light intensities at the canopy level in a cannabis cultivation facility near 1500 PPFD is an extremely difficult task, when in addition to light intensity cannabis cultivators must also maintain ranges of other important environmental conditions i.e. leaf temperature, RH, VPD, and adequate air circulation; as well as a successful integrated pest management plan. With all these factors taken into account and the enhanced photosynthetic rates observed in this study it has been determined that light levels used in this study were not determined to be a limiting factor in photosynthetic rates, secondary metabolite production, or yield.
In a review of photosynthesis and plant productivity by Lawlor in 1995 it was emphasized that although photosynthetic rate per unit leaf area is the driving force for all plant growth, dry matter production (yield) is determined by a combination of processes integrated over the canopy, such as leaf area index, canopy architecture, and leaf area duration. These factors were not included in this study nor was daily light integral, which is another important factor in understanding the response of plant productivity and light [13]. An interesting trend observed in this study of reduced photosynthetic, stomatal conductance, and transpiration rates towards the final stages of flowering (Figure 1 and Figure 2), which was most likely a result of changes in leaf chamber conditions during measurements (Table 1 and Table 2), but could also be a result of general physiological changes over the life cycle of cannabis plants such as shifts in water-use-efficiency (WUE), biochemical limitations (Ribulose 1,5-bisphosphate, Rubisco, triose phosphate utilization), and/or an increased accumulation of carbohydrates, which could indicate sink limitation [7] [22]. Similar trends have been observed in studies of other industrial crop plants, for instance a decrease in stomatal conductance persisted in soybeans throughout the season [22]. Further exploration of gas exchange parameters to understand physiological changes throughout the life cycle of cannabis plants is a needed focus for future research. The yields determined in this study across all chemotypes (mean of 88.33 grams per plant (Figure 5)) is 214.3% greater than the estimation of 28.1 grams per plant made by the University of Wageningen, The Netherlands [23] suggests any reduction in photosynthetic parameters, processes integrated over the canopy, or plant density had limited biological importance.
Limited research has been performed on various wavelengths on photosynthetic performance and secondary metabolite biosynthesis in cannabis plants. Blue and red wavelengths of light are recognized by a range of photoreceptors, i.e., cryptochrome, phototropin and phytochromes all which play direct roles in plant development and are major energy sources for photosynthesis [24]. In a study investigating the effect of blue photon fraction on yield and quality in hemp by Westmoreland and colleagues in 2021, a linear decrease in yield was observed as the fraction of blue photons increased [25]. The response of cannabis yield to increased blue photon fraction observed in this study (Figure 5) versus observations reported by Westmoreland and colleagues could have been mediated by a range of factors including the inclusion of increased red photons in this study. An interesting finding in this study of no difference between terpene concentrations wa found in the combination of blue and red narrow bandwidth light treatment versus control, while a general reduction of many of the most abundant terpenes was observed under UV-A light treatment versus control in all chemotypes (Figure 4).
5. Conclusion
This study has shown a range of responses in cannabis chemotypes to UV and the combination of red and blue monochromatic light during the last two weeks of the flowering cycle; including gas-exchange parameters, cannabinoid concentrations, terpenoid concentrations, and yield.
Acknowledgements
The author wishes to thank PhytaTech CO LLC for their laboratory work.
Abbreviations
UV: Ultraviolet; UV-A: Ultraviolet A; LED: Light-emitting Diode; C. sativa L.: Cannabis sativa L; µmol: Micromole; EC: Electrical Conductivity; pH: Potential of Hydrogen; RH: Relative Humidity; IPM: Integrated Pest Management; CO2: Carbon dioxide; Mmol: Millimoles; H2O: Water; WHO: World Health Organization; AOAC: Association of Official Analytical Chemists; HPLC: High Performance Liquid Chromatography; DAD: Diode-Array Detection; LC: Liquid Chromatography; LIMS: Laboratory Information Management System; ANOVA: Analysis of Variance; PPFD: Photosynthetic Photon Flux Density; VPD: Vapor Pressure Differentials; Qin: Light Incident on the Leaf; THC: Tetrahydrocannabinol;
: Nitrate;
: Ammonium Cation; P2O5: Phosphorus Pentoxide; K2O: Potassium Oxide; CaO: Calcium Oxide; MgO: Magnesium Oxide; SO3: Sulfur Trioxide; B: Boron; Cu: Copper; Fe DTPA: Diethylenetriamine Pentaacetic Acid; Fe EDTA: Ammonium Ferric Edetate; Mn: Manganese; Mo: Molybdenum; Zn: Zinc.
Supplementary Information