1. Introduction
Photocatalyst with higher activities for the environmental applications i.e. water disinfection, water purification and air purification have been major challenge in recent years. Among them, photocatalysis based on semiconductors such as titanium oxide has been attracted more attention for environmental applications due to strong oxidizing power, good chemical inertness, long-term stability and cost-effectiveness, etc. [1] [2] [3]. With dielectric constant, it has been used as a green technique for air and water treatment. Definitely, TiO2 is certainly an excellent photocatalyst that carries out aerophilous decomposition. There are many organic compounds under UV radiation, whose band gap (3.2) is higher than TiO2, which limits any application [2] [4] [5]. Over many years, a number of photocatalytic semiconductors were worked out, such as CaBi12O4, BiFeO3, SrTiO3-Fe2O3, and the metallic element WO12, in addition to which a rumor has been reported [6] [7]. The band gap of those metal oxides which is applicable for the absorption of light, so that could it doubtless be economical photocatalysts beneath the light. Bi2Fe4O9 is a crucial material that may be used as a semiconductor gas sensing element and catalyst for ammonia oxidization. Besides, the above-named application, a recent study has been reported to Bi2Fe4O9 material that may be used as a semiconductor gas identifying element and catalyst for ammonia oxidation. Furthermore, Bi2Fe4O9 nanoplates will act as photocatalysts for acid-base indicator (Methyl Orange) degradation below visible light irradiation, whereas the Bi2Fe4O9 microplates solely exhibit this performed below ultraviolet light. Bi2Fe4O9 is a specific type of photocatalytic under UV-Visible light and it is used as semiconducting material, a possible gas sensitive material and catalyst for ammonia chemical reaction to Nitric Oxide [8] [9]. The microstructural property plays an important role in determining the physical properties of the crystal. The magnetic property, optical property, and semiconductor properties are closely related to their morphology [10] [11]. In addition to this, the relationship between the photocatalytic property and the electronic structure should also be studied to guide the further improvement of the photocatalytic activity. Moreover, investigations on photocatalytic performance only by photodegradation of dyes are not convincing, as it is hard to avoid the discoloring of dyes from adsorption and photosensitization. Photodegradation experiments on alternative organic contaminants are necessary to any judge the photocatalytic performance and create preparations for its practical applications within the future. Liquid ammonia together with the most important nitrogen-containing pollutants in waste may be a potential supply of oxygen depletion thanks to eutrophication [7]. Both ammonium ion
and its conjugate base NH3 are often present in water and effluent. Though the photocatalytic oxidation of
/NH3 by TiO2 has been reportable in many studies, there are few reports on the photodegradation of
/NH3 in alternative systems. It’s revealing to begin the studies on the
/NH3 degradation by alternative photocatalysts, such as the ready Bi2Fe4O9 underneath actinic ray irradiation. Besides
/NH3, the photocatalytic degradation of phenol on Bi2Fe4O9 is also according to the present paper. As is renowned, phenol is a widely used organic chemical present during a sort of wastewaters from numerous completely different industries, and it’s quite toxic and slowly degradable within the atmosphere. The phenol removal is additionally of high environmental concern to seek out a good photocatalyst for its oxidization [8]. Bi2Fe4O9, an antiferromagnetic semiconductor with a mullite structure has attracted in depth interest for its specific magnetic structures, potential photocatalytic application beneath ultraviolet (UV) and visual light, and plays a distinctive role as a gas sensor. The crystallographic structure of Bi2Fe4O9 belongs to the orthorhombic space cluster Pbam, whose building block consisting of two formula units are often delineated as columns of edge-sharing FeO6 octahedral connected by corner-sharing FeO4 tetrahedral and bismuth atoms [10]. Although the antimagnetic force structure of Bi2Fe4O9 has been investigated by many teams, the size-dependent magnetic properties of Bi2Fe4O9 Nano Crytals (NC) haven’t been reported nevertheless, and also the investigation into the dimensions dependence of magnetic properties is of Brobdly importance for elementary researches and applications in spintronics. Bi2Fe4O9 NCs exhibit a wonderful photocatalytic reaction of stain (Methyline Blue) below actinic ray irradiation with the help of a little amount of H2O2. It’s conjointly found that a metamorphosis from anti-ferromagnetism to weak magnetic force happens once the average diameter of the nanoparticles is below 57 nm, and smaller Bi2Fe4O9 NCs exhibit higher photocatalytic activity under visible-light irradiation. Moreover, at the same time, our samples show a quicker degradation rate below actinic ray irradiance with the help of H2O2 than do microplatets and nanosheets prepared by Ruan and Zhang [11]. Bi2Fe4O9 is also attention-grabbing because of its multiferroic nature, high gas sensitivity, and chemical action oxidization of ammonia to NO. The creation of nanostructures could be a basic strategy to realize excellent photocatalytic activity since the photocatalytic reaction occurs dominantly on the catalyst surface and nanostructures can without doubt offer an oversized expanse to volume magnitude relation. Up to now, the preparation of nanostructured Bi2Fe4O9 has been chiefly based on the hydrothermal method, sol-gel template technique, and melted salt technique. Within the side of morphology management, the hydrothermal route offers a plus over alternative preparation techniques; but, the merchandises obtained from the tactic tend to possess a reasonably massive particle size, and furthermore, a cumbersome abstersion method is usually needed to clean out impurities. The properties of useful materials powerfully rely on their morphology, microstructure, dimension and crystallinity. Manageable microstructure and morphology area unit are vital not just for basic analysis but additionally for technological applications. For the sake of morphology control, various methods such as hydrothermal process, sol-gel, solid-state reaction, and molten-salt synthesis for the preparation of Bi2Fe4O9 have been employed [12] [13] [14].
In the present study, Bi2Fe4O9 ceramic was synthesized by the chemical method for improvement of photocatalytic activity of the materials as the chemical route is one of foremost promising routes than other routes due to its low cost, simple process, and low reaction temperature, potential price and advantage for large-scale production [6].
2. Experimental Details
2.1. Material Synthesis
Analytical grade chemicals, Bi(NO3)2∙6H2O (99% Merck, India) and iron nitrate Fe(NO3)3∙9H2O were taken as starting materials for the synthesis of Bi2Fe4O9 ceramic by the chemical route. The stoichiometric amount of bismuth nitrates was dissolved in de-ionized distilled water along with appropriate amount of glycine (C2H5(NO2), 99% Merck, India) as per equivalent to the metal ions. The resulting reaction mixtures were heated on a hot plate magnetic stirrer and maintaining the temperature 70˚C - 80˚C for evaporation of excesses of water. A fluffy mass obtained in the ignition process which burnt with a sooty flame. The obtained fluffy mass was crushed into fine powder with the help of mortar and pestle. The resultant dry powder was calcined at 600˚C for 6 h in the electrical muffle furnace and made pellets (13.0 mm diameters, 1.6 mm thicknesses) using 2 wt% polyvinyl alcohol (PVA) as a binder. These pellets were sintered at 800˚C for 6 h and further carried out different types of physiochemical characterizations such as XRD, SEM, TEM, EDX, Cyclic voltammetry, and Photocatalytic activity.
A Congo Red (CR) dye was selected as the model pollutant in the adsorption study. Initially, a 500 mg/L of CR stock solution was prepared, and experimental samples of respective concentrations (5, 10, 20, 30, 40, and 50 mg/L) were prepared by serial dilution technique. A standard curve of CR was prepared at 497 nm by using a UV-Vis spectrophotometer (Universal Bio, India). The batch adsorption study was performed in 100 mL Erlenmeyer flask by adding absorbent into 50 mL CR solution and shaken at 120 rpm and 30˚C ± 1˚C. The effect of process time (0.5 - 10 min), CR concentration (5 - 50 mg/L), and adsorbent dosage (0.1 - 1.0 g/L) were studied against the removal of CR. The samples were taken at regular time intervals and then centrifuged at 5000 rpm for 5 to measure the final CR concentration. The removal efficiency (%) and adsorption capacity (qe (mg/g)) of CR dye was measured by the following equations.
Removal efficiency of CR dye =
(1)
Adsorption capacity (qe) =
(2)
where Cin and Cout represent the inlet and outlet concentration of CR dye (mg/L), respectively. V is the volume of CR solution (L) and M is the mass of adsorbent (mg/g).
2.2. Material Characterization
The crystalline phase of sintered material was identified by an X-rays Diffractometer (Rigakuminiflex 600, Japan) at a scan rate of 3˚/min in 2θ range of 20˚ - 80˚ employing CuKα radiation of wavelength, λ = 1.54059 Å. The morphology of the fractured surface of sintered Bi2Fe4O9 was characterized by scanning electron microscope (ZEISS, model EVO–18 research; Germany).The Bright field TEM images were obtained with the help transmission electron microscopy (TEM, FEI Tecnai-20G2) with an accelerating voltage of 200 kV. For dielectric measurements, the pellets were polished and painted by silver paste; then dried at 300˚C for 3 h to form electrodes for the respective characterizations. Electrical measurement data were taken by LCR meter (PSM1735-NumtriQ, Newton 4th Ltd UK) by varying the temperature and frequency. Optical band gap energy of Bi2Fe4O9 nanoparticle was evaluated from the observed diffuse reflectance spectra. Reflectance spectra recorded with the help of balanced deuterium-halogen source (DH 2000 BAL, Ocean Optics) with 210 - 2500 nm spectral range.
2.3. Electrochemical Characterizations
Cyclic voltammetry and electrochemical impedance spectroscopy of all the samples have been performed by Versa STAT 3. Corresponding details have been studied in our earlier research work [15] [16].
2.4. Electrode Preparation
The electrode preparation methods have been discussed in our earlier paper [17] [18].
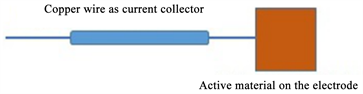
Fabrication of the electrode was done by making a dispersion of 5 mg of prepared material, 2-propanol of 0.2 mL, Nafion of 12 µL and drop casting 80 µL on carbon paper of 1 cm2 area. Silver glue was used to connect the current collector (copper wire) with the substrate (carbon paper).
3. Results and Discussion
3.1. X-Ray Diffraction Analysis
X-ray diffraction pattern of Bi2Fe4O9 polycrystalline ceramic sintered at 800˚C for 8 h is shown in Figure 1 which confirms the single phase formation of the materials. All the diffraction peaks are correctly matched with JCPDS card no. 20-0836 which clearly reveals the absence of secondary phases in the synthesized materials. The orthorhombic structure of Bi2Fe4O9 ceramic was fabricated by two formula units per unit cell. These formula units consist of evenly distributed FeO6 octahedrons and FeO4 tetrahedrons with a lower packing density than that of corresponding closed packed structures. The Bi3+ ions are surrounded by eight oxygen ions with mutually orthogonal shorter BiO3 and longer BiO5 units The most intense peaks of Bi2Fe4O9 ceramic corresponding to the planes (211), (220), (240), (133), (310), (420), (213), (530) are observed in the XRD pattern. All the characteristic peaks of XRD data were indexed on the basis of a cubic unit cell similar to Bi2Fe4O9. The lattice parameter and unit cell volume of Bi2Fe4O9 ceramic were determined by using “Cel” software having lattice parameter a = 7.97 Å, b = 8.43 Å, c = 6.01 Å. The crystallite size (D) of Bi2Fe4O9 ceramic was calculated with the help of Debye-Scherer’s formula as given by the following expression.
![]()
Figure 1. X-Ray Diffraction (XRD) pattern of Bi2Fe4O9 ceramic sintered at 800˚C for 8 h.
(3)
where, k is a dimensionless shape factor, with a value taken as 0.90, λ is the wavelength of X-ray,θ is the diffraction angle (Bragg angle), andβ is the peak width of the diffraction peak at half-maxima (FWHM) and their value is taken as in radian. The β is corrected value of diffraction peak due to instrumental broadening for crystallite size with reference to standard silicon wafer sample. The average crystallite size of Bi2Fe4O9 ceramic calculated by Debye–Scherer’s formula and found to be 37.71 nm.
3.2. TEM and SEM Analysis
Bright field TEM images of Bi2Fe4O9 ceramic sintered at 800˚C for 8 h is depicts in Figure 2(a) which reveals the aggregation of the particles. The average particles size of Bi2Fe4O9 ceramic was found to be 102.58 nm. Bright spot pattern observed in selected area diffraction (SAED) patterns for Bi2Fe4O9 ceramic shown in Figure 2(b), emerging through the corresponding planes (4 4 4), (3 1 0), (4 4 0) and (3 2 1), respectively confirmed crystalline nature of the material. Figure 2(c) exhibits high resolution TEM image displaying inter-planar (d) spacing for Bi2Fe4O9 ceramic. The d-spacing value observed for the Bi2Fe4O9 ceramic is d = 4.157 Å with the corresponding plane (2 1 1). The entire diffraction pattern obtained in the SAED pattern and HR-TEM image are good agreements with the JCPDS card number 46-0416 of the XRD results.
Microstructure feature of the grains of Bi2Fe4O9ceramic was observed in the SEM analysis on the scale 200 nm which is shown in the Figure 3. It is revealed from the figure that homogenous grain was distributed of the materials. The average grain size of Bi2Fe4O9 ceramic was found to be 100 ± 20 nm, measured with the help of Image-J software.
![]()
Figure 2. Represent bright field TEM image (b) indicate SAED pattern (c) HR-TEM images of Bi2Fe4O9 ceramic sintered at 800˚C for 8 h.
![]()
Figure 3. SEM images of Bi2Fe4O9 ceramic sintered at 800˚C for 8 h.
3.3. Dielectric Properties
The variation of dielectric constant (ε) with frequency (Hz) and few selected temperatures of Bi2Fe4O9 ceramic are shown in Figure 4. The value of ε decreases with increase of frequency as clear from the figure and remains constant at higher frequency range. This value at lower frequency region may be arises due
![]()
Figure 4. Variation of (a) real dielectric constant (ε’), (b) dielectric loss (tanδ) as a function of frequency at some selected temperatures.
to space charge polarization in between semi-conducting grains and insulating grain boundaries and constant value of ε due to rapid periodic reversal of electric at higher frequency regions. That is why no charge accumulation occurs at interface in higher frequency and results lower value of ε. The value of dielectric constant of the material is found to be 645.45 at 20 Hz and 373 K.
Plots of dielectric loss (tanδ) with frequency at different temperatures of Bi2Fe4O9 ceramic is shown in Figure 4. It is clearly revealed from the figure that the same trends in tanδ with frequency is observed as the dielectric constant up to 100 kHz and after which above 100 kHz, the value of dielectric loss exactly merged to each other over all measured temperatures. The value of tanδ for Bi2Fe4O9 ceramic was found to be less than 1.0 at 1 kHz at all measured temperatures. The higher value of dielectric loss of Bi2Fe4O9 ceramic may be due to space charge polarization.
Figure 5 shows the variation of relative permittivity with temperature at some particular frequencies of Bi2Fe4O9 ceramic. The below figure shows that dielectric constant first increases and attain maxima and then decreases with increase of temperature. The increment of ε with decreasing frequency may be due to reduction of bonding force in between the atoms which enhance the polarization of the materials.
The value of dielectric constant for Bi2Fe4O9 at 1 kHz, 10 kHz and 100 kHz were found to be 209, 138, and 88 respectively. The plot of Dielectric loss (tanδ) with temperature at 1 Hz, 10 Hz and 100 kHz is shown in Figure 5. The dielectric loss first increases and then decreases with increasing temperature. The increase in the tanδ with temperature may be regarded as oxygen vacancy present in the BiFeO3 ceramic during sintering process. The value of tanδ for Bi2Fe4O9 was found to be 0.87, 0.33 and 0.14 at 1 kHz, 10 kHz and 100 kHz, respectively.
![]()
Figure 5. Temperature dependence (a) dielectric constant (ε’), (b) dielectric loss (tanδ) at a few selected frequencies.
3.4. Adsorption Studies
The contact time of dye solution with adsorbent is adversely affects the dye removal efficiency [19]. It is helpful to analyze the kinetics of dye removal. The effect of process time with respect to Congo Red (CR) removal (%) by Bi2Fe4O9 under the following conditions (pH: 7.0, CR concentration: 20 mg/L, adsorbent dose, 0.1 g/L, temperature: 30˚C ± 1.0˚C, and 120 rpm) is shown in Figure 6. The removal efficiency of CR dye was very fast up to 1.5 min and thereafter reached to the state of equilibrium after a very short contact time (5.0 min). Initially, 93.5% of CR removal efficiency was obtained in 1.5, which further increased with process time and reached 99.3% in 5 min. The obtained result reveals that the material offers very rapid adsorption of CR dye on Bi2Fe4O9. The effective adsorption of CR dye by Bi2Fe4O9 was endorsed to its higher surface area and more available surface active sites for adsorption of Cr dye.
Effect of process time on CR removal efficiency by Bi2Fe4O9 (pH: 7.0, CR concentration: 20 mg/L, adsorbent dose: 0.1 g/L: temperature: 30˚C ± 1.0˚C, and 120 rpm): The influence of adsorbent dose (0.1 - 1.0 g/L) against CR removal (%) by Bi2Fe4O9 under following conditions (pH: 7.0, CR concentration: 20 mg/L, process time: 5.0 min, temperature: 30˚C ± 1.0˚C, and 120 rpm) is shown in Figure 7. A gradually increasing trend of CR dye removal efficiency with increasing adsorbent dose was obtained. The low amount of adsorbent provides less adsorption site at constant CR dye concentration, resulting in low removal efficiency was found. Whereas, large adsorbent dosage leads to an increase in active surface area and adsorption site at constant CR dye concentration, and thus increased CR dye removal efficiency. The CR removal efficiency of 25.4% was found with an adsorbent dose of 0.1 g/L, which was further increased to 97% with 0.8 g/L of adsorbent dose. After that, the CR removal efficiency was not much improved with the adsorbent dose and found to be 99% with 1.0 g/L of adsorbent dose. It was probably due to about all adsorbate (i.e., CR dye) was adsorbed onto the active sites of the adsorbent (Bi2Fe4O9). The effect of adsorbent dose (i.e., polydopamine-kaolin and polydopamine-reduced graphene oxide-kaolin) on the
![]()
Figure 6. The effect of contact time on CR removal (%) at different concentration of CR.
![]()
Figure 7. The effect of adsorbent dose (g) on the removal (%) of CR.
removal of Methylene Blue (MB) was studied and high removal efficiency of MB was obtained at high adsorbent dose due to availability of high active surface area and adsorption site [19].
Figure 8 depicts Effect of adsorbent dose on CR removal efficiency by Bi2Fe4O9 (pH: 7.0, CR concentration: 20 mg/L, process time: 5.0 min, temperature: 30˚C ± 1.0˚C, and 120 rpm). The effect of initial CR concentration (5 - 50 mg/L) in removal efficiency (%) of CR dye by Bi2Fe4O9 under following conditions (pH: 7.0, adsorbent dose: 0.1 g/L, process time: 5.0 min, temperature: 30˚C ± 1.0˚C, and 120 rpm) is shown in Figure 8. It can be perceived from the figure that the adsorption of CR dye on Bi2Fe4O9 was decreased with increasing initial concentration of CR. Initially, CR removal efficiency was gradually decreased with increasing CR up to 20 mg/L, and thereafter the CR removal efficiency was decreased very sharply with increasing CR concentration. The highest CR removal efficiency of 97.8% was obtained at the lowest CR concentration of 20 mg/L, whereas the lowest CR removal efficiency of 42.5% was obtained at the highest CR concentration of 50 mg/L. The high concentration of CR dye could lead to the quick saturation of active site; hence the removal efficiency decreased at high CR concentration. The adsorption of methylene blue (MB) by graphene oxide modified kaolin was studied at various MB concentrations (5 - 40 mg/L), and the lowest removal efficiency of MB was obtained at the highest concentration due to saturation of active sites [20].
3.5. Electrical Conductivity
The conductivity behavior of Bi2Fe4O9 material shows photoconductivity and optical activity for the improvement of their properties. Figure 9 shows the frequency-dependent conductivity behavior at completely different temperatures. The electrical transport properties of the materials derived from AC conductivity and therefore the total conductivity of the materials measured through Almond-West power law that was calculated by the following Equation (3). Frequency
![]()
Figure 8. The effect of adsorbent dose (mg/L) on the removal (%) of CR.
![]()
Figure 9. Conductance vs frequency graph.
dependent of AC conductivity for Bi2Fe4O9 ceramic was determine by Jonscher’s power law as given by using Equation (4).
(3)
(4)
where, σDC is the frequency-independent conductivity dominant at the lower frequency region. A is the temperature-dependent pre-exponential factor and sis the frequency exponent parameters (0 > s > 1), dependent on both of materials and temperature and frequency independent, ω is angular frequency (ω = 2πf). The value of frequency exponent parameters(s) obtained from the slope of the curve by linear square fitting and found to be −0.23, −0.12, 0.25 and 0.42 at 313, 333, 353 and 373 K temperatures. It is observed that the value of s for Bi2Fe4O9 ceramic almost equal to 1 and increases with increase of temperatures. The increase in s value with temperatures indicates the presence of hopping charge conduction mechanism in the Bi2Fe4O9 ceramic.
The activation energy for the AC conductivity, Eac of Bi2Fe4O9 ceramic sintered at 800˚C for 8 h, can be calculated from the slope of logσAC vs. inverse of temperature curve is depicts in the figure. It is observed from the figure that the value of conductivity linearly increases with increases of temperature. The AC conductivity was strongly correlated with the conduction mechanism in the materials over DC conductivity which occurred at higher temperature side due to thermally activated process.
The temperature-dependent of AC conductivity can be measured by Arrhenius equation and it calculated with the help of following expressions:
(5)
where, σ is the conductivity of the materials, σ0 is the pre-exponential factor, Ea is the activation energy for the thermally activated process, T is the absolute temperature and k is the Boltzmann constant.
The activation energy of Bi2Fe4O9 sample measured by using linear fitting of Figure 10 and observed to be 0.042, 0.039 and 0.037 eV at 1 kHz, 10 kHz, and 100 kHz, respectively. From above observed data, it is found that the activation energy values (Ea) slightly increases with decreasing the frequency which may be lead to be thermally activated process. The lesser value of Ea with regarding to higher frequency may be cause of hopping charge mechanism which increases the conduction mechanism of the materials [5].
3.6. Diffuse Reflectance Spectral Studies
Diffuse reflectance spectra of Bi2Fe4O9 nanoparticle Figure 11 showing strong light absorption in the UV-Visible region. However, it has also strong optical absorption extending upto NIR region. Similarly, reported optical band gap value (Eg) of Bi2Fe4O9 nanoparticle is 1.29 eV [21] [22], that may vary depending upon
![]()
Figure 11. Diffuse reflectance spectra of Bi2Fe4O9 nanoparticle. Inset figure showing optical band gap value of Bi2Fe4O9 nano particle evaluated from Kubelka-Munk theory.
the size of nanoparticle prepared and corresponding synthesis process. Similarly variation in techniques adopted for measurement of optical band gap, also have significant effect on the measured band gap value. In the present experiment we have adopted Kubelka-Munk theory for evaluation of optical band gap value of Bi2Fe4O9 nanoparticle, from recorded diffuse reflectance spectra.
(7)
F(R): Kubelka-Munk function;
α: absorption coefficient;
R: reflectance;
S: scattering factor.
Equation (7) describes that Kubelka-Munk function is proportional to absorption coefficient.
Optical band gap can be calculated from the plot of diffuse reflectance versus wavelength, where onset of linear increase in curve determines the corresponding band gap energy. But this method of calculating band gap energy produces slightly inaccurate value, hence it is mandatory to report the type of transition (direct/indirect) during evaluation.
Absorption edge analysis was applied to find the type of transition and to determine the optical band gap represented in Equation (8).
(8)
k: energy independent constant;
Eg: Optical band gap.
The exponent indicates the type of transition where, value of n = 2 and 1/2 for direct and indirect allowed transitions respectively. Since F(R) is proportional to α, modified form of Equation (2) can be represented as:
(9)
The exponent n in Equation (3) can be determined from the plot of (F(R)∙hν)n vs. hν. The best fit to the straight line near the onset of absorption, observed for n = 1/2 recommending indirect allowed transition for Bi2Fe4O9 nanoparticle.
From the plot of (F(R) * hν)1/2 vs. hν, the band gap value of prepared Bi2Fe4O9 nanoparticle is calculated to be 1.83 eV, from the extrapolation of linear region of curve.
3.7. Cyclic Voltammetry
It can be seen from Figure 12 that Bi2Fe4O9 has redox peaks at 0.11 V/0.08 V. This shows that the material is pseudo capacitive in nature. The maximum currents generated during the CV are 4.9 A/g and 5.1 A/g for oxidation and reduction, respectively. The calculated specific capacitance for the electrode is 215 F/g. This signifies that the material can also be used as an electrode in electrochemical supercapacitors.
From Figure 13, the equivalent series resistance is found to be 17.1 Ω and charge transfer resistance is 11.5 Ω. Due to minimum charge transfer resistance it can be used in supercapacitors as electrodes (as conducting in nature).
![]()
Figure 12. Cyclic voltammetry of bismuth ferrite based electrode in 1 M KOH at 5 mV/s.
![]()
Figure 13. Nyquist plot of bismuth ferrite based three electrode system.
4. Conclusion
Bi2Fe4O9 ceramic was synthesized by semi-wet method and studied as active photocatalysts. The sample was characterized by using different characterization methods such as X-Ray Diffraction (XRD), Scanning Electron Microscopy (SEM), Transmission Electron Microscopy (TEM). Additionally, the photocatalytic activities of synthesized Bi2Fe4O9 were evaluated by photo degradation of Congo Red (CR). The Effect of process time, adsorbent dose and initial Congo Red concentration were optimized at batch mode and the outcomes demonstrate that Bi2Fe4O9 shows the pre-eminent potential for the photo degradation of Congo Red. The UV-visible study of BFO revealed a direct transition at 1.8 eV for visible light absorption. The frequency and temperature-dependent AC conductivity observed by the Arrhenius equation explain the hopping charge mechanism in the Bi2Fe4O9 ceramic. The expected specific capacitance of Bi2Fe4O9 based three-electrode system is found to be 215 F/g, and it exhibits pseudo capacitive nature. The electrode has a comparatively less charge transfer resistance of 11.5 Ω. The dielectric constant of the Bi2Fe4O9 was calculated with variation temperature and frequency and found to be 645.45 at 20 Hz and 373 K.
Acknowledgements
Manish Kumar Verma thanks Head, Department of Chemistry, Indian Institute of Technology (BHU) Varanasi, India, for the continuation of financial assistance as a CSIR fellowship. The authors are thankful to the Incharge, CIFC, IIT (BHU) Varanasi for providing TEM, SEM, and XRD facilities.