Effects of the Quality of Institutions on the Economic Diversification of the States of the Economic and Monetary Community of Central Africa (CEMAC) ()
1. Introduction
The economic literature shows that the choice of institutions can be an impediment to a range of desired outcomes. In North’s (1990) sense, institutions are sets of rules of the game that structure activity by creating incentives for economic agents, which guide the dynamics of growth. These, when they are ineffective, can delay economic development ( Acemoglu et al., 2006). For Imbs and Wacziarg (2003), economic development can also fail when the economies of these countries are concentrated. Inefficient institutions and economic concentration seem to be the main characteristics of Economic and Monetary Community of Central African States (CEMAC).
Indeed, CEMAC, with the exception of Cameroon, which has a fairly diversified economy, has an economy that is essentially dependent on raw materials. This concentration of exports is on average 0.66 during the period under review Unctad (2020). This situation of the CEMAC economies prompted the United Nations Economic Commission for Africa (UNECA), a United Nations agency, at one of its meetings in 2019 to recommend that central African states should diversify their exports. Export diversification strategies, defined by Dennis & Shepherd (2011) as a broadening of the range of products that country exports, are a means for country leaders to build a more stable economy by anticipating economic cycles as well as a strategy for responding to crises when they occur ( Hendrix, 2017).
Regarding inefficient institutions, the indicators of Kaufmann et al. (2011) show that all institutional indicators of governance are almost negative for all countries ( World Bank, 2020).
In the economic literature, several theories attempt to explain the role of institutions in economic diversification. Among these theories, is the neo-institutionalist theory of development, this theory shows that political and economic institutions should facilitate productive investment. In contrast, public choice theory, by Buchanan and Tullock (1962), describes the role of the state and the behavior of voters, politicians and civil servants in the economy. Finally, governance theory explains diversification through opportunistic behavior. Empirically, all these theories have been applied, and some studies have been carried out using panel data ( Olander, 2019; Hendrix, 2017; Cortinovis et al., 2016; Gani & Prasad, 2006), while others have used time series ( Brand, 2011; Ebi & Eke, 2018).
With regard to CEMAC countries, there has been little work on the quality of institutions and economic diversification. Most studies on the quality of institutions have focused on the financial system ( Ngono & Bita, 2020), banking ( Djiogap & Song, 2016), trade ( Avom & Gandjon, 2014) and growth ( Etsiba et al., 2018). Thus, this study attempts to fill the existing void on the issue by using control of corruption and political stability as measures of the quality of institutions. The choice of these two indicators is explained by the characteristics of these countries, which, on the one hand, have a fairly high level of corruption; on the other hand, the majority of CEMAC countries have had the same political system for several decades.
In view of the above, the following question arises: within CEMAC, what are the effects of the quality of these institutions on the diversification of the economy?
The literature on the quality of institutions indicates that institutions have a positive effect on economic diversification. Thus, we formulate the following hypothesis: the quality of institutions improves economic diversification in CEMAC.
In addition to the introduction and conclusion, the second section will present the theoretical and empirical links between institutions and economic diversification. The third section will present the methodological framework, and the fourth section will present the results and their interpretations.
2. Brief Theoretical and Empirical Review of the Effects of Institutional Quality on Economic Diversification
The question of the effects of the quality of institutions on the diversification of the economy can be seen in at least three theoretical currents: public choice theory, governance theory and neoinstitutional theory.
With respect to Buchanan and Tullock’s (1962) public choice theory, they attempt to apply economic theory to political science. According to this theory, the motivation of political personnel is to maximize their own interest, which includes the collective interest. The opportunistic behavioral models developed under public choice theories are based on the assumption that politicians favor political benefits over social benefits. Under these conditions, economic diversification is unlikely to be achieved.
Next, in governance theory, the traditional approach explains diversification by the opportunistic behaviors described by public choice theorists, by intra and extra governmental distributional conflicts, and by the types of democratic or autocratic regimes. It does not include aspects related to institutions and therefore to governance in its analysis. In contrast to this approach, the new institutional approach integrates institutions into its analysis.
According to this theory, political and economic institutions facilitate productive investment. As a result, sector growth is expected to be higher in economies where the political environment is more stable, government bureaucracies are more efficient and free from political pressures, and the rule of law prevails ( Rodik et al., 2004).
The empirical literature on the link between institutional quality and export diversification is generally scarce. However, some studies have discussed this link. We will divide them into two groups: work carried out using panel data and work carried out using time series.
With regard to work carried out using panel data, Olander (2019) worked on institutional quality and export diversification in 174 countries. He showed that the more diversified an economy is, the higher the quality of institutions. Thus, the elite has less control over the country’s production.
Hendrix (2017) used an econometric model to study the correlations of the economic diversification of 40 economies, dependent on oil and natural gas, in the context of the boom. He concluded that governance plays an important role in economic diversification.
Cortinovis et al. (2016) analyzed the influence of formal and informal institutions on regional diversification using data from 118 European regions for the period from 2004 to 2012. The results of this study showed that institutions are important for regions to diversify.
Gani and Prasad (2006) examined the determinants of exports, imports and total trade using a reduced form of the equations for six institutional Pacific Island countries using a fixed-effect model with four indicators of institutional quality: government effectiveness, rule of law, regulatory quality, and control of corruption. Their results showed that improvements in institutional quality variables are important for improving levels of exports and general trade.
In contrast to the first researchers who worked with panel data, Brand (2011) studied Botswana. He found that the institutional environment can promote sectoral diversification. Thus, a good political institution and strong constraints on the executive to prevent corruption can lead to greater economic diversification.
In the same vein, Ebi and Eke (2018) examined the impact of four indicators of institutional quality on Nigeria’s export diversification using an error correction model. The authors found that institutions play an important role in export diversification.
In sum, we note that there is no unanimity in this area, and the results vary from one field of study to another.
3. Methodology
This section is divided into 6 points: the theoretical framework and specification of the model, the presentation of the model variables, stationarity, cointegration, descriptive statistics and stylized facts.
3.1. Theoretical Framework and Specification of the Model
To empirically assess the impact of institutional quality on export diversification in CEMAC countries, we opted for the methodology of Raikumar & Swaroop (2002) and Ndinga et al. (2017).
(1)
Relationship (1) indicates that the diversification of an economy’s exports 1) increases with the degree of openness in a country, 2) increases as the proportion of resources devoted to economic diversification activities increases, and 3) depends on other specific factors.
Linearizing Equation (1) yields the following equation:
(2)
where Xit is the set of factors specific to country i in period t.
(3)
By replacing relationship (2) with relationship (3), the model for estimation purposes can be written as follows:
(4)
3.2. Presentation of Variables
We distinguish, on the one hand, the explained variable and, on the other hand, the explanatory variables.
3.2.1. Explained Variable
DIVE: Export Diversification Index, which is measured by the normalized Herfindahl-Hirschman Index (HHI). An index value close to 1 indicates that a country’s exports are highly concentrated in a few products. In contrast, if the value is close to 0, exports are more evenly distributed among products ( MacBean & Nguyen, 1980).
3.2.2. Explanatory Variables
A distinction is made between variables of interest and control variables.
1) Variables of interest
The variables of interest are Kauffman’s governance indicators. Of the six indicators (corruption control, voice and accountability, political stability and absence of violence, government effectiveness, regulatory quality and rule of law), we selected two: corruption control and political stability. We chose corruption control because of the high level of corruption in the area and political stability because of the longevity of the political system in the subregion.
COCO: corruption control measures abuses by public authorities for profit, including grand and petty corruption and misappropriation of state assets by the elite. According to the literature, it has a positive effect on diversification ( Brand, 2011).
STAP: political stability measures the likelihood of the threat of violence against governments or even the likelihood of government overthrow and terrorism. According to the literature, it has a positive effect on diversification ( Cervantes & Villasenor, 2015).
2) Control variables
TRAD: the rate of openness of the economy, approximated by the sum of exports and imports divided by the gross domestic product. The expected sign of this variable is positive.
FBCF: gross fixed capital formation reflects investment expressed as a percentage of gross domestic product. Its sign is positive on diversification ( Napo & Adjande, 2019).
REER: the real effective exchange rate is a useful general indicator of a country’s international price competitiveness; its sign is positive.
3.3. Stationarity of Variables
Table 1 below presents the results of the stationarity tests of the model variables.
**significant at the 1% threshold; *significant at the 5% threshold. Source: Authors’ calculations.
This table shows that the variables concentration index, political stability, gross fixed capital formation, and commercial openness accept the alternative hypothesis of level stationarity. For the exchange rate, the hypothesis of the presence of the unit root is retained. This first-generation test has limitations, which allows us to conclude that the six variables are not level-stationary; therefore, we use the test of Im, Pesaran, & Shin (2003) and Hadri (2000).
As a first difference, the results obtained show that the six variables are integrated of order one I(1). The other stationarity tests allow us to retain the hypothesis of the absence of the unit root. This conclusion leads us to question whether the six variables are cointegrated.
3.4. Cointegration Test
The results of the cointegration test are shown in the Table 2 & Table 3 below.
The results shown in the table indicate that the variables in the model have a long-term relationship, especially since the statistics are significant at the 5%
***significant at 1%; **significant at 5%; *significant at 10%. Source: Authors’ calculations.
***significant at 1%; **significant at 5%; *significant at 10%. Source: Authors’ calculations.
level. Thus, the dynamic model can be used in our model.
3.5. Descriptive Statistics
Table 4 below presents the statistics for the variables in our study model.
Source: Authors’ calculations.
The descriptive analysis of the model variables shows us that the concentration of CEMAC countries is on average 0.668.
This figure indicates that CEMAC countries have a concentrated economy. However, there is a minimum of 0.2987195, which shows that at least one country within CEMAC, Cameroon, is less concentrated. Equatorial Guinea is the most concentrated country in the subregion, with an index of 0.9226978. This country mainly produces oil.
The share of public investment in the gross domestic product is on average 26.14072 within CEMAC. The minimum share of public investment is 13.24212, in Equatorial Guinea, and the maximum share of public investment is 59.72, in Chad.
The average trade openness of CEMAC is 93.66. The most open economy is that of Congo, at 165.64 because it imports most of its consumer goods, while the least open is that of Cameroon, at 40.36 because it is the most dynamic economy in the subregion and produces a large share of its consumer goods. The exchange rate has a stable distribution over time.
3.6. Stylized Facts
These facts relate to the evolution of the concentration index in the subregion and governance. The concentration index, which is used to obtain values between 0 and 1, is calculated according to the following formula:
where xit represents the value of the nth exported product and Xt is the total value of exports.
n is the number of products exported at the three-digit level of the SITC, Rev.3.
Graph 1 below shows the evolution of this concentration index within the CEMAC from 1995 to 2019.
Graph 1. Evolution of the export concentration index
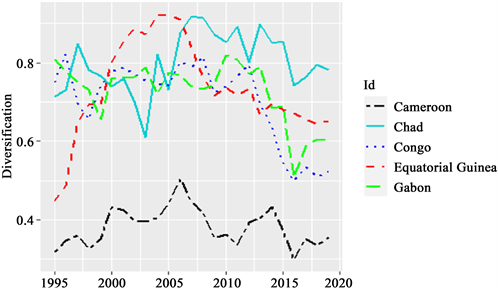
Source: Author based on UNCTAD data.
Globally, two trends emerge from the observation of this graph. The first is that of countries such as Chad, Congo, Equatorial Guinea and Gabon, whose concentration index varies between 0.50 and 0.92. The second is that of countries such as the United States and the United Kingdom, whose concentration index varies between 0.50 and 0.92. However, the closer this index is to 1, the more the economy exports only a small group of products. The CEMAC countries export oil, diamonds, wood, gold, and many other products ( Cadot et al, 2011). The second trend is represented by Cameroon alone, which has an economy with very little concentration, as its concentration index is close to zero. This confirms that Cameroon is the most diversified economy in the subregion.
Apart from this observation, the indicators of good governance in these countries during the period under review were negative, which shows that these countries generally have a governance problem.
4. Presentation and Interpretation of Results
The presentation will be followed by the interpretation of the results.
4.1. Presentation and Analysis of Results
The individual correlation matrix (Table 5 in the appendix) allowed us to summarize the dependent variables related to economic diversification over the period under review using panel data. The use of panel data, however, has advantages and disadvantages.
With regard to the advantages, the panel makes it possible to examine a large number of observations with heterogeneous information. It also makes it possible to use more data and to keep track of each observation unit.
Regarding the disadvantages, the data used become more complex, and heterogeneity appears and is not properly treated. Additionally, if the properties of the country are not observable, then the residuals will be correlated with the observations and the OLS estimators will be inconsistent ( Baltagi, 1995).
Pesaran et al. (1999) noted this problem; fixed- and random-effects estimators are extreme, or the intersections may differ between groups while all other parameters are constrained to be the same. Pesaran and Smith (1995) indicated that traditional panel model estimation procedures can produce inconsistent and potentially misleading estimates in dynamic panel data unless the slope coefficients are not identical.
Following Pesaran et al. (1999), this study uses the Pooled Mean Group (PMG) estimator technique, which will provide consistent and efficient estimates for our panel of Central African Economic and Monetary Community (CEMAC) countries. The use of this technique is explained by the fact that economic diversification will be affected by homogeneous conditions in the long run and that short-term adjustment will depend on country-specific characteristics. Pesaran et al. (1999), Pesaran & Smith (1995) and Pesaran & Shin (1998) show that the pooled mean group (PMG) estimator can make consistent and efficient estimates in the long-term relationship. According to Pesaran et al. (1999), the PMG estimator obtained is therefore consistent and asymptomatically distributed. While the Pooled Mean Group (PMG) estimator takes the form of cointegration of the ARDL model and fits it to the panel by allowing intercepts, short-term coefficients and cointegration terms differ from one section to another. For Pesaran et al. (1999), the pooled mean group (PMG) estimator has some advantages over the dynamic OLS (DOLS) and fully modified OLS (FMOLS) methods.
It allows the speed of convergence to the steady state to vary because the short-term adjustment depends on country-specific characteristics.
Thus, the estimation of our model, using the Pooled Mean Group (PMG) method, gives the results below (Table 6).
**significant at 1%; *significant at 5%. Source: Author based on data from UNCTAD, WGI and WDI.
The results show that, in contrast to Models 2 and 3, the results for the two variables of interest are significant at the 1% threshold. Thus, our analysis will be based on this model.
The ECT coefficient indicating the speed of adjustment of the variables to the long-term equilibrium should be significant with a negative sign. In this study, the error coefficients are −0.55, −0.023, and −0.644 for Cameroon, Equatorial Guinea and Gabon, respectively, and are significant at the 1% threshold.
This result implies that the deviation from long-term equilibrium is corrected by 55%, 2.3% and 64.4% each year for Cameroon, Equatorial Guinea and Gabon, respectively. This further implies that the speed of the adjustment process is reasonable for any shock to economic diversification in CEMAC countries. Thus, the results indicate that there are stable long-term relationships between the model variables in the countries under consideration.
In the short term, two variables are significant: control of corruption for Congo and political stability for Equatorial Guinea. We note that control of corruption is positive and significant for Congo. A 1% increase in corruption control leads to a 0.40% increase in concentration and therefore a decrease in diversification. This is contrary to the theory. The theory states that the fight against corruption improves the diversification of the economy. Cervantes and Villasenor (2015) pointed out that corruption control alone is not enough; a tradition of democracy and political stability is needed for corruption control to have a positive effect on economic diversification. Political stability is negative and significant at the 5% threshold for Equatorial Guinea. Thus, a 1% increase in political stability leads to a 0.136% drop in the concentration index and therefore to an increase in the diversification of the economy at the same rate. These results are in line with economic theory.
In the long term, the variables political stability and control of corruption are significant. Political stability has a positive effect on the concentration index at the 1% threshold. Thus, a 1% increase in political stability in CEMAC countries leads to a 0.43% increase in the concentration index, reducing economic diversification. These results are contrary to the theory that advocates a positive effect of governance on economic diversification. On the other hand, corruption control has a negative effect on the concentration index at the 1% threshold in the long term. Thus, a 1% increase in corruption control leads to a −0.49% drop in the concentration index and an increase in diversification, a result that is consistent with economic theory. These findings are similar to those of Brand (2011), Mauro (1995), and Ebi & Eke (2018).
Overall, in the long term, two trends seem to emerge in this analysis: on the one hand, corruption control has a positive effect on economic diversification, and on the other hand, political stability has a negative effect on diversification.
4.2. Interpretation of Results
This interpretation will focus on the two main lessons learned from the long-term analysis presented above. The first is that controlling corruption improves economic diversification, and the second is that political stability is an obstacle to economic diversification.
4.2.1. Controlling Corruption Improves Economic Diversification
Only one argument can justify this state of affairs, that is, the state of governance. Moreover, Graph 2 shows the deterioration of the corruption control index in CEMAC countries.
Graph 2. Evolution of the control of corruption indicator in CEMAC.
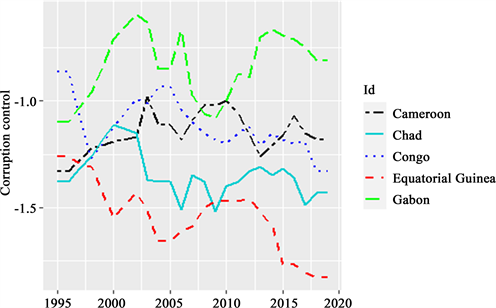
Source: Author from WGI data.
This graph shows that Equatorial Guinea and Chad are at the bottom of the list in terms of corruption control. This reflects the magnitude of the governance problem in these countries. As highlighted in the African Governance Report ( UNECA, 2016), corruption is one of the main obstacles to economic diversification in Africa. As a result, the fight against corruption is necessary if not indispensable in these countries to improve governance. This improvement in governance will improve economic diversification in these countries. For this reason, most CEMAC countries have set up national anticorruption structures. For example, in Congo-Brazzaville, the authorities have created the High Authority for the Fight against Corruption. Will the establishment of these structures reduce corruption? For Cervantes and Villasenor (2015), the answer is nuanced because they believe that states must succeed in having a long tradition of democracy and political stability in order to fight corruption effectively.
4.2.2. Political Stability: An Obstacle to Economic Diversification
The main argument we make in this section is that political stability in CEMAC is a brake on economic diversification. The evolution of political stability in CEMAC countries is represented in Graph 3 below.
Graph 3. Evolution of political stability.
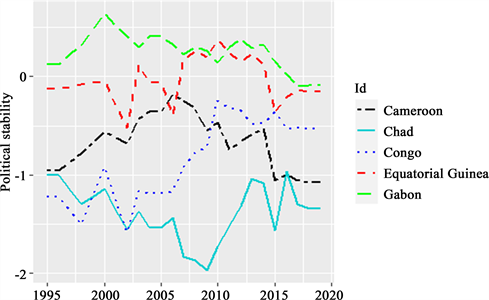
Source: Author from WGI data.
This graph shows that the political stability indicator is positive for Gabon and negative for the other four countries. This situation in CEMAC countries can be explained by the presence in these countries of political systems that have lasted for several decades. Cervantes and Villasenor (2015) noted that this longevity of the system could easily attract foreign investors who need such stability. On the other hand, the economy could suffer from the complacency, competition and opacity of this system. In this case, political stability cannot bring about the growth and diversification of the economy. Thus, not all forms of political stability are conducive to export diversification; it all depends on the extent to which stability translates into good governance.
5. Conclusion and Policy Implications
The issue of the quality of institutions in economic diversification is a concern of nongovernmental organizations, researchers and public authorities of the Economic and Monetary Community of Central Africa (CEMAC). In such a configuration, the objective of this study is to analyze the effects of the quality of institutions on the economic diversification of CEMAC states. The panel data used cover the period 1995-2019 and are extracted from the UNCTAD, WGI and WDI databases of the World Bank. The results, obtained using the Pooled Mean Group (PMG) method, show that in the short term, two variables are significant, namely, corruption control for Congo and political stability for Equatorial Guinea.
However, we can say that economic diversification is a polysemic notion and may mean different realities for each country in the zone. In the long term, corruption control has a positive impact on economic diversification, and political stability has a negative effect on economic diversification.
These findings imply that leaders of CEMAC countries should 1) Ensure political stability by adding a measure of good governance to improve economic diversification. Indeed, the need to establish stable political systems with a clear power transition system will help avoid abrupt changes in political systems. This stability must be accompanied by the rules of good governance to avoid clientelism capable of blocking the country’s development. 2) In addition, through the fight against corruption, rational policy frameworks must be adopted to effectively promote economic diversification. Indeed, CEMAC public authorities have set up anti-corruption institutions, which is beneficial for the countries’ economies. Cervantes and Villasenor (2015) pointed out that the fight against corruption will have an impact on the economy if it is associated with stability and governance.
One question remains, at the end of our study, as an avenue of research. The question is whether the establishment of good governance is a credible objective for CEMAC countries?
Appendix
Source: Authors’ calculations.