The Effect of Low Night and High Day Temperatures on Photosynthesis in Tomato ()
1. Introduction
Within a certain range, plant growth generally depends more on the mean temperature than on the diurnal temperature variation [1,2]. Temperature integration, where high day temperatures are compensated by lower night temperatures, has therefore the potential to reduce energy consumption in greenhouses [3]. This implies that the temperature is allowed to increase with increasing irradiance levels up to an acceptable maximum temperature when ventilation takes place. This is done in combination with a drop in night temperature in order to achieve an acceptable mean temperature, a drop that also reduces the heating demand. This means that energy savings of more than 20% can be achieved [4,5]. The optimal temperature for photosynthesis is known to in crease with increasing irradiance levels as well as carbon dioxide (CO2) enrichment [6,7]. The carbon dioxide exchange rate (CER) in roses was found to increase progressively up to maximum daylight conditions in a greenhouse in summer at elevated CO2 concentration, despite a temperature increase of up to 32˚C [8]. As it is much easier in practice to maintain a high CO2 concentration at higher temperatures than at lower temperatures, the high temperatures might be preferred due to higher CER at high CO2 concentrations. High day temperatures will also heat the greenhouse interior and reduce the heating costs of the following night. Most measurements of CER in greenhouse plants have been performed on single leaves, and few studies appear to have been carried out on whole intact plants under variable climate conditions [9-11]. In the present work, we therefore studied the effect of low night as well as very high day temperatures on CER on whole medium-sized tomato plants in order to evaluate the potential energy savings. Chlorophyll fluorescence measurements were included in order to detect any negative effects of the treatments on the efficiency of the photosynthetic apparatus.
2. Material and Methods
The experiments were carried out at the Centre for Plant Research in Controlled Climate, Ås (59˚40′ N; 10˚46′ E) in Norway. Seeds of tomato plants (Solanum lycopersicumcv. “Mecano”) were sown in peat in 10-cm pots, two seeds per pot. The pots were covered with transparent plastic sheeting until germination, and the weakest seedling was removed after germination. The temperature was 22˚C/20˚C during day/night. Supplementary light was applied at a photon flux density (PFD) of 200 µmol·m−2·s−1 when global radiation was below 100 W·m−2. The plants were repotted twice, in a 3-liter container after the sixth leaf developed, and in a 10-litercontainer at a plant height of 1.5 m. A peat substrate (Veksttorv, Ullensaker Almenning, Norkisa, Norway) with a pH of 5.5 - 6.0 was used in the containers. The plants were watered with a mixture of 1:1 Superba Red and Calcinite (Yara International ASA, Norway) with a conductivity of 3.5 ms·cm−1. After the plants developed the second inflorescence, the plants were transferred to the experimental conditions. The plants were watered in the morning and in the afternoon until full saturation of the substrate in order to avoid any water stress. At end of the experiments, leaf area and the fresh and dry weight of the plants were recorded.
2.1. CO2 Exchange Measurements
Gas exchange chambers were made using 1-mm thick, clear plastic with a light transmission of 95%. The diameter and height of the cylindrical gas exchange chamber was 70 cm and 200 cm, respectively. Two aluminum rings of the same diameter were used at the top and bottom of the plastic to maintain the cylindrical shape. The bottom of the cylinder was sealed tightly, while a hole in the top of the chamber functioned as an exhaust vent. An overpressure in the chamber prevented any uncontrolled leakage from the surroundings into the chambers. Each chamber was equipped with three heating units (each 200 W) in order to control night temperature in the chambers. The chambers were placed in a greenhouse compartment. Each chamber was connected to a 320 W electromagnetic air pump (Resun Model ACO-012A, China) 5 cm above the base. These pumps supplied either fresh air (about 400 µmol·mol−1 CO2) or CO2 enriched air to the chambers at an air flow rate of 210 liters per minute or 12.6 m3·h−1. An additional chamber was used to mix pure CO2 from a bottle with fresh air in order to obtain the desired CO2 concentration. It was accurately controlled by a constant air flow (electric air blower) and a capillary system for control of the CO2 flow rate. The CO2 concentration was thus controlled within ± 10 µmol·mol−1. A diaphragm pump (12 V AC) built intothe infrared gas analyzer (WMA-4 CO2 analyzer, PP systems, Amesbury, MA, USA) sampled inlet and outlet air from each chamber (1 l min−1) via flexible plastic tubing (4 mm internal diameter). Air from each sampling line was filtered by 1 - 3 mm granular silica (Merck KGaA, Darmstadt, Germany) filled in a 30-cm-long column, in addition to builtin hydrophobic air filter assembly, to ensure moisturefree clean air reached the infrared gas analyzer. Air sampling was regulated by a solenoid valve relay controller (AM416 Relay multiplexer, Campbell Scientific Inc. Logan, UT, USA) connected to a CR10WP data logger (Campbell Scientific Ltd, England, the UK). The light was measured using a quantum sensor (MQ-200 quantum sensor, Apogee Instruments Inc., Logan, USA). The sensor measured the light level every 30 seconds and recorded the means every 30 minutes. Air temperature (thermocouples) as well as air humidity (Vaisala HMP 35A sensor) was recorded in each chamber and the data stored in the Campbell logger.
System performance was tested by measuring the CO2 exchange rate in empty chambers, and system error and carbon exchange caused by potting media (peat) was corrected by measuring carbon exchange rate for containing pots filled with similar quantity of media. Gradients for temperature and CO2 along a vertical distance of 1.5 m was measured and minimized due to the high rate of air movement and turbulent mixing of air inside the gas exchange chamber.
The gas exchange was then calculated using this formula:

where Cin and Cout is inlet and outlet CO2 concentration, respectively, F is the flow rate per 20 min, Ct and Ct+20 min the measured CO2 concentration at time t and time t + 20 min, respectively, and V the volume of the cuvette [12].
2.2. Experiment 1: The Effect of different Night Temperatures on CER
The effect of three night temperatures (10.8˚C ± 0.7˚C, 15.0˚C ± 0.9˚C, and 18.1˚C ± 0.7˚C) on CER was studied at a PFD level of 200 µmol·m−2·s−1 (11.5 mol·m−2·day−1) supplied by high pressure sodium lamps (Powerstar® HQI®-BT 400W/D, Osram, the Netherlands) 16 h day−1 (Experiment 1A). One plant was placed in each of three chambers, and all daylight was excluded by aluminized curtains. The day temperature was the same in the three chambers and varied between 20˚C and 23˚C with a peak in the middle of the photoperiod (Figure 1). The CO2 concentration was 388 ± 10 µmol·mol−1. The vapor pressure deficit (VPD) during the day was 700 ± 150 Pa in the three different treatments. During the night, VPD was 410 ± 170 Pa, 490 ± 130 Pa, and 650 ± 170 Pa for the low, intermediate and high night temperatures, respectively. The experiment was carried out over a period of 11 days. The total leaf area at the end of the experiment was 1.79 m2 (21 leaves), 1.78 m2 (21 leaves), and 2.12 m2 (22 leaves) for the plants grown at 10.8˚C, 15.0˚C, and 18.1˚C night temperatures, respectively. Days were used as replicates.
In Experiment 1B, the effect of night temperature on CER was studied in daylight from 5 until 18 March. Supplementary light was given at a PFD of 200 µmol·m−2·s−1 when the global radiation fell below 200 W·m−2 (measured at the top of the greenhouse with a pyranometer
 (a)
(a)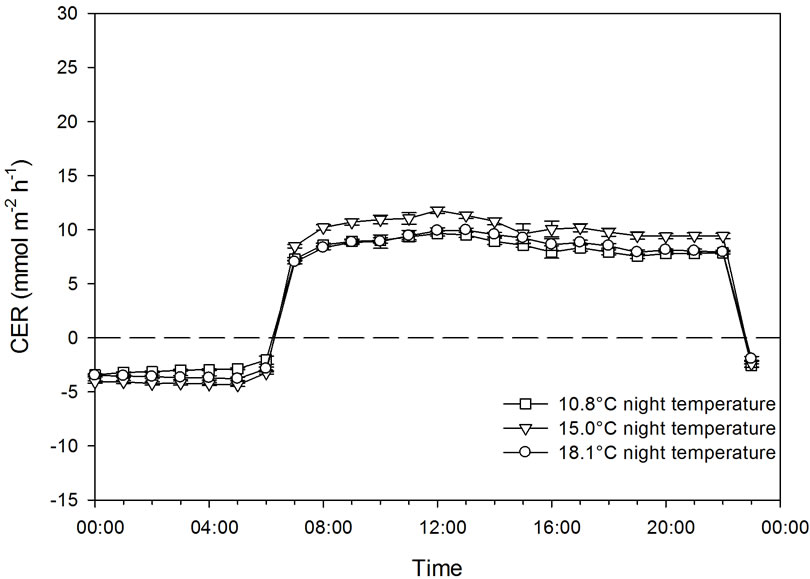 (b)
(b)
Figure 1. The temperature course (a) and carbon exchange rate (CER) (b) of plants grown at night temperatures of 18.1˚C, 15.0˚C, and 10.8˚C under artificial light conditions of 200 µmol·m−2·s−1 PFD. Bars indicate Standard Deviation for the climate data and Standard Error for CER data, n = 11.
CMP 6, Kipp & Zonen, Delft, the Netherlands, connected to a Priva greenhouse computer, De Lier, the Netherlands) within the photoperiod of 16 h. In this experiment, the number of chambers per treatment was extended to two because more chambers become available. The night temperature was 10.0˚C ± 1.4˚C, 13.3˚C ± 0.4˚C, and 18.3˚C ± 0.7˚C, while the day temperature varied between 20˚C and 26˚C in all chambers (Figure 2). The natural day length was 11 - 12 h, and the mean PAR was 15.5 ± 2.7 mol·m−2 day−1 including the artificial light. The CO2 concentration was 415 ± 8 µmol·mol−1. The plants were grown in peat in 5-liter pots. At the end of the experiment, the plants had 17.1 leaves in average, and the average leaf area of the plants was 1.18 ± 0.11 m2. Days were used as replicates. During the day, VPD was 660 ± 320 Pa and 760 ± 480 Pa for plants grown under 10.0˚C and 13.3˚C, respectively. During the night, the
 (a)
(a) (b)
(b)
Figure 2. The temperature course (a) and the carbon exchange rate (CER) (b) of plants grown at night temperatures of 18.3˚C, 13.3˚C, and 10.0˚C under natural daylight conditions with a daylight extension of HPS lamps. Bars indicating Standard Deviation for the climate data and Standard Error for CER data (n = 28).
corresponding VPD was 190 ± 150 Pa and 260 ± 140 Pa. An air humidity of 18˚C was not available in this experiment.
2.3. Experiment 2: The Effect of CO2 Concentration on CER under Summer Conditions
In the second experiment, four chambers were used with one plant per chamber (Experiment 2A). The experiment was carried out from 28 June until 13 July (16 days) at 398 ± 31 µmol·mol−1 CO2, and a photoperiod of 17.5 h. In the presentation, days with very cloudy weather (maximum PFD < 250 µmol·m−2·s−1) were excluded (total of 5 days). The mean maximum PFD during the days included was 924 ± 175 µmol·m−2·s−1, and the mean maximum temperature was 40.9˚C ± 3.2˚C (Figure 2(a)).The mean PAR was 20.3 ± 5.6 mol·m−2·day−1. The mean night temperature was 21.5 ± 2.0˚C. Vapor pressure deficit was 555 ± 300 Pa during the day and 320 ± 140 Pa during the night. The leaf area at the end of the experiment was 2.36 ± 0.29 m2, and the number of leaves was 23.
A similar experiment was carried out at 1016 ± 99 µmol·mol−1 CO2 from 25 July until 1 August (8 days) (Experiment 2B). All days were included in the presentation of the results due to relatively sunny weather during this period. The mean maximum PFD was 1016 ± 99 µmol·m−2·s−1, and the mean maximum temperature 44.6˚C ± 2.5˚C. The mean PAR was 22.8 ± 2.8 mol·m−2·day−1. The mean night temperature was 21.5˚C ± 2.0˚C. The vapor pressure deficit was 550 ± 360 Pa during the day and 210 ± 140 Pa during the night. The leaf area at the end of the experiment was 2.37 ± 0.24 m2, and the number of leaves was 22.5 ± 1.3.
2.4. Experiment 3: The Effect of CO2 Concentrations on CER under Early Autumn Conditions
The effect of CO2 concentration (386 ± 74 and 1009 ± 64 µmol·mol−1) on CER was studied from 27 September until 9 October (12 days) in two chambers containing one plant each at both concentrations. Due to poor daylight conditions, four days were excluded from the presentation of the results. The mean maximum PFD was 626 ± 121 µmol·m−2·s−1, and the mean maximum temperature was 35.8˚C ± 3.4˚C at low and 38.1˚C ± 2.7˚C at high CO2 concentration. The mean night temperature was 18.5˚C ± 2.5˚C. The mean PAR was 10.2 ± 2.8 mol·m−2 day−1.
The vapor pressure deficit was 540 ± 260 Pa during the day and 410 ± 160 Pa during the night at low CO2 concentration, and 600 ± 280 Pa and 360 ± 170 Pa respectively, at high CO2 concentration. The leaf area at the end of the experiment was 2.03 ± 0.27 m2 at low and 2.04 ± 0.02 m2 at high CO2 concentration, and the number of leaves was 22.5 ± 1.3 in both treatments.
2.5. Experiment 4: Chlorophyll Fluorescence Measurements
Plants from Experiment 1B that had been grown for 13 days under different night temperatures (10.0˚C, 13.3˚C, and 18.3˚C) were used to measure chlorophyll fluorescence using a portable chlorophyll fluorometer (Plant Efficiency Analyser PEA; Hansatech Instruments, Norfolk, the UK). The two upper leaves of two plants per treatment were used. The fluorescence was measured after dark adaptation of 30 minutes and by using excitation light of about 1500 µmol·m−2·s−1. The maximal photo system II efficiency (Fv/Fm) was calculated according to Maxwell and Johnson [13]:

In addition, the maximum quantum yield (ΦPSII) as well as the electron transport rate (J) were measured in plants from Experiment 3 grown under two CO2 concentrations (385 µmol·mol−1 and 1000 µmol·mol−1) during 12 days with high maximum day temperatures. Plants kept in the greenhouse at 22˚C ± 1˚C/20˚C ± 1˚C day/ night temperature at 400 µmol·mol−1 CO2 were used as control. Before measurement, the plants were adapted to the dark for ten minutes after a low-light period of 10 µmol·m−2·s−1. The steady-state fluorescence was measured at a light intensity of 320 µmol·m−2·s−1, and after 300 s, the minimum fluorescence level of the light-adapted leaf was measured immediately after the actinic light phase by illuminating the leaf with far-red light. Five measurements on the upper leaves of two plants per treatment were measured. The chlorophyll fluorescence was measured using a PAM2000 (Heinz Walz GmbH Messund Regeltechnik, Effeltrich, Germany).
The quantum yield of PS II electron transport (ΦPSII) was calculated using the equation of Genty et al. [14]:

The electron transport rate (J) was calculated using the formula of Genty et al. [14]:

2.6. Statistical Analysis
Minitab 16 Statistical Software (Minitab Inc., 2010, State College, PA, USA) was used to analyze the results from Experiment 1 - 3 with a One-Way Analysis of Variance. The data obtained for chlorophyll fluorescence were analyzed using a General Linear Model. The regression analysis was done by using a Fitted Line Plot with CER as response and the light level as predictor in a Cubic Regression Model.
3. Results
3.1. Experiment 1
The effect of decreasing the night temperature from 18.1 to 15.0˚C or 10.8˚C in Experiment 1A had no effect on CER during the light period when the plants were grown under 200 µmol·m−2·s−1 PFD (Figure 1). Relatively small differences were observed in respiration during the night between the treatments in this experiment. Similar results were obtained for a combination of daylight and artificial light (Experiment 1B), when the night temperature was decreased from 18.3˚C to 13.3˚C or 10.0˚C (Figure 2). Respiration was somewhat higher during the night in this experiment at 18˚C compared to 13˚C and 10˚C.
3.2. Experiment 2
The temperature in Experiment 2A (385 µmol·mol−1 CO2) increased progressively with increasing PFD levels (r = 0.895, p < 0.001) as the light heated the chamber air (Figure 3(a)). Since these two climate factors were closely interrelated, the correlation between PFD and CER (r = 0.892, p < 0.001) was also reflected in the correlation between temperature and CER (r = 0.851, p < 0.001). In the analysis, a one-hour delay was taken into account on the effect of PFD on recorded temperature. Maximum CER was reached at 400 - 500 µmol·m−2·s−1, PFD at a temperature of around 35˚C, while a further increase of up to about 800 µmol·m−2·s−1 PFD/41˚C did not change the CER (Figure 4).
The correlation between PFD and temperature in Experiment 2B (about 1000 µmol·mol−1 CO2) showed the same pattern as in Experiment 2A (r = 0.904, p < 0.001). The correlation between PFD and CER (r = 0.898, p < 0.001), and temperature and CER (r = 0.887, p < 0.001) was therefore quite similar. CER increased with increasing PFD and temperature up to the highest measured levels of about 1000 µmol·m−2·s−1/45˚C. The maximum CER at high CO2 concentration was almost double that reached at low CO2 concentration (Figures 3(b) and 4).
3.3. Experiment 3
In this experiment, PFD increased from 0 to about 550 µmol·m−2·s−1 as the mean maximum level at the same time as the temperature increased from about 17˚C to about 35˚C (Figure 5). At ambient CO2 concentration, CER increased as the PFD/temperature increased up to around 400 µmol·m−2·s−1/30˚C, while CER further increased up to a maximum of around 600 µmol·m−2·s−1/ 35˚C (Figures 5 and 6) at high CO2 concentration. The maximum measured CER increased 90% as a result of CO2 enrichment. There was a significant correlation between CER and PFD both at low (r = 0.914, p < 0.001) and high CO2 concentration (r = 0.937, p < 0.001). As PFD and temperature were highly correlated (r = 0.912, p < 0.001), CER and temperature were also closely related (r = 0.908 − 0.911, p < 0.001).
3.4. Experiment 4
The maximum quantum yield (Fv/Fm) of plants grown at different night temperatures was found to be unaffected by decreasing the night temperature from 18.3˚C to 13.3˚C or 10.0˚C (Table 1). The quantum yield of PSII (ΦPSII) as well as the linear electron transport rate (J) was unaffected by high maximum temperatures both at low and high CO2 concentrations (Table 2).
4. Discussion
The results clearly show that daily photosynthesis was not negatively affected by night temperatures of down to about 10˚C. Photosynthesis in tomato plants exposed to 1˚C for 16 h in darkness has been shown to be reduced by 37% when exposed to a subsequent light period [15]. Tomato plants grown at a night temperature of 4˚C for 10 h showed a negative effect on photo system II, which reduced net photosynthesis [16]. It was concluded that such an effect can occur at temperatures of as high as around 10˚C, but then only to a slight degree. It should also be noted that the accumulation of photosynthetic

Table 1. The maximum quantum yield (Fv/Fm) as affected by night temperature in Experiment 1B (n = 4, ± SD).

Table 2. The maximum quantum yield (Fv/Fm), the linear electron transport rate (J), and the efficiency of photosystem II photochemistry (ΦPSII) in plants exposed daily to high maximum temperatures at 385 µmol·mol−1 (low) and 1000 µmol·mol−1 CO2 (high) in Experiment 3. Plants grown at 385 µmol·mol−1 CO2/20˚C - 22˚C were also included (n = 10, ± SD).

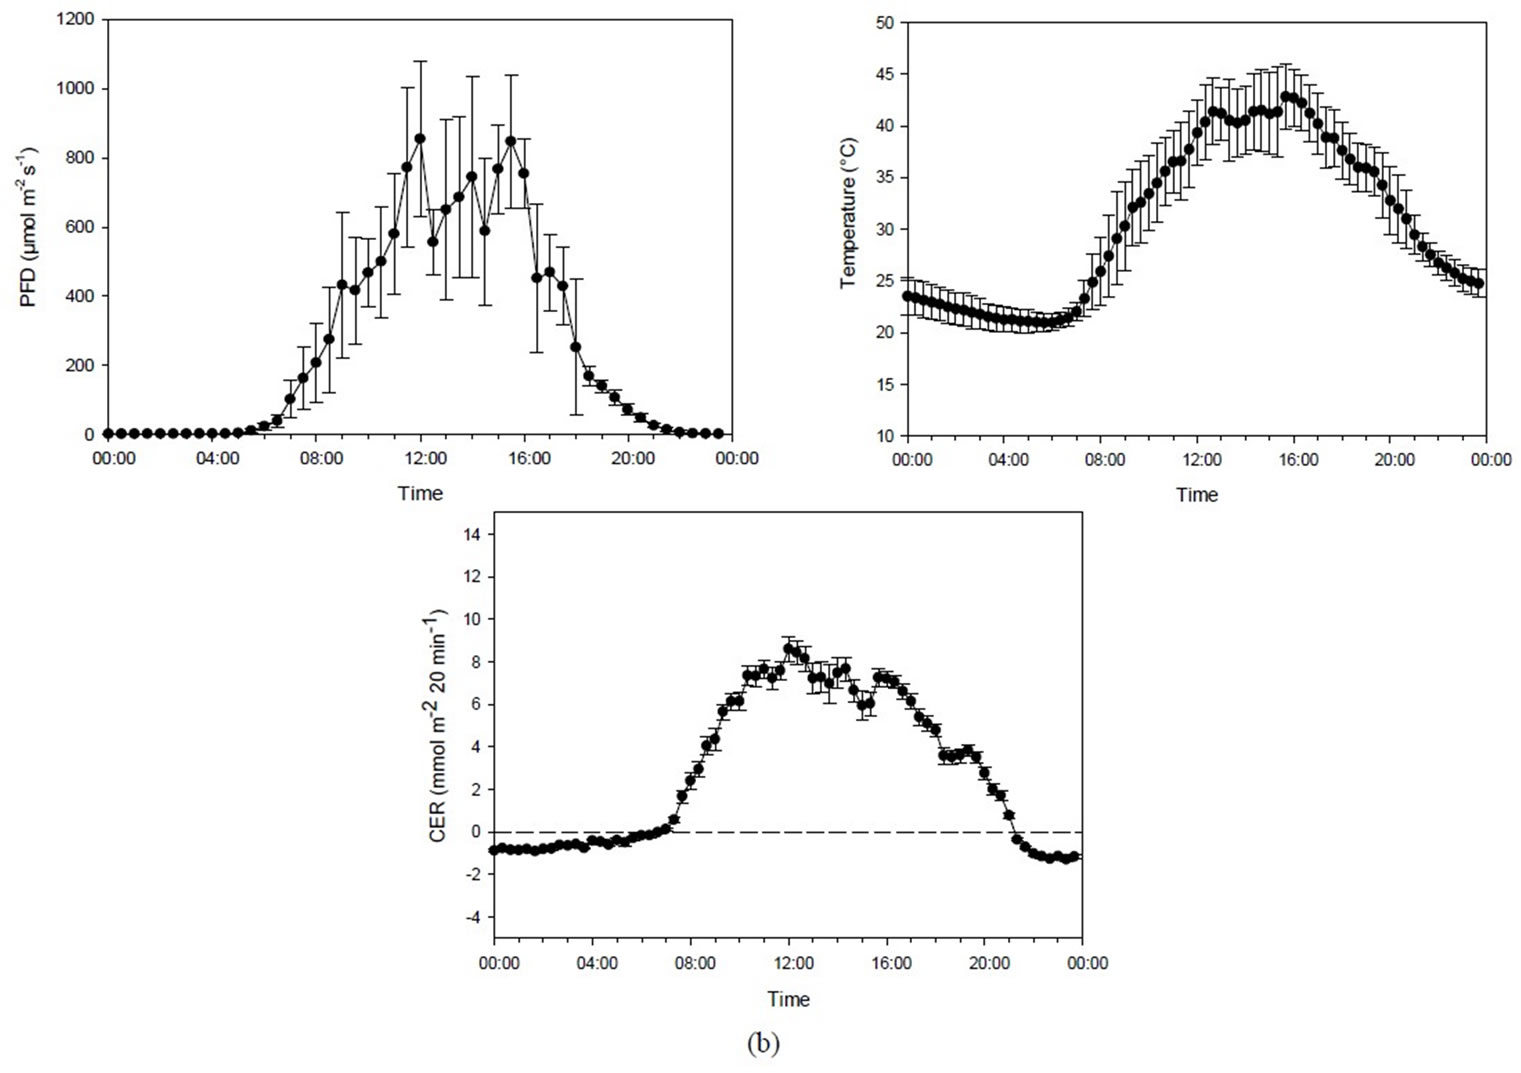
Figure 3. (a) Diurnal photon flux density (PFD), temperature and carbon exchange rate (CER) in mmol·m−2 20 min−1 for plants grown under mid-summer conditions at ambient CO2 concentration (398 ± 31 µmol·mol−1). Bars indicating Standard Deviationfor PFD and temperature andStandard Error for CER data (n = 44). (b) Diurnal photon flux density (PFD), temperature and the carbon exchange rate (CER) in mmol·m−2 20 min−1 for plants grown under mid-summer conditions at high CO2 concentration (1016 ± 99 µmol·mol−1). Bars indicating Standard Deviationfor PFD and temperature and Standard Error for CER data (n = 32).

Figure 4. Relationship between photosynthetic flux density (PFD) and CER for plants grown under mid-summer conditions at ambient CO2 (, R2 = 0.931) and at elevated CO2 (p, R2 = 0.881).
end-products in the cells can result in reduced photosynthetic rates [17]. Such a situation arises particularly when plants are grown under good light conditions at low temperatures. Long, dark periods with low temperatures in connection with a relatively low day temperature may thus result in end-product accumulation and reduced photosynthesis [18-20]. This was probably the reason for lower photosynthetic rates in tomato plants grown at 16˚C/14˚C (day/night) than in plants grown at 25˚C/20˚C (day/night) [21]. In the present experiment in which day temperatures reached 23˚C - 25˚C, resulting in a relatively high mean temperature, such negative effects did not seem to take place even at night temperatures down to 10˚C. As CER was not affected, it was no surprise that the quantum yield as measured by chlorophyll fluorescence was also unaffected by the low night temperatures in the present experiment.
Increasing the irradiance level up to the maximum experienced in a greenhouse during summer at high latitudes (about 1000 µmol·m−2·s−1 PFD), increased the CER despite temperatures rising up to 40˚C - 45˚C as long as the CO2 concentration was maintained at a high level. Although the CER increase stopped at a lower PFD level at ambient CO2 concentration, a temperature increase of up to 40˚C did not decrease the CER. Similar results were obtained under early autumn conditions although both the PFD and temperature reached lower levels. These results are in accordance with the conclusions of previous CER measurements in cucumber and roses [8, 22]. It therefore seems that the PFD level is the main factor determining the CER of the plants, and not the temperature within a certain range. As long as the CO2 concentration is kept high, temperatures of up to about 40˚C - 45˚C did not seem to pose any problem because of the high PFD level. At lower CO2 concentrations, however, the negative effect of temperatures above 35˚C
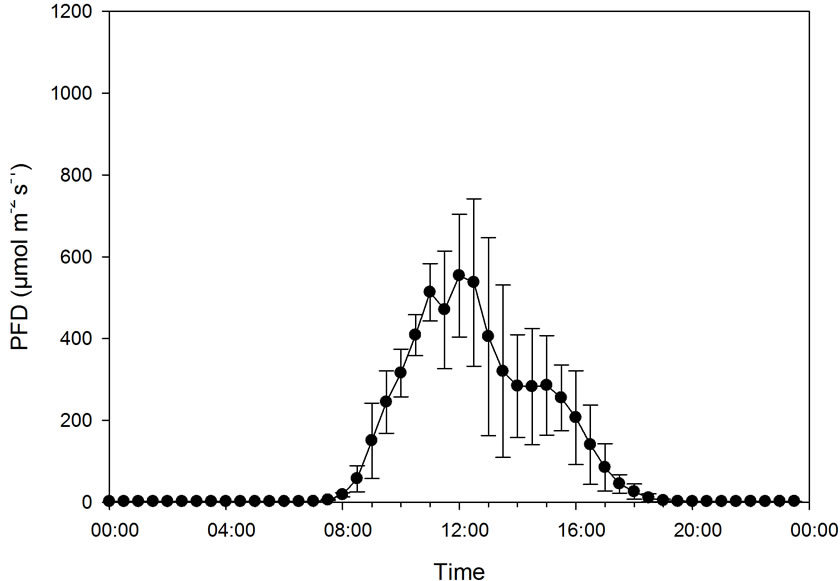

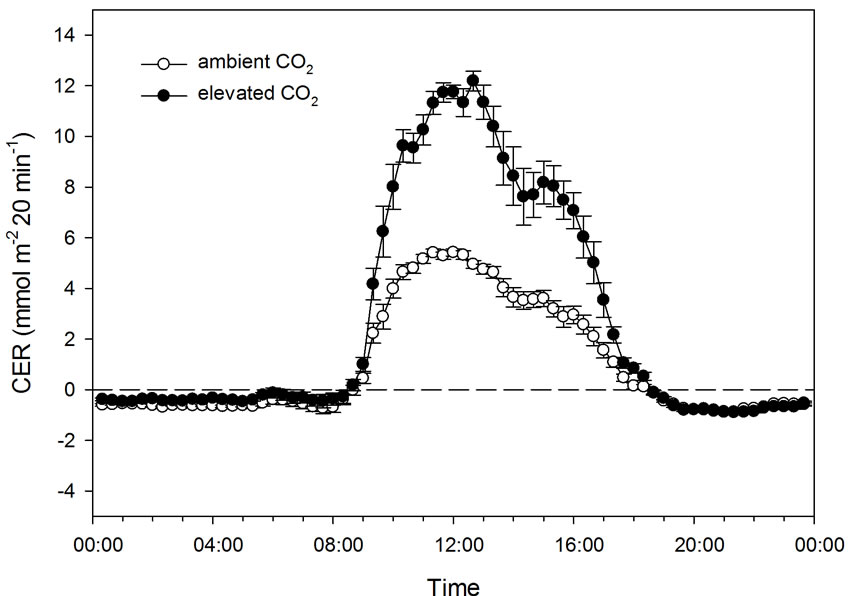
Figure 5. Diurnal photon flux density (PFD), temperature and carbon exchange rate (CER) in mmol·m−2 20 min−1 for plants grown under early autumn conditions at ambient (386 ± 74 µmol·mol−1) and elevated CO2 level (1009 ± 64 µmol·mol−1). Bars indicating Standard Deviation for PFD and temperature and Standard Error for CER data (n = 32).
probably counteracted the positive effect of an ever increasing PFD level. The positive effect of high CO2 concentrations on photosynthesis is known to be related to a reduction in photorespiration in plants, a process that increases with rising temperatures [23-25]. It is therefore generally accepted that the optimal temperature for photosynthesis is increased by CO2 enrichment as well as by

Figure 6. Relationship between photosynthetic flux density (PFD) and CER for plants grown under early autumn conditions at ambient CO2 (, R2 = 0.886) and elevated CO2 (p, R2 = 0.914).
increased irradiance levels [7,26].
Smillie and Gibbons [27] showed that the maximum temperature for a detectable electron flow through photosystem II in tomato was 45.3˚C. Murkowski [28] found a decrease in photosystem II activity in tomato at 38˚C. In the present experiment, the linear electron transport rate and the efficiency of PSII were unaffected by the high maximum temperatures as well as the CO2 concentration, in accordance with the CER measurements that remained at the same level after several days of daily exposure to high temperatures. Heat damage on the photosynthetic apparatus depends both on light intensity and the duration of the high temperature [29]. Camejo et al. (2005) found that tomato leaves that were treated for 2h at 45˚C showed a 50% reduction in the CO2 assimilation rate. Taub et al. [30] concluded that a high CO2 concentration protects photosynthesis against high-temperature damage, and Percival et al. [31] found that whole plants have a lower sensitivity to temperature than singleleaves. In the present experiments, including intact plants with 20 - 23 leaves, the duration of the very high temperatures was restricted to a relatively short daily period. An extension of this period, however, may have been injurious particularly to the plants grown at low CO2 concentration.
It was recently found that maximum day temperatures of up to 32˚C compared to 24˚C resulted in the same total dry weight production when tomato plants were exposed to PFD levels of up to a maximum of about 1000 µmol·m−2·s−1 in CO2 enriched air [32]. However, the marketable tomato yield was reduced by the high temperature probably as a result of an increase in the mean temperature. The high day temperatures should therefore be compensated by lower night temperatures in order to obtain an acceptable mean temperature. The present results indicate that this is possible as night temperatures down to about 10˚C did not appear to have a negative effect on photosynthesis. This must, however, be tested in practice since high CER will not necessarily result in a higher yield and processes such as pollination and fruit development may be significantly affected [33].