Recovery Process on Soft-Bottom Macrobenthic Communities after Artificial Disturbance in Tropical Polluted Estuary (Guanabara Bay, Rio de Janeiro, Brazil) ()
1. Introduction
The soft bottom benthic communities are considered good indicators of the ecological status of marine ecosystems and its structure can be considered a powerful tool for monitoring changes in the environment over time [1]. Benthic communities are often subjected to natural and artificial perturbations, which depending on the intensity can lead to the total or partial defaunation. These disturbances are uncommon and irregular events that cause abrupt change in the community structure and they move them from the near equilibrium stage to and put it in an early succession stage [2]. The origin of disturbance can be either natural such as storms and currents or anthropic interference such as dragging, pollution and bottom trawling [3,4]. Also, it can be the result of a biological interaction as, for example: predation, recruitment, food availability [5] and bioturbation [6].
The spatial and temporal heterogeneity in the disturbance regime can lead to a mosaic of patches. Thus we can observe a habitat with parts of the community at different stages of succession [7]. These patches are coupled by migration. In this system local extinctions are balanced by the migration of organisms from other patches [8]. The new patches are seen as new possibilities to the settlement of organisms in different stages of life [7]. The time to recovery and the composition of the new community will vary according to the 1) persistence of the impact including changes in the system productivity, habitat integrity and persistence of the stressor; 2) life history of the organisms including generation time, emergence time and propensity; 3) time of the year when disturbance happens and 4) distance of source colonization [9].
The first organisms to settle (pioneers) have some specific characteristics such as high reproductive rate, high dispersion capacity, tolerance to the new environment conditions and early maturation. These features enable them to rapidly colonize newly available habitats and establish a large population within short time [10]. The pioneers have another really important role, they can change the sediment properties in different ways for example by inter-particle adhesion, grain size distribution through the formation of fecal pellets, sorting water content and bed roughness and these, in turn, may alter the stability of the sediment mainly the fluid forces [11] and these alterations are crucial for the settlement of new organisms. For a certain period of time the pioneers will dominate the area but after they are going to be slowly changed by others organism that will better use the resource present in the patch after all the transformation done by the first colonizers [12].
For some species physical features of the sediment (roughness, texture, oxygenation and bottom water circulation) are important for the settlement colonizers [12]. For others the chemical features such as salinity and nutrients or biological interactions (predation and competition) are more important [13]. However, the opportunistic species don’t have higher selectivity when they are going to settle [14]. In this case any patch can be colonized and the biotic and abiotic factors will acquire importance after the settlement [15]. The aim of this study is to follow how the soft bottom community will respond to the artificial disturbance, the sterilization of the sediment, describing the initial steps of the succession process in a tropical polluted estuary.
2. Material and Methods
The study area is located in Guanabara Bay (Rio de Janeiro, Brazil) between the coordinates 23˚00'S and 43˚00'W (Figure 1). The location was chosen because it is a protected area form the bottom trawling fishing that it is a normal economic activity in the region. The water circulation is composed by gravitational and residual tidal circulation. The tide is mixed and mainly semidiurnal. The salinity vertical stratification is moderated to weak [16]. The experiment was carried out for two months from November 2009 to January 2010.
The sediment collection was done using scuba diving operator hand-held PVC corers. We collected 40 liters of sediments that were sterilized using a microwave in the
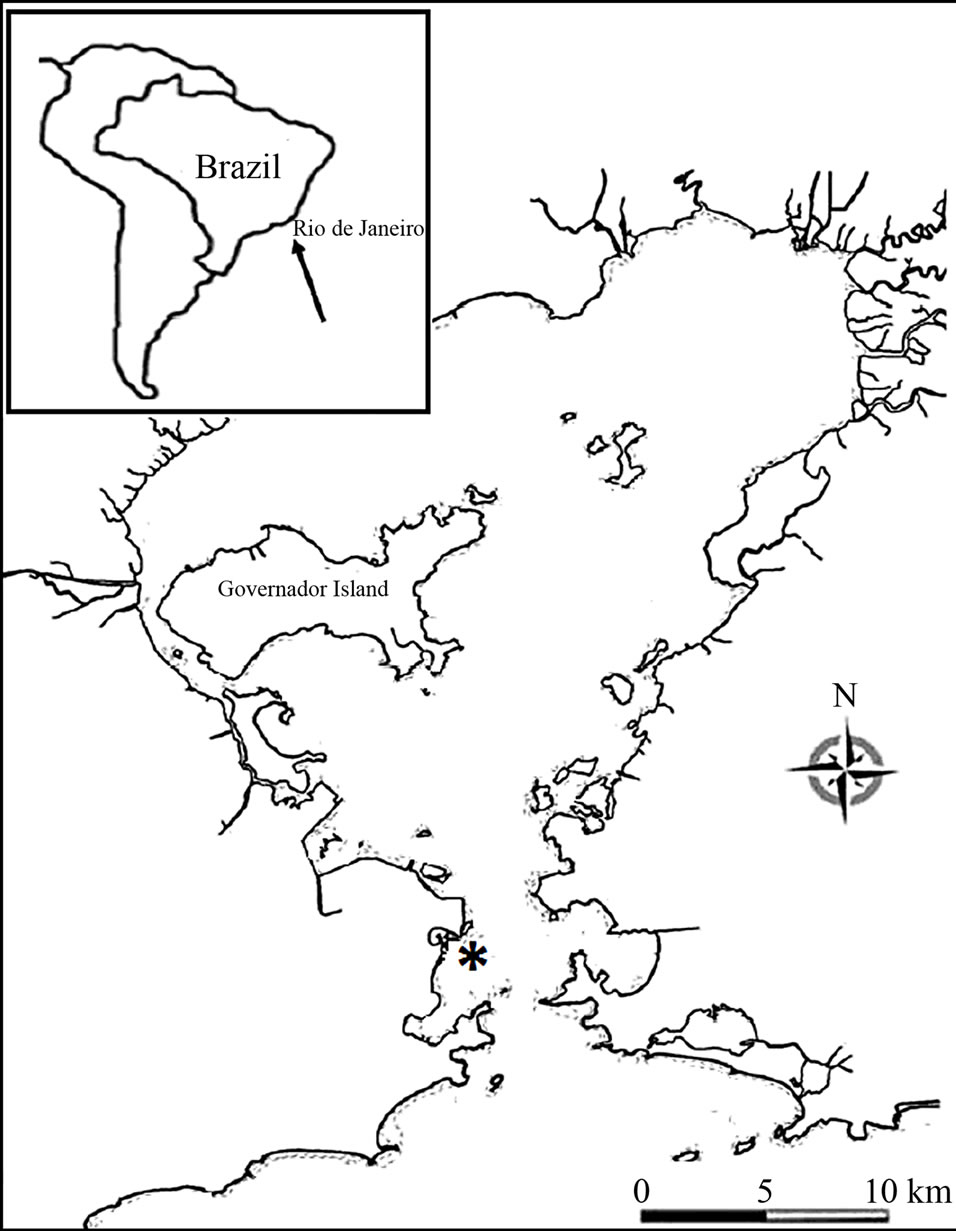
Figure 1. Study area (*) showing the location of experiment of the Guanabara Bay.
highest power for 7 minutes and we preserved it in small corers (samples) capped with the capacity of 500 ml. We developed two steel structures each one could hold 30 samples. These structure were fixed in the bottom, the steel structure was fixed up 50 cm high from the bottom (treatment one—T1) and another structure fixed on the bottom (treatment two—T2) and to check if they were able to produce two different microcosms in this way having different succession patterns. During the experiment six samples were collected from each structure and five were collected from the surrounding area with PVC cores within the same surface area (10 cm diameter/0.008 m2) from the corers, these samples worked as the control (CT). The intervals between the surveys were approximately 10 days except from the fourth to the fifth survey that the interval was 20 days.
In laboratory the sediment collected was washed through a 0.5 mm sieve and the fauna retained was preserved in 70% alcohol. Organisms were sorted, classified and counted from the residual under stereomicroscope.
We calculated the diversity using the Shannon’s Diversity Index (H’) for each sample and used the data to compare the differences between treatments (T1 and T2) and control (CT), and survey in the same treatment along the time using ANOVA with posterior Turkey Test. The abundance and composition of species were used to check if the two treatments were able to represent to different microcosms.
3. Results
During the time of the experiment we identified 2352 organisms (distributed in the 14 groups/taxa).
The most abundant groups were Crustacea and Polychaeta and they accounted for 67.02% and 32.21% of the total of organisms respectively. The phyla Echinodermata, Mollusca and Chordate contributed just with 0.21%, 0.38% and 0.17% respectively. The subphylum Crustacea was represented by the groups: Amphipoda, Cumacea, Decapoda, Isopoda, Caprellidea, Ostracoda, Cirripedia and Paguroidea. The order Amphipoda was the most abundant between the Crustacea, it contributed 92.1% of the total of organisms in the subphylum. The suborder Caprellidea and Cirripedia were excluded from the analyses because of their habits, Caprellidea lives associated with algae, briozoos and ascidian [17,18] and Cirripedia needs a hard surface to settle [19]. The phylum Mollusca was just found in the T2.
The abundance in the T1 and T2 increased along the experiment time while in the CT it was almost constant in all the samplings (Figure 2). However, T1 the abundance was always higher than in the T2 but this difference was not enough to say that the treatments worked in the same way during all the experiment time when we talk about diversity (p > 0.05). The dominant groups in the T1 was Amphipoda, in the T2 and in the CT the group Polychaeta was the dominant (Figure 3).
In all the treatments, the maturity stage (evaluated by presence of eggs) and size of the organisms indicated that recolonization must have been done by adults from the surrounding patches, hypothesis supported through of the rapid recolozation for adults (metapopulation dynamics, see [20]).
In the T1 the recolonization was done mainly by Polychaeta and Amphipoda, the other organisms present in this treatment were mainly from the crustacean groups: Cumacea, Decapoda, Isopoda, Tanaidacea and Ostracoda.
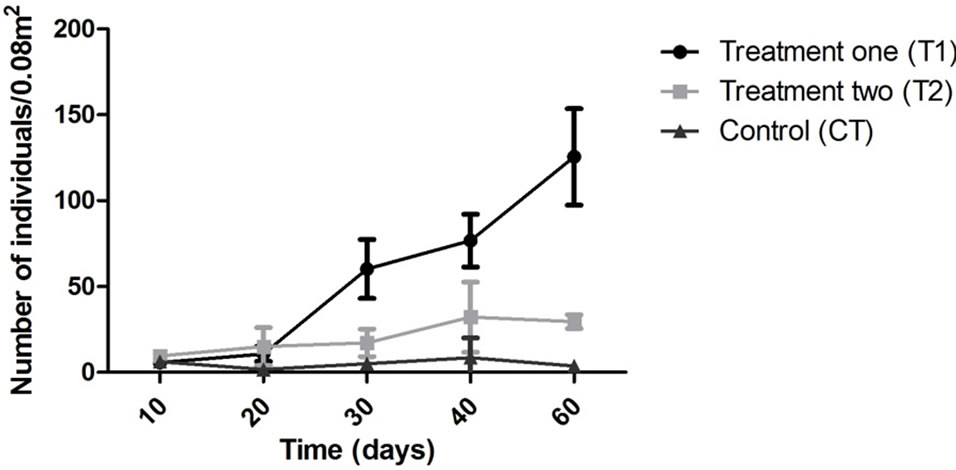
Figure 2. Abundance of organism/0.008 m2 during all the experiment time. T1: structure elevated (50 cm)/T2: structure located on the bottom/CT: control.
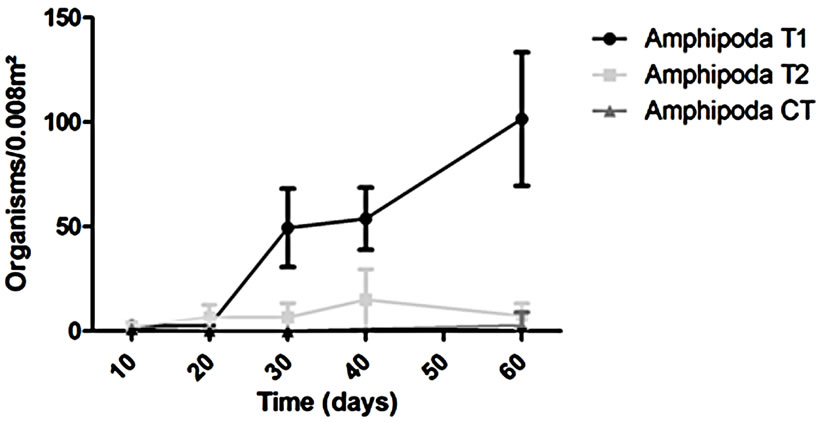
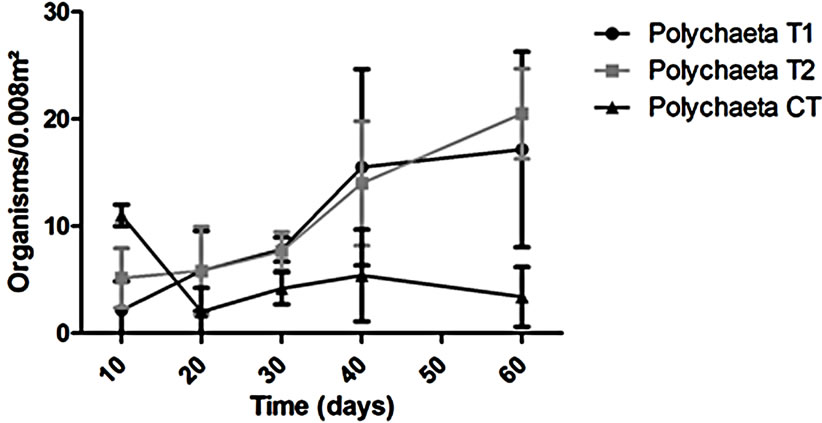
Figure 3. Variation of the dominant groups (Amphipoda and Polychaeta) during the experiment.
Yet we could find different organisms as Amphioxus and Ophiuroids in the later samplings. An interesting fact is how the balance between the species varied (Figure 4). Some groups had a high abundance in the beginning (e.g. Cumacea) and after it seems to be replaced for other groups such as Decapoda.
T2 we observed a similar pattern in recolonization when we compare to the T1. The recolonization seems to have been done mainly by Polychaetes and Amphipods. In addition, we could find different organisms: bivalves, gastropods, hermit crabs and ostracods. However, CT we couldn’t find organisms that we identified in the treatments such as bivalves, decapods, hermit crabs and Tanaids. Conversely, the groups observed in the CT were different. For example we exclusively found Sea Urchins (Echnoidea) (Figure 4).
The diversity (Figure 5) index was similar in the treatments (p > 0.05) and the CT had a significance difference from the two treatments (p < 0.05; T1 vs CT, q = 8.2 and T2 vs CT, q = 10.58).
4. Discussion
In our data we could follow the initial steps of recolonization and understand more about the process that comes after disturbance. Our results show that the exchange of individual between areas is a more important way to maintain the diversity and recover the fauna of damage patches in this environment than the recolonization for young individuals. Another important fact observed is that the individuals come mainly from areas that are not in the surrounding region due to the difference in the group composition between the CT and the treatments (T1 and T2).
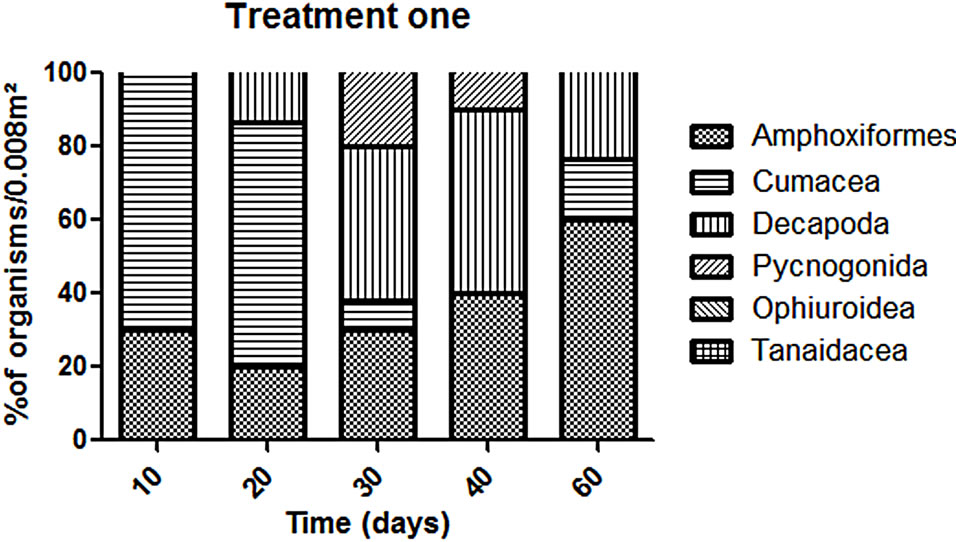
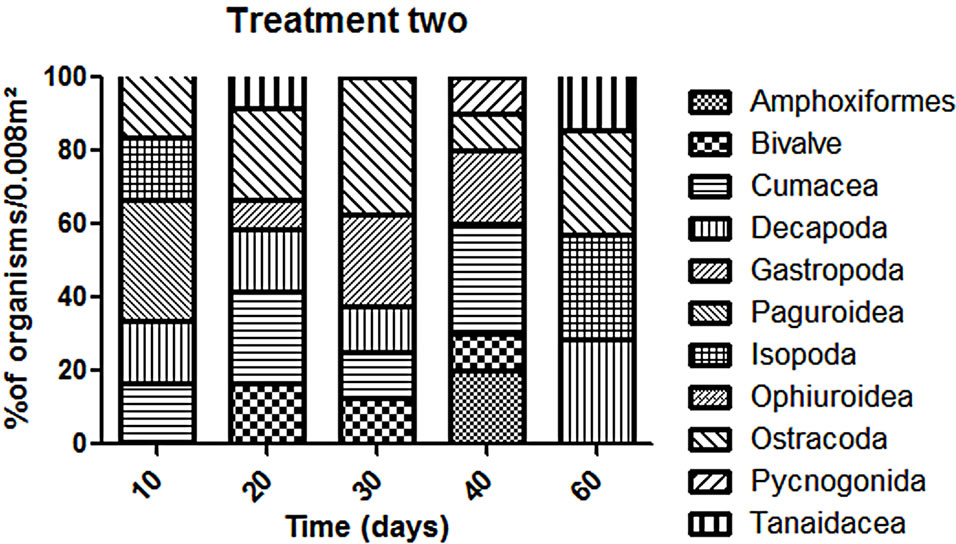
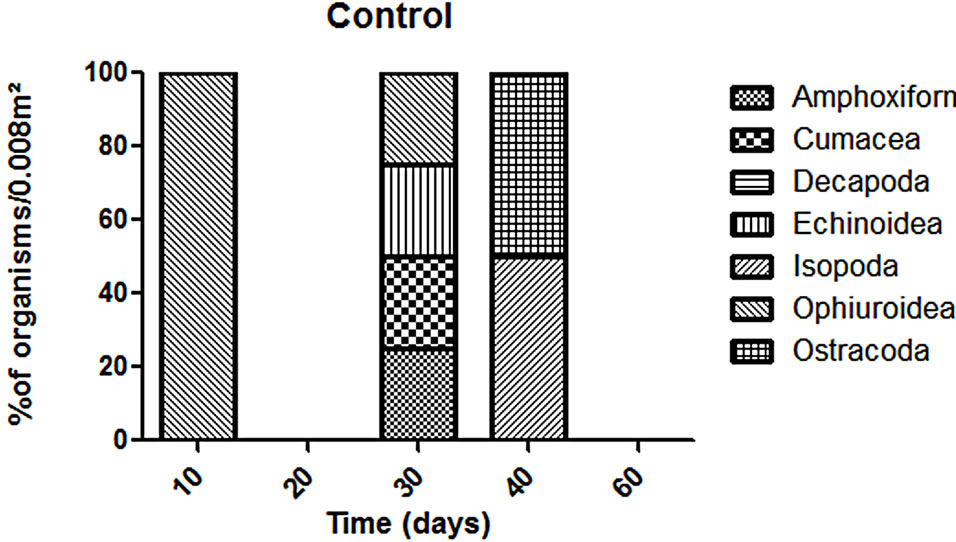
Figure 4. Variation of organisms (% organisms/0.008 m2) in each treatment without the dominants groups (Polychaeta and Amphipoda).
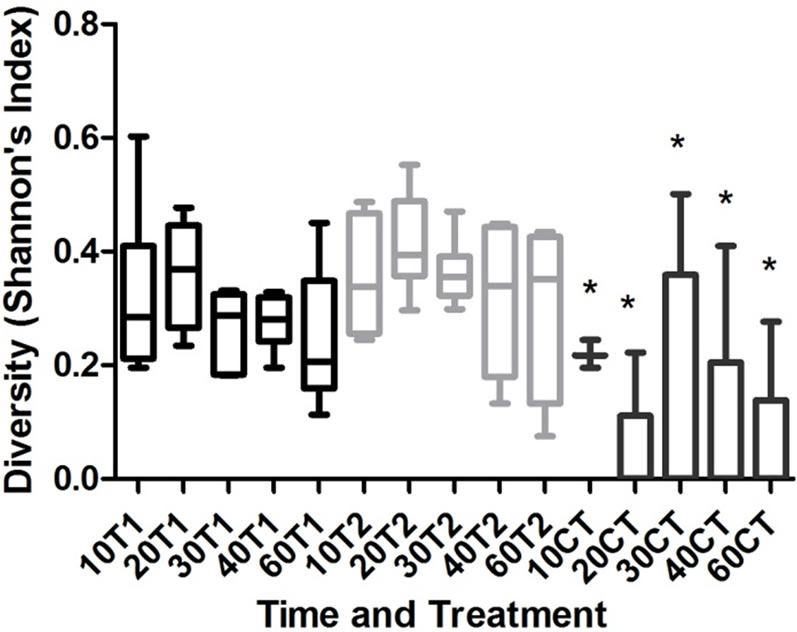
Figure 5. Shannon Diversity Index (H’) for each treatment (T1 and T2) and control (CT) during the samplings (10/20/ 30/40 and 60 days). (p < 0.05; p = 0.1/T1 vs CT-q = 8.28/T2 vs CT, q = 10.67/T1 vs T2 = 2.67).
The analyses show how the two treatments have a similar recolonization process, in spite of the height from the bottom and the difference in the composition of the community during the experiment time and how they differ from the surrounding area. The mainly difference is in the composition and abundance of organisms, due to their life history [21]. Organisms such as ostracods, bivalves and gastropods move between places dragging on the surface or being carried by displacement of sediment, these organisms are more easily found close to the sediment surface. Other organisms have the ability of leaving the sediment and moving in the water column (e.g. swimming, floating mechanisms), they can reach further places and in the case of the study higher places. This ability allows them to explore new niches [20]. Another important factor that can be responsible for the observed pattern is the hydrodynamic of the region. Guanabara Bay has two different types of water circulation: gravitational and residual are responsible for some currents close to the bottom and on the surface [22]. When these currents reach the bottom it change its flow from laminar to turbulent taking the organisms settled on the surface to the water column [23]. The swimming ability of the organisms and the velocity of the water flux could keep these organisms in the column until they find a place to settle.
The first colonizers in the treatments were Polychaeta and Amphipoda and they rapidly became the most abundant in the samplings. These two groups can be considered pioneers (r-strategists) because of the capacity of colonizing and exploring the resource available in a new area better than the other organisms [10,15]. These organisms are going to modify the characteristics of the sediment slowly turning it favourable to the settlement of other groups and unfavourable to their own existence [12]. We speculate that we could see the initial colonization, but the time wasn’t enough to see the next steps of the ecological succession, other studies had shown that the recolonization process could take several years [15,24, 25].
The natural community surrounding area had shown to be a typical community [26]. We couldn’t observe any abrupt change in its structure, this mean that there wasn’t any strong variation in the abundance and diversity of organisms during the experiment time. In spite of having two treatments they evolve in similar way which concerns diversity but in different way in terms of taxonomical composition. T1 was composed mainly by individuals which have the capacity of moving in the water column such as amphipods, cumaceans and decapods [27,28]. The height was a limiting factor to organisms with habits of living in the sediment surface (Mollusca, for example). We could found organisms such as ostracods, bivalves and gastropods in the T2 exclusively because of their life habits.
The disturbance was the mainly factor for having an increase in the diversity of organisms, it can be responsible for the diversity found in polluted bays where the anoxia of the sediment is an limiting factor to the life in the sediment [29]. This happens mainly because the artificial disturbance promotes an increase in the amount of organic matter in the sediment due to the death of all animals present.
We conclude that the disturbance is one of the responsibility for the high diversity find in this bay and surpriseingly the recolonization wasn’t done by the organisms in the surrounding region. This is an important result for this area owing to its constantly impacted area by human life. Since few decades ago it has been a concern about the necessity of the revitalization of this area and the necessity of studies to understand how is the flux of organisms between the places. The source-sink dynamics and the how the monitoring process should be done, this is the first time that the recolonization process of soft sediment is follow in this area. Understanding the capacity of one system to recovery is an important tool in environment management, mainly in areas where the disturbance has a high periodicity such as the Guanabara Bay.
NOTES