The Effect of Wide-Range Photosynthetic Active Radiations on Photosynthesis, Growth and Flowering of Rosa sp. and Kalanchoe blossfeldiana ()
1. Introduction
The light condition in greenhouses varies considerably depending on the time of year and latitude. During summer, photosynthetic active radiation (PAR) does not depend much on latitude; however, during winter PAR levels decrease substantially with increasing latitude (Figure 1) [1] [2] . At higher latitudes in summer, lower maximum irradiance levels during the day are compensated for by longer days (up to 24 h·day−1). Summer PAR levels depend mainly on weather conditions (cloud cover) and may vary considerably from day to day (Figure 2). At high latitudes, supplementary lighting is a prerequisite for effective greenhouse production during wintertime; however, on cloudy days in the summer, supplementary lighting may also be of benefit, particularly for light-demanding crops such as cucumbers and cut roses [3] -[6] . Several studies of plant growth with supplementary lighting have been performed to determine how much light should be given to different plant species, including flowering pot plants [7] -[13] . At the high latitudes, typically in Scandinavia, photon flux densities (PFD) of 100 to 150 µmol·m−2·s−1 are given to pot plants and of up to 200 to 300 µmol·m−2·s−1 to cut roses, tomatoes and cucumbers (16 to 20 h·day−1 lighting period). The daily PAR supplied may therefore vary between 5.8 mol·m−2·day−1 (100 µmol·m−2·s−1 PFD per 16 h·day−1) and 21.6 mol·m−2·day−1 (300 µmol·m−2·s−1 PFD per 20 h·day−1). However, the effect of increasing the light level can be affected by higher air temperatures in the greenhouse, caused by the heating effect of the lamps. Instead of being close to the set temperature, the temperature may in practice be closer to the 2˚C -to-4˚C-higher ventilation temperature. The natural PAR may, in sunny summer periods, reach 60 mol·m−2·day−1; however, in practice the level inside the greenhouse seldom exceeds 40 mol·m−2·day−1 due to shading by the greenhouse construction. In controlled environment experiments with greenhouse plants, fixed light and temperature levels are usually established, while in most greenhouse situations, higher light levels are often accompanied by higher temperatures. Most experiments with pot plants have been conducted with moderate supplementary light levels. The present study aimed to explore how pot plant species responded to PAR levels ranging from very low (winter conditions at high latitudes) to very high (higher than the maximum daylight experienced in a greenhouse, irrespective of the time of year and location). Miniature roses are usually grown at quite high light levels, and Kalanchoe blossfeldiana is usually grown with

Figure 1. Photosynthetic active radiation (PAR) at different latitudes throughout one year, given as daily means per month [1] [2] . A conversion factor of 7.9 mol per 1.0 kWh was used.

Figure 2. The photon flux density (PFD) measured on an hourly basis throughout June 2012 at Bioforsk Landvik (58˚22ꞌN) [1] .
lower levels of supplementary lighting. Therefore, these two species were chosen for the present study and because they are very popular pot plants. A lighting period of 20 h·day−1 was used since most experiments have shown that this is the most effective lighting period for pot plants [6] [7] . In addition to the growth experiment, the CO2 exchange rates of small plant stands of both species were studied in periods of sunny weather during the summer in order to determine the saturating PFD of photosynthesis at normal as well as high CO2 concentrations.
2. Materials and Methods
2.1. Experiment 1: The Effect of PFD/PAR and Temperature on Growth and Flowering
Plants of Rosa sp. cvs. Absolute Hit and Inter King (miniature roses) and Kalanchoe blossfeldiana cv. Debbie were used in the experiment that was carried out in a greenhouse at Bioforsk Særheim, Norway (about latitude 59˚ north). Pot roses with five cuttings per pot were cut back before start of the experiment, and the Kalanchoe plants were pretreated with short days (10 h·day−1 light for induction of flowering) before the start of the experiment. The plants were grown in standard fertilised peat (Floralux) in 10 cm pots and were watered daily with a complete nutrient solution. Twenty-four pots of each of the cultivars were placed in a 5 m long row on four greenhouse tables. Altogether 192 pots with roses (two cultivars) and 96 pots with Kalanchoe were included in the experiment, which started on 14 December with the miniature roses and on 3 February with Kalanchoe. Highpressure sodium lamps (Philips SON/T) were placed above the tables, supplying from 60 to 670 µmol·m−2·s−1 PFD from one end of the table to the other. The corresponding air temperatures around the plants varied from 20.0˚C to 24.0˚C (TEMP1) (Figure 3). Two of the tables were covered with cheese cloth, creating a PFD gradient from 50 to 370 µmol·m−2·s−1 from one end of the table to the other, with corresponding air temperatures from 22.5˚C to 26.5˚C (TEMP2) (Figure 3). The mean daylight throughout the experimental period, calculated during the 20 h·day−1 lighting period for miniature roses, was 8 and 16 µmol·m−2·s−1 for TEMP1 and TEMP2, respectively (measured at the Meteorological Station at Særheim). For Kalanchoe the respective values were 14 and 27 µmol·m−2·s−1 PFD. The outside light levels were reduced by approximately 50% due to shading by the greenhouse construction. The CO2 concentration was maintained at 800 ± 100 µmol·mol−1. Time until flowering (five open flowers), total number of open flowers and flower buds, plant dry weight per pot and a decorative value index were recorded for the pot roses. In addition, dry weight increase per day was calculated. In Kalanchoe time until flowering (visible flower colour), fresh weight of all flower stems and flowers, plant dry weight and a decorative value index were recorded. The decorative index was visually determined and ranged from 1 to 9, with 1 as the lowest and 9 as the highest value. Values below 5 were recognised as not saleable. The number
and colour of the flowers, leaf colour and plant compactness were taken into account while determining the index. The graphs are produced using Simaplot 10.0 and linear regression lines order 2 are generally included. All values are presented as means ± SE.
2.2. Experiment 2: Diurnal Carbon Dioxide Exchange at Low and High CO2 Concentrations in Daylight in Summer
Plants of Rosa sp. cv. Roxy (miniature rose) and of Kalanchoe blossfeldiana cv. Debbie planted in 10 cm pots in standard fertilised peat (Floralux) were used in the experiment. The miniature roses were cut back and grown in a greenhouse compartment in sunlight until buds became visible. Kalanchoe plants were grown under natural light on long days and were vegetative. Homogenous plants were selected, and three pots (corresponding to a density of 12.5 pots per m2 ground area) were placed in two separate cuvette units, as previously described [5] . The CO2 exchange rate (CER) was recorded continuously. The cuvette units (293 litres in volume; 500 × 480 × 1220 mm and plant floor of 0.24 m2) were placed in a greenhouse compartment, and the carbon dioxide concentration was controlled by adding pure CO2 from a container. Light was measured in each cuvette by a quantum sensor (Delta-T Devices, 400 - 700 nm). The CER was measured in two plant stands of Kalanchoe during the first half of May, and in two plant stands of pot roses in the second half of the month. The day length was 16 to 17 hours during the experimental period. The air temperature was 22.0˚C ± 0.5˚C, and the leaf temperature could increase to 2˚C above the air temperature at maximum photon flux density (PFD). The relative air humidity (RH) varied between 70% and 90%. The cooling system in the cuvette caused water vapour condensation during the day, resulting in a lower RH of 70%. One plant stand was exposed to 370 ± 30 µmol·mol−1 CO2 and the other to 800 ± 50 µmol·mol−1 during five days of sunny weather. One day before and one day after the treatment period of five days, the two Kalanchoe stands were exposed to 370 µmol·mol−1 CO2. The same treatment (370 µmol·mol−1 CO2) was administered to the rose stands two days before the treatment started.
The data were analysed using the SAS-GLM procedure (SAS Institute Inc., Cary, USA) with days as replicates. The analysis of the correlation between the CER and the PFD was conducted for low and high CO2 concentrations separately, and hourly mean measurements were taken throughout the five-day treatment period.
3. Results
3.1. Experiment 1
Miniature roses: Time until flowering decreased from about 50 to 25 days when the supplementary PFD increased from 50 to 370 µmol·m−2·s−1 and the mean air temperature increased from 22.5˚C to 26.5˚C in the TEMP2 treatment (Figure 3). The same increase in PFD accompanied by a temperature increase from 20 to about 23˚C (TEMP1 treatment) decreased the time until flowering from about 50 to 35 days. The total number of flowers increased up to about 300 µmol·m−2·s−1 PFD and was significantly decreased by increased temperature (Figure 3). The mean dry weight increase per day (growth rate) until flowering increased progressively with PFD up to about 400 µmol·m−2·s−1. The rate started at a lower level but increased somewhat faster in the TEMP2 treatment as compared with the TEMP1 treatment. Above 400 µmol·m−2·s−1 PFD the time until flowering, total number of flowers and dry weight were relatively unaffected. The leaf colour changed from dark green to bright green and the flowers from red to pink at PFD >500 µmol·m−2·s−1 (data not presented). The decorative value of the plants at the lowest PFD levels was very low due to poor growth and few flower buds (not saleable), and it increased up to 200 - 300 µmol·m−2·s−1 PFD in the two temperature treatments(data not presented). Kalanchoe blossfeldiana: Increasing the supplementary PFD from 50 to 370 µmol·m−2·s−1 decreased the time until flowering by about 15 days during both temperature treatments (Figure 4). The dry weight was strongly decreased (by about 60%) by a temperature increase from 20.0˚C to 23.5˚C (the difference between treatments TEMP2 and TEMP1) at the lowest PFD. As the PFD increased the dry weight of the TEMP2 treatment increased significantly, and the dry weight at 370 µmol·m−2·s−1 was only 20% lower than the dry weight measured during the TEMP1 treatment. The fresh weight of flowering stems and flowers followed the same pattern as the plant dry weight. The decorative value reached its maximum at a PFD of about 150 µmol·m−2·s−1, while light levels above 250 µmol·m−2·s−1 caused leaf yellowing (data not presented).
3.2. Experiment 2
The photosynthetic capacity of the miniature roses was saturated at about 300 µmol·m−2·s−1 PFD at 370 µmol·mol−1 CO2, and it was saturated at 400 to 500 µmol·m−2·s−1 PFD at 800 µmol·mol−1 CO2 (Figure 5). In Kalanchoe blossfeldiana saturation levels were reached at roughly 400 and 500 µmol·m−2·s−1 PFD, respectively (Figure 6). Increasing the CO2 concentration increased CER in the miniature roses and Kalanchoe blossfeldiana by 48% and 69%, respectively. The CER was the same in both plant stands when both species were exposed to the same CO2 concentrations (Table 1, Table 2; Figure 5, Figure 6). When the CER and PFD were calculated during a seven-hour period in the middle of the day (10:00-17:00), the CER increased by 40% in the miniature roses and by 64% in Kalanchoe. During this period, the plants received around 70% of the PAR, corresponding to 70% to 80% of the daily CER. A significant correlation was found between the CER and the PFD (p < 0.001, n = 24) in miniature roses (r2 = 0.91 - 0.94) as well as in Kalanchoe (r2 = 0.90) at both CO2 concentrations.
4. Discussion
The present experiment included extreme supplementary light levels. These light conditions (670 µmol·m−2·s−1 PFD; 20 h·day−1; 48.2 mol·m−2·day−1 PAR) exceeded those which could be experienced in Spain during the summer in a greenhouse with 50% to 60% light transmission (35 to 40 mol·m−2·day−1 PAR) [2] . The lighting
chosen for this study was known to be much more efficient for plant growth, since prior studies have shown that a particular light sum would give the best growth when distributed over 20 h·day−1 [8] . Typical for more southerly latitudes are higher maximum irradiances, due to a higher sun elevation as compared with that experienced at northerly latitudes. However, during summer, longer days at higher latitudes to a great extent compensate for
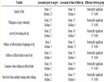
Table 1. The effect of CO2 concentration on the carbon dioxide exchange rate (CER) in pot roses on a 24-hour and seven-hour (10:00-17:00) basis (n = 5, ±SD). The two plant stands were measured at the same concentration on the first and last days of the experiment (n = 2, ±SD).
F-values and significance levels are given: ns, p > 0.05; *p < 0.05; **p < 0.01 and ***p < 0.001.
Table 2. The effect of CO2 concentration on the carbon dioxide exchange rate (CER) in Kalanchoe on a 24-hour and seven-hour (10:00-17:00) basis (n = 5, ±SD). The two plant stands were measured at the same concentration during the first two days of the experiment (n = 2, ±SD).
lower maximum levels or irradiance (Figure 1). Since the photosynthetic capacity and growth were saturated at approximately 400 to 500 µmol·m−2·s−1 PFD, the high light levels of up to 1000 to 1200 µmol·m−2·s−1 to which the plants in the greenhouse were exposed (50% to 60% light transmission) far exceeded their photosynthetic capacity; however, large crops, such as cut roses and cucumbers, can benefit from such high light levels [4] [5] [14] . If all light above about 400 µmol·m−2·s−1 PFD is recognised to have no effect on growth, the effective PAR in a greenhouse will be significantly lower than the measured PAR, particularly in sunny weather. Increasing the temperature in greenhouses cultivating miniature roses hastened the flowering and decreased the number of flowers and plant dry weight when these factors are compared to typical figures for miniature roses [9] . High temperature combined with low PAR resulted in poor plant growth and low plant quality. Excessively high PAR caused leaf yellowing and reduced plant quality, probably due to starch accumulation [15] . For miniature roses it was concluded that 200 to 300 µmol·m−2·s−1 PFD given over 20 h·day−1, or 15 to 22 mol·m−2·day−1 when light levels are low in mid-winter (about 1 mol·m−2·day−1), would give optimal growth and plant quality. The plant size and number of flowers at these levels of light depended on the air temperature, which controlled the time until flowering. A summary of flowering pot plants’ growth concluded that incremental changes to light (1% increments) resulted in 0.5% to 1.0% increases in the weight of flowering pot plants [16] , and an effect similar was found for miniature roses in the present experiment when PFD increased from 100 to 300 µmol·m−2·s−1. Kalanchoe was found to prefer lower temperatures as well as lower PAR levels as compared to miniature roses [17] [18] . For this species 10 to 15 mol·m−2·day−1 PAR and around 20˚C seemed to be optimal for growth and quality. Maintaining a high CO2 concentration was shown to considerably increase photosynthesis, as previously shown for the presently discussed plant species [17] -[20] . Ventilation of the greenhouse and drops in the CO2 concentration to the outside level for seven hours per day during the present experiment resulted in a loss in photosynthetic capacity of 25%. This exemplified the importance of maintaining a high CO2 level whenever possible in the light period. However, it should be mentioned that a high CO2 concentration could be maintained in the present experiment only because ventilation was avoided, since only a small part of the greenhouse was supplied with very high light levels. It should also be mentioned that plants grown at high CO2 concentrations are more likely to tolerate higher maximum temperatures than plants grown at low concentrations [21] .
Acknowledgements
This work was funded by the Agricultural bank of Norway and the Norwegian Growers Association.