Evaluation of Soil Mineral Nitrogen under Different Organic and Inorganic Fertilization in Central Kenya ()

1. Introduction
Nitrogen (N) is a soil nutrient essential for the development and nourishment of plants, especially vegetative development and is most frequently deficient in soils across the world. The population of the world is expected to hit 9 billion by 2050 (Haider et al. 2017) [1] meaning increased demand for food, freshwater, feed, and fiber (Haider et al., 2017 [1] ; Zabel et al. 2014 [2] ). The use of excessive nitrogenous fertilizer poses serious issues to the soil and water ecosystems including soil acidification (Sheng et al., 2016) [3] , decrease in soil quality, and reduced nitrogen use efficiency (NUE) (Feng and Zhu, 2017) [4] . The poor NUE and continuous decline in soil quality are a threat to food security and agricultural especially in third world countries (Arif et al., 2016 [5] ; Jones et al., 2013 [6] ).
The increasing demand for livestock feeds and human food has led to an increase in N fertilizers in agricultural fields. Worldwide, approximately 103 to 112 million tonnes of artificial N fertilizers are applied annually to farms (Heffer and Prud’homme, 2010) [7] , representing a potential hazard for ecosystem health when this reactive N is not taken up by plants but released to the environment. Due to the leaching attributes of nitrogen in humid conditions, excess application in the soil may lead to environmental degradation especially pollution of riparian and lacustrine ecosystems. The amount of added N found in the harvested crop products (the fertilizer N use efficiency, NUE) is was found to be only 33% in cereals (Raun and Johnson, 1999 [8] ; Glass, 2003 [9] ). Of the remaining 67%, apart from what remains in soils, much is lost through leaching or run-off, or as gaseous emissions such as N2O, NH3, and N2 (Jambert et al., 1997) [10] . This is indicative that excess addition of N to the soil is environmentally detrimental. Its implications are against the stipulations of the Kyoto Protocol and the UNFCCC provisions which encourage states to reduce greenhouse gas emissions to curb climate change.
As the costs of inorganic N fertilizers increase and as the demands for agricultural intensification picks up in East Africa, smallholder farmers are opting to use organic fertilization as alternative nutrient sources. Organic fertilization includes livestock by-products such as FYM, bioslurry, as well as recycled agricultural crop by-products. These fertilizers are applied either in raw forms or modified, such as composted materials or with the addition of biochar (B.C).
Organic fertilizers are generally low in nutrient supply, such as N concentrations ranging between 7 - 28 mg N∙kg−1 on a D.M. basis (Quilty and Cattle, 2011) [11] compared with inorganic fertilizers of the same mass. They should therefore be applied at relatively high rates to meet plant nutrient demands. Also, N release from organic fertilizers relies on the qualities of mineralization and immobilization via soil microorganisms, which are hard to envisage when determining N supply to the crops precisely. Organic fertilizers with relatively higher labile C contents promote N losses through denitrification (Robertson et al., 1988) [12] ; while those with high C/N ratio lead to immobilization of N, which reduces the availability of N as it is taken up by soil microbes (Ramirez et al., 2010 [13] ; Bruun et al., 2012 [14] ). Therefore, this study evaluated the effects of various organic (FYM, FYM + 10% BC, Bioslurry) and inorganic (NPK) fertilizers, and Lablab intercrop on the soil mineral N availability in a Humic Nitisol soil planted with Brachiaria brizantha cv. xaraes.
2. Materials and Methods
The study was conducted at the International Livestock Research Institute (ILRI), Nairobi (Figure 1) which is physiographically an upland. The cumulative rainfall amount during the experimental period was about 802 mm with long rains (L.R.) lasting from April-June while the short rains (S.R.) were recorded in the months between October 2018 to January 2019, January 2019 to March 2019, and July 2019 to August 2019 (Figure 2).
2.1. Experimental Design and Plots Management
The study was conducted between October 2018 and August 2019 comprising of four harvest seasons of 10 weeks each: short rains (S.R., October 2018 to January 2019), Short rain season (SR, January 2019 to March 2019), long rains (L.R.,
![]()
Figure 1. The study area (ILRI-Campus). Source: Mungoche 2020.
![]()
Figure 2. Rainfall and temperature trends for January to December 2019.
March 2019 to June 2019), and cold, dry season (CD, June 2019 to August 2019).
The experiment followed a Randomized Complete Block Design (RCBD) replicated three times. The treatments applied were Control (no fertilizer), farmyard cattle manure (FYM), FYM + 10% biochar (FYM-BC), and FYM digested in a bio digester (Bioslurry), mineral fertilizer (NPK), and legume intercrop (Lablab). FYM was collected from the ILRI farm. Bioslurry was produced in two biogas digesters located at ILRI’s Mazingira Centre. Before application, FYM and bioslurry were homogenized manually and analyzed for N content to adjust the applied quantity. Part of the FYM was mixed with 10% (w/w) of chopped biochar. Fertilization was applied at 45 kg N∙ha−1 for all the organic and inorganic fertilizer treatments after every harvest except for Lablab intercrop, of which biological N fixation (BNF) was measured at the end of the agronomic trial. All the agronomic management practices emulated those commonly found on smallholder farms in Kenya (Figure 3).
The agronomic trial followed a complete randomized block design with three replications. Each plot measured 4 m × 2 m. The treatments comprised of NPK fertilizer, FYM, FYM-BC, Bioslurry (all at 45 kg N∙ha−1), Lablab intercrop (biological N fixation to be determined), and Control treatment (no fertilizer). Each block consisted of 18 plots (3 forage grass species and six fertilizer types), giving a total of 54 plots (4 m × 2 m) (Table 1)
2.2. Soil Sampling
Soil sampling for mineral nitrogen was done at a depth of 0 to 15 cm at planting (N0). Fertilization was done after two weeks of planting (N1) and repeated two weeks after first fertilization (N2). It was done again after at harvest (N3), and again two weeks after harvest (N4). Subsequently, sampling at N3 and N4 were repeated during the study period across seasons. The soil was sieved (0.5 mm), extracted using 1 M KCl, and
and
were determined calorimetrically.
![]()
Figure 3. (a) The field layout at ILRI farm after plowing and before planting in September 2018. (b) Homogenized farmyard manure ready for application (c) Bioslurry collected from the biogas digesters at Mazingira Centre.
![]()
Table 1. Experimental set up for the agronomic forage grass fertilizer trial.
2.3. Soil Analysis
Composite soil samples were taken at 0 to 15 cm depth after transplanting and fertilization, harvesting, and then after 15 days of each harvest using a soil auger. Fresh soil samples were put in labelled bags and immediately taken to the Mazingira Centre for analyses. In the laboratory, the soil samples were sieved using a 0.5 mm sieve, after which extraction of the field-moist soil (8 g) with 40 ml of 1 M KCl for calorimetrically determined mineral nitrogen (
and
) was done. Samples were put on an orbital shaker for 60 min and afterward filtered on ash-free filter paper (What man No. 42), calorimetrically to determine
and
(Hood-Nowotny, et al., 2010) [15] .
2.4. Statistical Analysis
Two-way analysis of variance (ANOVA) was done to determine if the measured soil
and
pools were significantly different among the fertilizer treatments. Significant differences in the analysis of variance were accepted at p ≤ 0.05. Tukey’s HSD post hoc test was used to separate means of the measured soil attributes under the influence of fertilizer treatments. All soil data parameters were analyzed statistically using excel and GenStat Discovery 15th edition statistical software package for Windows. Significant differences were confirmed using a two-way ANOVA at p ≤ 0.05.
3. Results
3.1. Effects of Treatments on Soil Ammonium and Nitrate Availability
Treatments significantly influenced
and
availability in the soil (p < 0.001). A Higher
concentration was recorded under Brachiaria NPK (21.20 ± 27.01 µg∙g−1 soil) while the lowest
concentration was recorded under Brachiaria brizantha cv. xaraes Lablab (6.62 ± 8.02 µg∙g−1 D.M.) (Figure 4). Generally, the temporal patterns of
concentration were similar across all the treatments during the study period except under NPK, which exhibited higher
concentration two weeks after 2nd and 3rd fertilization, respectively (Figure 5).
Significantly higher
concentration (61.41 ± 38.83 µg∙g−1 soil) was observed under NPK plots, while the lowest concentration (37.09 ± 25.15 µg∙g−1 soil) was found in Lablab (Figure 4, Figure 5). However, the
concentration in the Control (50.86 ± 29.66 µg∙g−1 soil) treatment was higher than
![]()
Figure 4. Effect of treatments on the availability of ammonium in soil under Brachiaria brizantha cv. xaraes in central Kenya. Bars with different letters represent a significant difference between treatments.
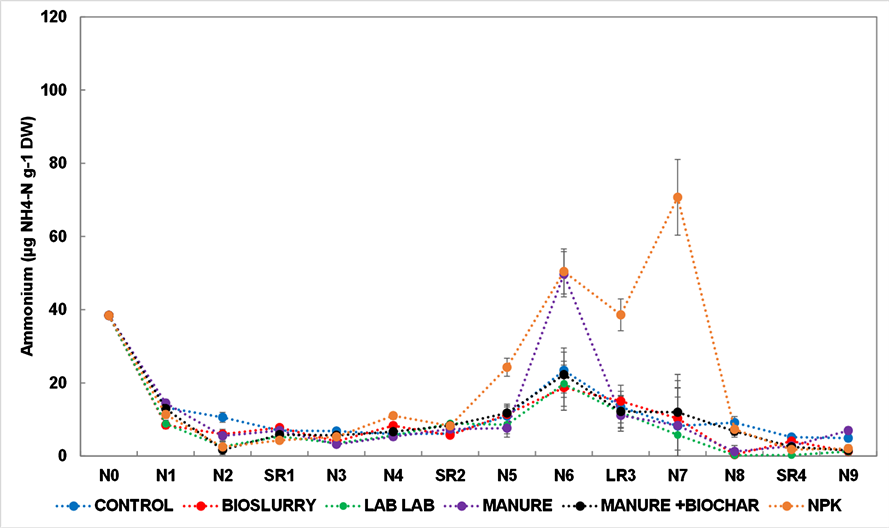
Key: N0 (planting and), N1 (1st fertilization), N2 (2 weeks after planting), SR1 (Short rains 1-October 2018-January 2019), N3 (fertilization after 1st harvest) N4 (2 weeks after fertilization) SR2 (short rains 2- January 2019-March 2019) N5 (fertilization after 2nd harvest), N6 (2 weeks after fertilization), LR3 (Long rains-March 2019-June 2019), N7 (fertilization after 3rd harvest), N8 (2 weeks after fertilization), SR4 (short rains 4-June-August 2019), N9 ( fertilization after 4th harvest).
Figure 5. Variations of soil ammonium concentration during the experiment period under Brachiaria brizantha cv. xaraes in central Kenya.
![]()
Figure 6. Effect of treatments on the availability of nitrate in soil under Brachiaria brizantha cv. xaraes in central Kenya. Bars with different letters represent a significant difference between treatments.
concentration in Lablab (37.09 ± 25.15 µg∙g−1 soil), FYM (39.10 ± 21.38 µg∙g−1 soil), FYM + 10% B.C. (40.78 ± 22.26 µg∙g−1 soil), and Bioslurry (41.04 ± 25.81 µg∙g−1 soil) (Figure 6, Figure 7).
![]()
Figure 7. Variations of soil nitrate during the experiment period under Brachiaria brizantha cv. xaraes in central Kenya.
3.2. Correlations between Soil Mineral Nitrogen and Other Selected Parameters
Total carbon positively correlated with total nitrogen (r = 0.937, p = 0.006) at the 0.01 level of significance. Ammonia negatively correlated with total nitrogen (r = −0.835, p = 0.039) at the 0.05 level. Ammonia also negatively correlated with total carbon (r = −0.895, p = 0.016) at the same level. Gravimetric water content correlated with ammonia (r = 0.826, p = 0.043) and also with NO3 (r = 0.864, p = 0.027; p = 0.001) all at the 0.05 level. NO3 correlated positively with
(r = 0.969) at the 0.05 level (Table 2).
4. Discussion
This study observed an increased mineral N concentration at the beginning of the seasons, after the fertilization events. The mineral N concentration dropped afterward, potentially due to increased crop N-uptake, leaching below the root surface, possible immobilization and/or volatilization to the atmosphere. The increased concentrations of NH4-N in the soil relative to the Control can be attributed to increased release under NPK treatments. The nitrification process has long term management implications as it results into the release of hydrogen ions which lowers the soil reaction.
Nitrogen response is affected by soil moisture (Agehara and Warncke, 2005) [16] . When soil moisture is adequate, N response is expected. NH4-N can be fixed by soil organic matter and clay minerals as they are negatively charged, resulting in adsorption on
and slower release (Kissel, et al., 2008) [17] . On the other hand,
, which is negatively charged, is not well retained by the
*Correlation is significant at the 0.05 level (2-tailed). **Correlation is significant at the 0.01 level (2-tailed). Where: Soil temp = Soil temperature, Soil mois. = soil moisture, Grav. Wc = Gravimetric water content.
soil and can be leached more easily, representing a potential hazard because
is a groundwater pollutant (Lodhi, 1979) [18] . In respect to this, when high rainfall is experienced, NH4-N gives a better yield response compared to
in the soil (Gallardo, et al., 2006) [19] . The differences in bioavailability of
and NH4-N have been studied and reported that NH4-N can be directly assimilated into amino acids, whereas
has to be reduced first into NH4-N before the assimilation process (Carey, and Migliaccio, 2009 [20] ; Fernandes, and Rossiello, 1995 [21] ). Whenever the proteins present in inorganic fertilizers are depolymerized and decomposed to NH4-N, the soil's NH4-N concentrations will increase (Li et al., 2018 [22] ; Chantigny, et al., 2010 [23] ; Noll, et al., 2019 [24] ). This phenomenon also explains why ammonium fertilizers are more suited in wetland ecosystems compared to nitrate fertilizers because they can benefit crops without the risk of leaching owing to their ready solubility. Furthermore, the nitrification process can only produce
in the presence of enough
to stimulate the denitrification process to release N2O and N2 (Azam, et al., 2002) [25] . The long-term implication of the link between soil moisture and soil nitrogen is the possibility of leaching especially under humid climates. Long term nitrogen resource to the soil could be maintained by use of biological nitrogen fixation by intercropping or rotating legumes with other crops. It could also be done through seed treatment with rhizobium inoculant strains at planting to ensure long term, environmentally friendly soil nitrogen resource. This suggestion agrees with the findings of Kahindi et al. (2009) [26] who elucidated the importance of BNF in the ecosystem management.
and
are more rapidly taken up by plants when applied during growth stage before maturity (Steiner et al., 2007) [27] . During this time, water availability is critical for nutrient fluxes from the soil to plant roots (Christophe, et al., 2011) [28] . Without N fertilizers, the inorganic N concentration of the grounds planted with forage grasses becomes low throughout the whole year (Sommer, et al., 2004) [29] . Obtained values for
concentrations (21.20 ± 27.01 µg∙g−1 for NPK and 6.62 ± 8.02 µg∙g−1 for Lablab were consistent with the numbers reported previously in Kenya (Sommer, et al., 2004) [29] . However, in this study, the
concentrations were higher at 61.41 ± 38.83 µg∙g−1 for NPK and 50.86 ± 25.15 µg∙g−1 in Lablab intercrop. Soil
and
were lower in FYM, FYM-BC, which could be attributed to low mineralization rates of organic materials. This might have slowed soil microbial action and maintained a mineralization process that allows for the gradual release of C and N in soils over time (Kemmitt, et al., 2006) [30] . A study by (Prasad, & Singh, 1980) [31] noted that when applying FYM and NPK in a maize plantation, there was a 55% increase in
concentrations over the Control treatment, which are higher values than those recorded in this study (40%). Similarly, high
concentrations in treatment containing FYM in this study has been previously reported by (N’Dayegamiye, et al., 1997) [32] .
The positive relationship between total carbon and total nitrogen is indicative of the role of carbon in maintaining nitrogen resources in the soil. This finding is consistent with observations of Lelago and Buraka (2019) [33] and Mwendwa et al. (2020) [34] who observed a positive correlation and attributed it to the ability of carbon to bind nitrogen. It has a management implication of the role of organic inputs including well decomposed manure which is usually rich in carbon. Increasing ammonia seems to reduce the availability of total carbon and nitrogen in the soil which can be attributed to immobilization by soil bacteria.
Increasing mineral N in the soil after harvest is indicative of potential leaching to ground water. Previous research has indicated that over half of the Nitrogen applied to the soil is lost through leaching down the soil profile with less than half available for plant uptake (Liu et al., 2013) [35] . This is suggestive that organic manure is the best bet nitrogen supplier to the soil in long term management. The finding is consistent to findings of Dunjana et al. (2012) [36] who observed that manure maintains stable N, P and soil organic matter contents in the topsoil for up to four years. There is evidence that soil quality and fertility simultaneously improve as soil organic matter content increases as the organic matrix provides a solid foundation for sustainable soil productivity (Hou et al., (2012) [37] . This happens by preventing soil nutrients from leaching and maintaining residual compounds in the topsoil after rapid mineralization. This opinion is consistent with findings of Pinitpaitoon et al. (2011) [38] . All these arguments point to the choice of organic materials despite their slow release of mineral N. This point should, however, be taken with caveats as it may be invalid for short term crops especially in leased land systems.
5. Conclusions and Recommendations
In conclusion, we found out that organic fertilizer releases the minerals faster to release
and
in the soil unlike FYM, Bioslurry, FYM-BC (organic fertilizers) which are slow-release fertilizers for mineral N and can stay in the soil for more extended periods as their mineralization is gradual. Added inorganic N fertilizer is more effective in low soil N conditions to maximize forage grass production yields. However, the gradual mineralization of organic fertilizers, particularly FYM and FYM-BC, which eventually have a long-term residual effect in the soil, is a promising strategy for improving forage grass production in sub-tropical Africa (SSA) overtime.
When discussing the effects of organic and inorganic fertilizers on mineral N, besides quantifying N concentrations, escape pathways such as leaching should be evaluated. This could provide insights into understanding the exact quantities of mineral N utilized from various organic fertilizers by forage grasses for improved yields. This could also form a basis for the calculation of nutrient balances in forage grass fields. It can also help to understand the nutrient uptake by forage grasses and measure the contribution of organic and inorganic fertilizers to forage grass biomass yield.
Acknowledgements
The authors are indebted to the Program for Climate Smart Livestock System (PCSL) project for funding this study. We acknowledge the International Livestock Research Institute (ILRI) for their support in greenhouse gas measurements and analysis as well as giving valuable guidance during my project work.