Geochemical Mobility Associated to Gold and Base Metal Occurrences of Mangodara Sector, in Southern Burkina Faso, Banfora Greenstone Belts (West African Craton) ()
1. Introduction
The element mobility in hydrothermal fluids is documented in a variety of deposits [1] - [6] and supported with experimental studies [7] [8] . The mobility is controlled by three main factors [9] : 1) the stability and composition of minerals in the unaltered rock, 2) the stability and composition of minerals in the altered product, and 3) the composition, temperature, and volume of the migratory fluid or melt phase. In addition, the undertaken studies on that phenomenon particularly in relation to alteration halos have significantly improved the understanding of geochemical elements mobility in aqueous systems. It is shown that acidic alteration produces a loss in Na-K in medium rare earth elements (MREE) such as Sm, Eu and Gd and a gain in Cu, As, Mo, Bi, Te and light rare earth elements (LREE), in particular La, Ce, Pr, Nd, Pm [10] . High field strength elements (HFSE), and rare earth elements (REE) are generally considered to be immobile during secondary processes, opposite of large ion lithophile elements (LILE) which are mobile [11] [12] . Using the constant ratios of La/Th and La/Sc observed in shales [13] estimated the upper crustal thorium and scandium contents at 11 ppm and 10.7 ppm, respectively. Recent studies combining whole-rock and mineral chemistry in volcanogenic massive sulphides (VMS) deposits, showed that LREE (La to Sm) and Eu are mobile in the alteration halo of Bracemac-McLeod deposits [2] . In the West African Craton (WAC) (Figure 1(a)), the Baoulé-Mossi domain of the Léo/Man shield hosts gold and base metal occurrences [14] - [22] . Likely, in the metallogenic province of the WAC, alterations are almost systematically associated with metals descriptions [17] [20] [23] [24] [25] [26] [27] , but the geochemical signatures attributable to metal content, in opposite, is little or no assessed. The present study deals with geochemical data from a gold and base metal occurrence in the southern Banfora belts, close to the Ivory Coast border. The occurrences are associated with silico-aluminous kyanite, staurolite, garnet, Fe ± Mg muscovite paragenetic assemblage typical of amphibolite metamorphism facies [23] , but there is no information on the geochemical features of host rock. In this paper, we discuss the relationship between the mobility of geochemical elements in order to contribute to increasing the chance for exploration in this part of the Birimian system, since the use of geochemistry in mineral exploration is invaluable, particularly in relation to the understanding of alteration, mineralization-related processes, and guide for exploration.
2. Geological Setting
Several studies [16] [28] [29] [30] [31] present the geological configuration of the Léo/Man shield in two domains, respectively the western Kénéma-Man domain > 2500 Ma and the eastern Baoulé-Mossi domain dated at ~2000 Ma [28] [31] . The Baoulé-Mossi domain consists mainly of volcanic and sedimentary belts and granitoid intrusions [18] [30] [32] - [41] . Burkina Faso which extends on the Baoulé-Mossi domain is composed of Paleoproterozoic basement greenstone belts and granitoid (80%) covered in its western, northern and eastern margin by Neoproterozoic to Cambro-Ordovician sedimentary (1000 - 435 Ma) formations (20%). The belts are essentially made up of metavolcanic rocks, ranging
![]()
Figure 1. (a) geological map of the Leo/Man shield and the most important gold deposits across the WAC (Modified from [17] ); (b) simplified geological map of Banfora green belt (modified from [34] ) and location of the studied area.
from metabasalts to metarhyolites and metasedimentary rocks including quartzites and metapelites [23] [36] [42] [43] . Specifically, the Banfora belt that extends over 160 km long and 35 km wide [43] in Burkina Faso lays up to Côte d'Ivoire; and is intersected by the Bobo-Dioulasso high strain corridor representing the continuity of the major Greenville-Ferkéssédougou-Bobo-Dioulasso shear zone (Figure 1(b)). The eastern part of the Banfora belt consists of interlayered units of basalts, andesites, volcano-sediments and rhyolites, 2 to 4 km thick, while the western part is composed solely of volcano-sediments according to [36] . The global stratigraphy of the belt proposed by these authors and revised by Ilboudo [43] suggests, from bottom to top: 1) deposition of ultramafic rock; 2) mafic volcanic; 3) subsequent deposition of lava flow and projection (pyroclastite and lapilli tuff); 4) deposition of siliceous rock (exhalite); 5) emplacement of pelitic and turbiditic sediments; 6) emplacement of the pre-collision eastern granite and 7) emplacement of the post-collision western granite. The volcanic activity that prevailed in West Burkina Faso took place between 2190 Ma and 2160 Ma (Eoeburnean) according to [36] and presents a juvenile character with regard to ԑHf (~0 to +8) [38] . The exhalites constitute the upper horizon of the lithostratigraphy of the volcanic formations of the eastern part of the belt and subvolcanic rocks consist mainly of porphyry microdiorite, dolerite sills and dykes [43] . Syn-tectonic intrusions (granite and granodiorite) emplaced in the favor of Greenville-Ferkéssédougou-Bobo-Dioulasso regional shear zone known from Liberia and Ivory Coast [36] [43] [44] . Based on geochemical and geotectonic settings, [43] pointed out that granitoids in western and eastern margins of the Banfora belt are respectively post- and pre-collisional. Geochemically, granitoid intrusions show arc volcanic in character, including negative Ta, Nb and Sr anomalies and mostly older than 2100 Ma [38] . In nearby areas, pegmatite associated with granitoids and migmatitic gneiss potentially contains rare metals [40] [41] . The study area consists of a set of dominantly metamorphosed volcanic metaformations (metarhyolite, rhyolitic tuff, metadacite, metaandesite, metabasalt (Figure 2(a) and Figure 2(b)). Rare outcrops of sulphidic felsic and
![]()
Figure 2. Geology environment. (a) regional geology; (b) geological map of the study area.
highly siliceous formations (metarhyolite, cherts and quartzites) that have resisted the weathering appear as main host rocks [23] . Late monzonite, granodiorite, and diorite cross-cut the entire volcanic package. The occurrences are hosted by a narrow northeast–southwest trending shear zone.
3. Methodology
3.1. Sampling
The fieldwork consisted of describing and sampling several diamond drill holes for further investigations. The samples come from two drill holes (K7 and K15), following a good spatial coverage of the alteration zones. A total of twenty rock samples from these drill holes have been collected. The sampling was undertaken on the different lithologies, including all styles of mineralization and alteration following two-meter spacing. Fifty thin sections were made including twenty at Western Australia University and thirty at Université Joseph KI-ZERBO at the Laboratoire Geosciences et Environment (LaGE). Detail investigation is operated under a Nikon Eclipse 50i POL type polarizing microscope (transmitted and reflected lights), coupled to a camera. We use acronyms for rock-forming mineral in [45] . GDCKit of [46] was used for much of the ternary plotting.
3.2. Analytical Method
Part of this study is based on whole-rock geochemical data from the drill cores. Samples were analyzed by XRF diffraction for major elements and rare earth and trace elements by Inductively Coupled Plasma Mass Spectrometry (ICP-MS) at the ACME Laboratory in Vancouver. Twenty of the analyzed samples from metarhyolites, metadacites and metaandasites, were used in this paper (Table 1). Samples were crushed and pulverized to 200 mesh and sample fragments (0.2 g) were placed in graphite crucibles and with lithium borate flux added. The crucibles were placed in an oven and heated at 1025˚C for 25 min. Each melted sample was then dissolved in 5% HNO3. A blank and internal standard (STD SO-15 reference material) were carried through the weighing, digestion and analysis stages to check for accuracy. Calibration standards, verification standards and reagent blanks were also added to the sample sequence for testing. To examine the geochemical characteristics of the mineralization, principal component analysis (PCA) was performed on whole-rock geochemical data in order to discriminate elements associated with gold mineralization from those that are not related to the process. For the exercise, REE (La, Eu) LILE (Ba, Cu, Pb), HFSE (Sc), metals (Au, Co, Mo, V, Ag, Sb, Sn, Cr, Ni, As, Zn, Bi) and S were used. To address the closure problem in multivariate statistical analysis of compositional datasets, we applied a centered log-ratio (CLR) transformation [47] to the elemental data prior to principal component analysis (PCA). We applied to extract only principal components (PC) with eigenvalues greater than 1. The extracted Principal Components (PC) were orthogonally rotated by the Varimax method [48] to maximize the variability between all input variables and, facilitate
![]()
![]()
![]()
Table 1. Lithogeochemical data for the Mangodara area.
the interpretation of loading factors.
4. Results
4.1. Petrography and Mineralogy
Three main types of metamorphosed volcanic rocks were identified during petrographic examination. They correspond to rhyolitic, dacitic and andesitic composition. Metarhyolites show grano-lepidoblastic and locally porphyroblastic texture including kyanite 2 - 5 mm, staurolite 1 - 2 mm and garnet 1 - 2 mm that are overprinted by lepidoblastic texture with dominant mica content. They are made up of quartz phenocrysts (5 - 10 vol.%), 1 - 2 mm in diameter rounded and corroded (Figure 3(a)) within siliceous microcrystalline matrix (70 vol.%). The matrix consists of recrystallized quartz, sericite and chlorite flakes. Metadacites develop granolepidoblastic and locally porphyritic texture including plagioclase of 2 - 3 mm in size. Common mineral association is quartz (1 - 5 vol.%), plagioclase (15 - 20 vol.%) up to 1 - 3 mm, deformed and altered into sericite (Figure 3(b)), while biotite (2 - 10 vol.%) is replaced by chlorite. Metaandesites show granolepidoblastic texture consisting of plagioclase (20 - 30 vol.%) (Figure 3(c)), biotite (10 - 20 vol.%), quartz (10 - 15 vol.%) and hornblende (5 - 10 vol.%) (Figure 3(d)).
The metamorphic minerals are mainly kyanite, staurotide, garnet, chloritoid, hornblende and biotite (Figure 4(a), Figure 4(b) and Figure 4(d)). In places, the kyanite and staurotide are corroded and altered to sericite (Figure 4(c)) in a low degree of metamorphism. Strong hydrothermal alteration includes pyrite and pyrrhotite-rich in association with sericite and quartz. Therefore, association
![]()
Figure 3. Microscopic detail of mineral assemblages observed in various lithologies. (a) Primary corroded quartz in metarhyolites; (b) Plagioclase phenocrysts in a siliceous quartz matrix associated with sericite flakes in metadacites; (c) Plagioclase phenocrysts in association with opaques in metaandesites; (d) Quartz-biotite-hornblende matrix in metaandesites. Qtz: Quartz; Ms: Muscovite; Opq: Opaque; P1: Plagioclase; Ab: Albite; Bt: Biotite; Hbl: Hornblende.
![]()
Figure 4. Macroscopic views of metamorphic minerals: a) semi-massive pyrrhotite associated with kyanite; b) Kyanite-staurolite porphyroblast association in metarhyolites; c) Corroded staurolite; d) Kyanite - staurolite - garnet paragenetic association; e) Kyanite porphyroblast in the metarhyolites; f) Carbonate, hornblende and biotite association in metaandesites. Ky: Kyanite; St: Staurolite; Qtz: Quartz; Ser: Sericite; Grt: Garnet; Py: Pyrite; Po: Pyrrhotite; Hbl: Hornblende; Opq: Opaque; Cb: Carbonate.
pyrite-pyrrhotite-kyanite is noticeable in rhyolite (Figure 4(e)). Hydrothermal alteration is also noted within monomictic breccia supported by clasts, showing angular and puzzle-shaped blocky textures implying chlorite and sericite. These later minerals appear in dacite where sericite develops flakes and quartz, recrystallized sub-grained. Carbonate is specific in andesite (Figure 4(f)).
4.2. Geochemical Data
4.2.1. Majors and Traces Data
Rocks are classified using the Nb/Y vs Zr/Ti binary plot of [49] (Figure 5). The
![]()
Figure 5. Diagram of classification of different volcanic rocks. Nb/Y Vs Zr/Ti diagram [46] .
Nb/Y vs Zr/Ti diagram confirms the lithology made up of rhyolite, dacite and andesite composition. However, one metadacite sample is located in the andesite field. This shows that a sample of metadacite is enriched in titaniferous oxide.
4.2.2. Geochemical Behavior of Rocks Mineral Component in A’CF and A’KF Ternary Plots
In the AFM, A’CF and A’KF ternary diagrams (Figure 6) established by [50] [51] , the altered felsic and intermediate volcanic rocks show three trends: We calculated the number of moles of the components, by dividing the percentages by weight of oxides by the molecular masses (Table 2). 1) The samples from mineralized metarhyolite with high Fe plotted in the AFM and A’CF ternary diagram suggests the presence of chloritoids, but they are randomly distributed in the A’KF ternary diagram; 2) Two samples of unmineralized metarhyolite with high Mg plotted in the AFM and A’CF ternary diagram suggest the presence of chlorite but are randomly distributed in the A’KF ternary diagram between chlorite alteration trend and sericite alteration trend; 3) Two samples from metadacite with high Mg and K plotted in the AFM suggest the presence of chlorite and sericite, with high Fe, Mg, Ca content plot in A’CF diagram describe the presence of chloritoid, carbonates and hornblendes while they are scarcely reported in the A’KF diagram either describing biotite alteration or the presence of chloritoid; 4) Samples from mineralized metaandesite with high Fe, Mg, Ca plotted in the AFM and A’CF ternary diagram suggest the presence of chlorite,
![]()
Figure 6. Ternary diagrams in the AFM, A’FK and A’CF systems. A’CF. A’ = Al2O3 + Fe2O3 − (K2O + Na2O), C = CaO, F = FeO + MnO + MgO. A’KF. A’ = Al2O3 + Fe2O3 − (K2O + Na2O + CaO), K = K2O, F = FeO + MnO + MgO. AFM. A = Al2O3 − K2O; F = FeO, M = MgO.
sericite, chloritoids, staurolite and hornblendes but records high Fe value in the A’KF diagram suggesting biotite alteration; 5) The samples from unmineralized metaandesite with high Fe, Mg, Ca plots in ACF and A’CF ternary diagram respectively describe the presence of chlorite, sericite, chloritoid, hornblende and carbonate whereas they show six samples enriched in iron in the A’KF diagram
![]()
![]()
Table 2. AFM, A’CF and A’KF coordinates for rocks in the Mangodara area.
in which five samples describe biotite alteration and one, both chlorite. As a result of this variability, it can be stated that the current composition of Mangodara volcanic rocks is strongly influenced by alteration with gain of K2O, CaO, FeO and MgO. This has led to the stability of different minerals under the prevailing conditions of the amphibolite facies. Ti, Al, Zr, Y, Nb, Th, Cr, Co, and REE are considered to be immobile during hydrothermal alteration [52] [53] [54] . We evaluated volcanic rocks after hydrothermal alteration by plotting Zr vs Hf and Y vs Ho. For the overall rocks, the results show a positive correlation regarding Zr vs Hf (R2 = 0.82) and Y vs Ho (R2 = 0.80) (Figure 7(a) and Figure 7(b)) with R2 as the correlation coefficient. This shows that Zr, Hf, Y and Ho are immobile during secondary processes and their concentration can be used to infer lithogeochemical classification.
4.2.3. Geochemical Mobility in Relationship with Mineralization
1) Major and traces elements distribution
The major elements of mineralized metarhyolite and metaandesites were normalized with the major elements of unmineralized metarhyolite and metaandesites, respectively, to determine their enrichment or depletion in the mineralized zone relative to the unmineralized zone (Figure 8(a) and Figure 8(b)). The major elements of mineralized metarhyolites and metaandesites respectively show enrichment in Fe2O3 and K2O and depletion respectively in MgO, Al2O3, CaO, SiO2, Na2O, P2O5 and MgO, Al2O3, CaO, SiO2. TiO2 is immobile in the two lithologies. To determine trace elements enrichment or depletion, we have estimated local thresholds for unmineralized metarhyolites and metaandesites (Table 3)
![]()
Figure 7. (a) binary Y/Ho diagram. (b) Zr/Hf binary diagram.
![]()
Figure 8. Comparison of major element value in samples from mineralized and unmineralized zones.
Table 3. Statistical summary of trace element data (in ppm) of rock samples from the Mangodara sector. Q1 = 1st quartile; Q2 = Medium; Q3 = third quartile; MAD = Median of Absolute Deviation from data median; EF = Enrichment factor.

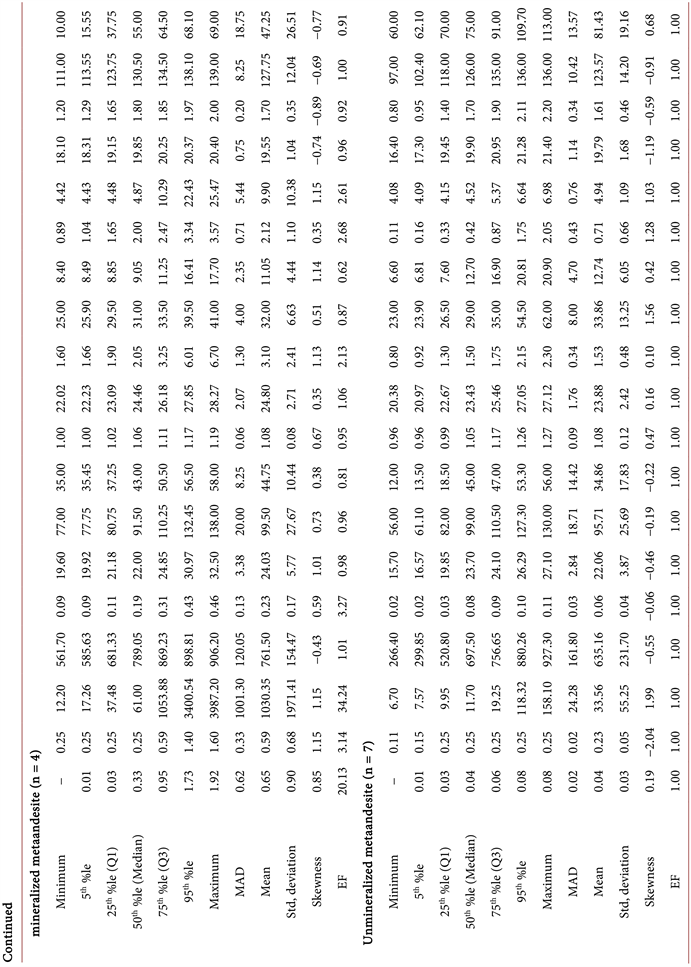
equal to the median of the data plus twice the median absolute deviation (MAD) for each geochemical element [55] . Then, we defined the enrichment factor (EF) according to the following formula:
EF = [Median + 2MAD]meralized rock sample group/[Median + 2MAD]Unmineralized rock sample group
Comparison of trace elements data from mineralized and unmineralized metarhyolite show enrichment in Au, Ag, Ba, Bi, Cr, Cu, Eu, La, Mo, Ni, Pb, S, Sc, V and depletion in As Sb Co, Sn, Zn in mineralized metahryolite. Regarding metaandesites we note enrichment in Au, Ag, As, Mo, S, Sb and depletion in Co, Sn, Zn, Bi, Cr, Cu, Eu, Ni, Pb, Sc in mineralized metaandesites. Ba, La, V are immobile in metaandesites (Table 3).
2) Principal Component analysis of major elements
To better characterize the geochemical processes associated with each type of alteration, we undertook geochemical balance based on Principal Component analysis (PCA) on major elements. The variables are SiO2, Al2O3, Fe2O3, MgO, CaO, Na2O, K2O, P2O5, TiO2, MnO. The mineralized metarhyolite samples are described by two main components, PC1 and PC2 explained 56.72% and 43.32% of multivariate data variability, respectively. PC1 represents opposing associations of SiO2-CaO-TiO2-MgO-MnO-P2O5 and Na2O-K2O-Al2O3-Fe2O3 reflecting quartz, carbonate and biotite in the proximal zone and white mica in the mineralized zone. PC2 represents opposing associations of SiO2-Na2O-K2O-Al2O3-TiO2-MgO-MnO-P2O5 and CaO-Fe2O3 reflecting protolith and metamorphism minerals close to the mineralization and carbonate veins associated with the sulphide mineralization. The PC1-PC2 biplot (Figure 9(a)) describes major elements associations representing the main process associated with mineralization, in which Na2O-K2O-Al2O3 describes potassic and alumina alteration; SiO2-TiO2-MgO describes biotite alteration; Fe2O3 describes metal; CaO describes carbonate alteration. In unmineralized metarhyolite, PC1 and PC2 explain 76.98% and 18.58% of multivariate data variability, respectively. PC1 represents opposing associations of SiO2-Na2O-K2O and CaO-MgO-MnO-P2O5-Al2O3-Fe2O3 reflecting the protolith. PC2 represents opposing associations of Al2O3-TiO2 and MgO-Fe2O3 that reflect metamorphism. In the PC1-PC2 biplot (Figure 9(b)) that describes major associations representing major processes associated with unmineralized metarhyolites, SiO2-Na2O-K2O describes feldspath and sericite; CaO-MgO-MnO-P2O5-Fe2O3 describes ferromagnesian minerals; Al2O3 describes alumina alteration. In Metadacite PC1 and PC2 explain 72.19% and 27.80% of multivariate data variability, respectively. PC1 represents opposing associations of Na2O-SiO2-Al2O3-TiO2 and CaO-MgO-MnO-P2O5-Fe2O3-K2O that reflect the metadacites protolith. In the PC1–PC2 biplot (Figure 9(c)), Na2O-SiO2-Al2O3 describes the plagioclase; CaO-MgO-MnO-P2O5-Fe2O3 describes ferromagnesian and hydrothermal alteration; P2O5-K2O describes potassic alteration. Regarding metaandesites, PC 1 and PC2 explain 56.15 and 26.72 of multivariate data variability, respectively). PC1 represents opposing associations of SiO2-K2O and Na2O-CaO-MgO-MnO-P2O5-Al2O3-Fe2O3
![]()
Figure 9. Biplot of varimax rotated principal, component of major element data for three lithologies (mineralized metarhyolites and metaandesites, unmineralized metarhyolites and metandesites; metadacites) of the Mangodara sector.
that reflect potassic alteration and protolith, respectively. PC2 represents opposing associations of K2O-P2O5-Al2O3-Fe2O3-TiO2 and Na2O-CaO-MgO-(SiO2-MnO) which respectively reflect potassic and aluminous alteration associated with mineralization and carbonate and biotite alteration in the proximal zone. In the PC1-PC2 biplot (Figure 9(d)), Na2O-CaO-MgO describes metamorphism; Al2O3-Fe2O3 describes aluminous alteration associated with sulphide mineralization; SiO2-K2O describes sericite and siliceous alteration. In unmineralized metaandesite PC 1 and PC 2 explain 50.36% and 26.52% of multivariate data variability, respectively). PC1 represents opposing associations of SiO2 (-K2O) and Na2O-CaO-MgO-MnO-P2O5-Al2O3-Fe2O3 that reflect respectively the silica alteration and the protolith. In the PC1-PC2 biplot (Figure 9(e)), Na2O-CaO-Al2O3 describes plagioclase; MgO-MnO-Al2O3-Fe2O3 describes the ferromagnesian minerals of the protolith; K2O-TiO2 describes the accessory minerals of the protolith.
3) Principal component analysis of trace elements
In the mineralized metarhyolites, PC1 and PC2 explain 58.31% and 41.68% of multivariate data variability, respectively). PC1 represents opposing associations of Au-As-Ba-Cu-Eu-La-Mo-Ni-S-Sc-Zn (-Cr-Pb) and V-Sb-Co-Sn-Ag-Bi which reflect respectively: 1) hydrothermal alteration and base metal associated with gold mineralization and 2) base metal sulphide mineralization. PC2 represents opposing associations of V-Sn-Ag-Cr-Pb-Sc-Co-Ba-Ni and Bi-Sb-As-Cu which reflect respectively: 1) hydrothermal alteration and 2) sulphide mineralization. The PC1–PC2 biplot (Figure 10(a)) describes the associations of trace elements representing the main processes associated with the mineralization of the Mangodara sector: 1) Au-Ba-Cu-Eu-La-Mo-Ni-S-Zn describes alteration halos and base metal associated with gold mineralization; 2) V-Sn-Co-Ag describes base metal enrichment close to gold mineralization. In unmineralized metarhyolite, PC1 and PC2 explain 54.37% and 31.27% of multivariate data variability, respectively. PC1 represents opposing associations of
Au-Mo-Bi-As-Cr-Ni-Sb-Co-S-Sn-Pb (-Cu-Sc) and La-Eu (-V-Zn-Ba) which reflect respectively: 1) base metal associated with gold mineralization and 2) protolith. PC2 represents opposing associations of Sn-Pb-Ba-La-Eu and V-Zn-Cu-S (-Sc-Co-Sb) that reflect hydrothermal alteration and base metal enrichment, respectively. The PC1–PC2 biplot (Figure 10(b)) describes associations of trace elements representing the main processes associated with unmineralized metarhyolites from the Mangodara area: 1 Au-Mo-Bi-As-Cr-Ni-Sb-Co describe unmineralized Au-bearing metarhyolites; 2) S-Cu-Zn-V-Sc describes base metal enrichment. In mineralized metaandesites, PC 1 and PC 2 explain 50.32% and 38.81% of multivariate data variability, respectively. PC1 represents opposing associations of Au-S-Sb-As-Ag-Bi (-Ba-Sn-La-Cr) and V-Sc-Zn-Eu-Cu (-Co-Mo-Pb) which respectively reflect: 1) hydrothermal alteration and base metal associated with gold mineralization and 2) base metal enrichment. In the PC1-PC2 biplot (Figure 10(c)), Au-S-Sb-As-Ag-Bi describe sulphide mineralization associated with gold; Ba-Sn-La-Cr-Co-Mo-Pb
![]()
Figure 10. Biplot of varimax rotatide principal, component trace element data for two lithologies (mineralized metarhyolites and metaandesites, unmineralized metarhyolites and metandesites) of the Mangodara sector.
describe hydrothermal alteration halos and V-Sc-Zn-Eu-Cu describe base metal enrichment. In unmineralized metaandesite, PC1 and PC2 explain 39.43% and 23.78% of multivariate data variability, respectively where PC1 represents opposing associations of Au-As-S-Bi-Sb-Zn-Eu-Ag(-Sc-V-Co-Cr) and Mo-Ba-Sn-Pb-Cu (-La-Ni). These associations respectively reflect: 1) base metal enrichment associated with gold mineralization and 2) hydrothermal alteration and base metal enrichment. PC2 represents opposing associations of Cu-La-V-Sc-Eu (-Sn-Pb-Ba-Co-Zn-Au-S-Bi-As) and Ni-Cr-Mo (-Sb373-Ag) which respectively reflect: 1) hydrothermal alteration and sulfides and 2) Primary mineralization. In the PC1-PC2 biplot (Figure 10(d)); Au-As-S-Bi-Sb-Zn-Ag describe sulphide mineralization associated with gold mineralization; Sc-V-Co-Eu describe hydrothermal alteration associated with gold mineralization; and Ba-Sn-Pb-Cu-La describe hydrothermal alteration; 3) Mo-Ni describe the primary mineralization
5. Discussions
5.1. Alteration and Mineral Paragenesis
Potential in mineral resources in the Banfora Birimian (Paleoproterozoic) greenstone belts is still debated since no world-class deposits are yet discovered in the belt despite an intensive exploration campaign [43] . In this paper, we are dealing with the possible volcanic-hosted gold mineralization and base metal enrichment. In hydrothermal deposits, secondary mineral assemblages correlated with geochemical compositions can be used as a vector for tracking gold mineralization [50] [56] [57] [58] . Mineral paragenetic associations are 1) primary mineral assemblage; 2) Metamorphic index minerals (kyanite, staurolite, garnet) typical of amphibolite facies, but suggesting predominant aluminous alteration, are overprinted by sericite-chlorite-biotite-carbonate alteration. In the Eastmain River deposit, [59] distinguished two different alteration assemblages which are both associated with the ore: a prograde garnet assemblage, and an epidote assemblage which locally retrogrades the garnet assemblage. Such alteration is documented at Bousquet 2 - Dumagami in Canada [60] where andalusite - kyanite - pyrophyllite assemblages are interpreted to represent the metamorphic equivalent of synvolcanic alteration produced by oxidative hydrothermal and acid fluids, relevant to advanced clay-like alteration. In opposite of andalusite and kyanite from Bousquet 2-Dumagami resulting in low-temperature metamorphism, those of Mangodara sector implying kyanite, staurolite, garnet and sillimanite originate from high temperature. In metamorphosed and deformed terranes like at Caho Ortegal, northwestern Spain of Sapey, kyanite, staurolite bearing gneisses are related to high-temperature metamorphism [61] [62] . Aluminous alteration (kyanite-staurolite-garnet) and plagioclase-quartz-white mica -staurolite-kyanite-garnet—sulphide at Mangodara are mainly hosted by metarhyolites. At Korpela, K-Al-Mg-Fe-S type alteration (muscovite, aluminosilicates, staurolite and garnet) is hosted by andesite and rhyolite [57] . In the current study, we assume kyanite and staurolite alteration corresponds to the first stage of metamorphism. The epitaxial intergrowth between kyanite and staurolite suggests concomitant development and that this assemblage was stable before major metamorphism [63] . In our case, assemblage is overprinted by sericite, and chloritoid, chlorite, suggests retrograde metamorphism. Sericitization causes losses of Ca and Na and is generally accompanied by gain (Equation (1)) or loss (Equation (2)) of K depending on the altered minerals [64] . Sericite alteration is ubiquitous in all selected samples from the study area. Indeed, the loss of Na in the rock and the contribution of K in solution allows the replacement of albite by white mica and the crystallization of quartz [57] as shown in the following reaction (Equation (1)):
 (1)
(1)
![]() (2)
(2)
Mineralized samples show strong Na depletion compared to unmineralized samples. Sillimanite occurs in micaceous beds in metarhyolites. The muscovite surrounding the corroded kyanite suggests a change in (P–T) conditions such that the kyanite is no longer in equilibrium [65] . These reactions lead to an increase of aluminum content in the altered rock, producing during metamorphism, the recrystallization of sillimanite porphyroblasts [57] . Chloritization is generally associated to sericitization and this is characterized by the progressive transformation of sericite into chlorite (Equation (3)) in the core of the Volcanogenic Massive Sulfide (VMS) hydrothermal system, resulting in Fe and/or Mg gains [2] .
![]() (3)
(3)
This chemical reaction (Equation (3)) leads to an increase of aluminum and iron concentrations in the altered rock producing during retrograde metamorphism, and recrystallization of chloritoid porphyroblasts.
5.2. Relationships between Hydrothermal Alteration and Mineralization
In the subsequent works Zr, Y, Ti and Al are immobile in volcanic rocks affected by hydrothermal fluid [53] [54] [64] [66] . The depletion of Al2O3 in the mineralized zone containing kyanite and staurolite porphyroblasts is a result of the corroded species. In opposite Al2O3 is stable in the mineralized metaandesites. The PC1-PC2 biplot (Figure 9(a)) that describes the opposition such Na2O-K2O-Al2O3 and Fe2O3 suggests that the majority sulphide (pyrite and pyrrhotite) is not linkable to the various hydrothermal alterations in mineralized metarhyolites. Aluminou alteration is associated with mineralized metaandesites (Figure 9(d)). Mineralized metarhyolites are enriched in Au, Ag, Ba, Bi, Cr, Cu, Eu, La, Mo, Ni, Pb, S, Sc, V and depleted in As, Sb, Co, Sn, Zn while mineralized metaandesites are enriched in Au, Ag, As, Mo, S, Sb and depleted in Co, Sn, Zn, Bi, Cr, Cu, Eu, Ni, Pb, Sc. Ba, La, V are immobile in metaandesites. Depletion in As, Sb in the mineralized metarhyolites and Au + As + Sb association in the unmineralized samples are not part of Au system in the Mangodara sector. Au mineralization is generally accompanied by enrichment in SiO2, K2O, Rb, Hg, Sb, Se, Te, Tl and Cs and depletion of Na2O-CaO-MgO and Ba [1] [67] [68] [69] .
5.3. Mobility and Guide for Exploration
Argillic alteration provides a useful mineralogical guide for Au mineralization of Mangodara sector [23] . We argue that the quartz-sericite-staurolite-kyanite-sulphide assemblage in the metarhyolite is typical of the proximal footprint hosting Au mineralization. Sulphides are the most important mineral assemblages responsible for Au mineralization in the Mangodara sector, as indicated by the mobility of elements causing enrichment in K2O, FeO and depletion in other major elements: CaO, MgO, Na2O, Al2O3, SiO2. The enrichment factor of Au, Ag, S in the mineralized samples and their association Ag + S shows they can be used as an exploration guide in the Mangodara sector. Indeed, Au mineralization of that sector is of the argentiferous type [23] . Therefore, the well-known indicators like Ag, As, Sn should be moderately considered here at Mangodara
6. Conclusions
Gold and base metal occurrences of Mangodara sector are hosted in the highly metamorphosed altered volcanic rock made up of metarhyolites, metadacites and metaandesites. The metamorphism reached the amphibolite facies according to index minerals like kyanite, staurolite, garnet and sillimanite. The study of the mobility of geochemical elements carried out along two boreholes revealed the following points: 1) sulphides are the most important mineral assemblages responsible for Au mineralization in the Mangodara sector; 2) The geochemistry of the mineralized zone is characterized by the association of Au + Ba + Cu + Eu + La + Mo + Ni + S in metarhyolites and of Au + S + Sb + As + Ag + Bi in metaandesites; 3) The concentration of Fe2O3, S and Cu is attributed to the presence of Fe-Cu sulphides (pyrite, pyrrhotite and chalcopyrite) indicating that sulphides are vectors of themineralization zone in the Mangodara sector; 4) Addition of CaO, MgO; Na2O, Al2O3, K2O, SiO2 is a function of the resulting alteration, as evidenced by aluminous alteration, sericitization, chloritization, biotitization, and carbonatation; 5) Metal associations Ag + S can be used as a guide for Au exploration in the Mangodara sector; 6) The well-known indicators like Ag, As, Sn seems therefore not to be mandatory as indicators of Au for exploration purposes in the Mangodara sector
Acknowledgments
This work is part of the first author—Bernadin Gnamou (BG) PhD work. The author is grateful to the ministère de l’enseignement supérieur et de la recherche scientifique et de l’innovation for granting three years scholarship through the Programme d’Appui à l’Enseignement Supérieur (PAES).