Journal of Geographic Information System
Vol. 4 No. 2 (2012) , Article ID: 18782 , 7 pages DOI:10.4236/jgis.2012.42021
Considerations for Implementing OGC WMS and WFS Specifications in a Desktop GIS
Department of Geosciences, Idaho State University, Idaho Falls, USA
Email: chris@chrismichaelis.com
Received December 29, 2011; revised February 5, 2012; accepted February 18, 2012
Keywords: OGC; WFS; WMS; Geographic Information Systems; Open Source GIS
ABSTRACT
An implementation of the Open Geospatial Consortium Web Feature Service (WFS) and Web Map Service (WMS) specifications in an open source desktop GIS is presented together with a discussion of considerations for improving the use of web services data in desktop applications. In our implementation, WFS and WMS services are consumed by a plug-in to MapWindow GIS [1], allowing the end user to view WFS, WMS and ArcIMS data, including data from the ESRI Geography Network, in a transparent manner that can be configured for either data analysis and modeling, or data visualization. This implementation in an open source GIS allows for others to view and use the code, improve it, and otherwise implement the suggested considerations in other GIS platforms. Specific considerations proposed here include: pre-fetching through envelope optimization, tile display, and feature complexity reduction. These strategies improve the speed and responsiveness with which data can be viewed and analyzed. Comparisons made with other webbased data access implementations are used to evaluate whether these techniques provide performance benefits, and under which circumstances.
1. Introduction
Web-based geographic information system (GIS) tools are increasingly used for basic mapping and data visualization tasks (e.g. Google Maps, MapQuest.com, and ArcIMS) and complex web mapping and data analysis software tools continue to be developed. In spite of this apparent migration of GIS to the web-platform, desktop or client-side GIS tools are likely to continue to be needed for a variety of use cases in the foreseeable future. The primary standards issuing entity for the GIS community, the Open Geospatial Consortium (OGC) has released web-based GIS specifications which are arguably the most widely adopted of its standards, and are used primarily for web based GIS tools. OGC standards such as the Web Map Service (WMS) and Web Feature Service (WFS) have proven to be useful for normalizing and improving the manner in which data is shared across the Internet, and as such they are expected to grow in popularity and usage. The purpose of this paper is to present a case study with lessons learned from the implementation of both WFS and WMS support in a client side desktop GIS application.
The stated mission of the OGC is “to lead the global development, promotion and harmonization of open standards and architectures that enable the integration of geospatial data and services into user applications” [2].
This is accomplished through the authoring of specifications which are created by “structured committee programs and consensus process” by which participants in a wide range of scientific disciplines may contribute to the specifications. A specific goal of the OGC is to address the problem of data sharing—a problem that includes both interoperability and communication—and ultimately arrive at “a world in which everyone benefits from the use of geospatial information and supporting technology”. OGC has attempted to address some of the fundamental problems of data sharing by specifying common formats for wide-scale understandability in distribution, for facilitating geoprocessing, and for interoperability between disjoint software products.
Web based GIS systems are not suitable for every GIS task because they can be slow and unresponsive due to large data sizes and in many cases do not provide access to raw data sources. For example, the US Geological Survey Seamless Data Server [3] is a useful web based GIS system but which is often ineffective to use for operational activities because of the number of users and volumes of data being processed. Indeed, the combination of large geospatial data sets and high popularity (such as with the USGS Seamless Data Server) can ultimately impair usability. Interestingly, both MapServer [4] and ArcGIS Server [5] offer scalable service (e.g. they are fast, and remain fast for many simultaneous users) when simply providing data via WFS, WMS, or ArcXML (an ESRI specific XML specification used by ArcIMS). The primary computational overhead with web based mapping tools is associated with map display, not data distribution. Simple map servers such as Google Maps, Yahoo Maps, and MapQuest have become popular due to their ability to create a seamless, interactive map viewing experience for end users; however, browsing and acquiring scientific geospatial data through GIS web servers is still often a tedious process.
Geoprocessing can also be challenging when working with strictly web based GIS tools because of data transfer speeds and general web based geoprocessing capabilities. An example of a web based GIS that can perform advanced geoprocessing is the USGS StreamStats [6] system. This tool allows one to select a point on a map and then delineate a contributing drainage area from this point and calculate several catchment properties. A web service such as this can make simple calculations and provide results through a web browser. However, more complex analytical and mathematical analyses can be challenging to operate in this way, especially when calculation of results is time intensive.
Many of the challenges associated with web based mapping tools are largely overcome through the use of desktop GIS applications following the client-side computing model. Speed of visualization and data interaction is rarely an issue on desktop based GIS tools using graphics technologies such as GDI+, DirectX or OpenGL [7]. Additionally, inexpensive desktop computer storage and memory can be used to improve computing speed and display capabilities. When working on a local or client-side computer, local copies of data are always available, and advanced geoprocessing tasks which can be time-consuming may be performed.
In spite of these benefits of traditional desktop based GIS tools, client-side GIS systems can suffer from two obvious problems: outdated data sources and the inability to easily share data. Both of these are areas in which the web based GIS tools excel. One could argue that a mixed approach, combining the best features and capabilities of client-side and web based GIS tools, would be ideal. We explore an approach for making use of web-oriented OGC standards in a desktop GIS application. The result is a system that benefits from local processing and data storage capabilities while using web based data services to solve the problems of outdated data sources and difficult data sharing. Specifically, the WMS and WFS specifications are implemented in a client-side GIS in a case study that tests several optimization methods, improving performance for data visualization and analysis on a local desktop GIS platform. The methods presented here can be implemented together with other established optimization techniques including data caching, multithreading and pyramids for raster data [8].
2. Methods
The open source MapWindow GIS desktop application [1] was selected as a case study implementation platform for this project. MapWindow GIS is programmed in the Microsoft.NET Framework [9], with a plug-in framework that encourages separation of logic and data layers such that code can be easily transferred to other GIS applications and platforms. Specifically, we developed an online data plug-in for MapWindow as a desktop data interface for access to WFS data for feature (vector) data such as points, lines and polygons, and WMS data for preassembled map imagery. ArcXML [10] data sources such as ESRI ArcIMS Servers are also supported to make use of the large data volume presently available in that form. In addition to providing access to remote data sources, our implementation demonstrates three specific data visualization and downloading techniques including request envelope optimization, tiled display, and feature simplification. The tool also allows data to be downloaded and saved locally. Possible optimization modes when using data directly from online sources include optimization for geoprocessing without attributes, optimization for geoprocessing with attributes, or optimization for simplified viewing. The three optimization techniques explored are presented in the following sections.irst, confirm that you have the correct template for your paper size. This template has been tailored for output on the custom paper size (21 cm × 28.5 cm).
2.1. Request Envelope Optimization
The first optimization uses an envelope optimizer referred to as a detail square grid (DSG). This is a recursive grid or quadtree structure (Figure 1) of short integer data indicating the current status of each cell within that grid. The initial size of the grid and the initial size of grid cells are determined by user-configurable options. Each tile of this grid is downloaded separately allowing real-time adjustment of target data downloaded sizes to take place, based on the time that a given cell takes to transfer. After each dataset tile is transferred, the transfer time is evaluated and each grid cell may be broken down into sublevels. In this case, each grid cell contains another instance of a DSG which further divides that cell. All functions from outside the optimizer are called on the outer level DSG. This means that analysis functions are all recursive in order to expose multiple sublevels of grid cells. Since the grid may have a large depth of grid cells, this provides a great deal of scalability in quickly providing data updates to the user, automatically adapting to the connection and transfer speeds available. Because
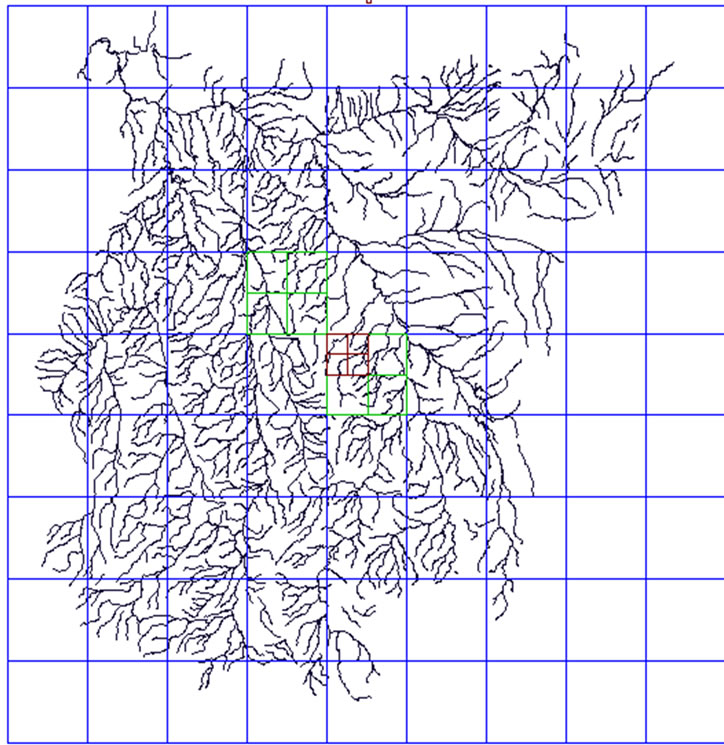
Figure 1. Detail Square Grid (DSG). Any given grid cell may recursively contain another instance of a DSG.
some data transfer bandwidth may be consumed in the overhead of multiple requests to download multiple tilesrather than fetching all data at once, the design of the DSG is intended to provide the user with data as quickly as possible. This allows the user to examine and work with the data while additional data continues to download in the background.
The view optimizer instantiates the DSG object with the corner coordinates, the desired cell size, and the number of rows and columns of the data in question. Priorities are established for each grid cell; these priorities are updated through function calls. The most important function in this process increases the priority level by two for tiles which are entirely contained within the given extents, also called an envelope, and increases the priority level by one for tiles partially intersected by the given extents. As the user zooms, pans and interacts with the data, this continual update of prioritization creates an effective preference map for cells in the DSG. When a new tile is ready to be retrieved, a function call to the optimizer provides the envelope for the highest priority data that is pending retrieval. The optimizer works solely in terms of extents or envelopes, separating it from the type of data being optimized. The technique is illustrated in Figure 2. This approach is similar to the tiled display observed in Google Maps, which also aims to display an overview quickly and provide additional data as needed.

Figure 2. Flowchart showing the general operation of the Detail Square Grid (DSG).
The key difference is that Google Maps provides low resolution data followed by higher resolution data on every zoom or pan, whereas the DSG technique continues to retrieve high-resolution data for areas outside of the current view, choosing tiles in an arrangement determined to be optimal to retrieve areas likely to be viewed next. This difference can be attributed to different target audiences and intended uses of a simple web based map viewer, versus a desktop GIS intended for complex data analyses.
2.2. Tiled Display Optimization
After retrieving the desired data envelope to download, a request may be formulated using extensible markup language (XML) [11] for WMS or WFS, and using ArcXML [4] for ESRI services. In the case of WMS, this request will return an image of the map tile requested. Merging this new data with already-displayed data can present a problem with respect to speed and seamless interaction. One approach is to dynamically merge newly downloaded high-resolution imagery with a low-resolution backdrop, resulting in one image file with mixed quality (i.e. merged tiles of varying resolution). Following this approach, additional imagery transfers would then cause the single client-side image file to be composed of increasingly high resolution elements. This approach is relatively slow and may be undesirable because of radically different cell sizes caused by a resized viewing window, and recomputed download tile sizes at different transfer speeds.
A second approach involves using GIS drawing engine optimizations to avoid examining images that are not in view or which are covered. In this case, a low-resolution backdrop is added as the first layer, and then high-resolution tiles are added to the map as they are downloaded and become available (Figure 3). This approach is better for speed of visualization, because the GIS drawing engine displays new layers almost instantaneously since no data merging is required. In the MapWindow GIS implementation of this approach, a side effect was the appearance of legend entries for each separate tile as a new layer in the MapWindow legend. This was avoided by flagging the additional layers as invisible to the legend. In so doing, the results are displayed in an effective mechanism for showing increasingly detailed data with no speed lost to data merging.
2.3. Feature Retrieval and Feature Simplification Optimization
When requesting feature data, it can be important to retrieve any feature which falls within the requested envelope, and return the entire feature rather than a feature clipped to the requested boundary. The OGC Filter Encoding Implementation Specification [12] indicates that the bounding box operation “should identify all geometries that spatially interact with the box in some manner”, making the bounding box operation well-suited for this task. When formulating an ArcXML request, the “areaintersection” operation performs this same task. For speed purposes, it is useful to drop attribute data if it is unneeded (a preference specified by the user). ArcXML provides a mechanism for this, but the OGC WFS specification lacks the ability to ignore or drop attributes from received data.
A WFS server returns data to the client using the geographic markup language (GML), an XML grammar; ESRI servers typically return data in the ArcXML format, a proprietary but published format. For our case study implementation, this data must be converted to the more common shapefile format which is natively supported by many GIS software packages. This step occupies a small but notable portion of CPU time. Presumably a desktop GIS with native GML support would not experience this specific delay.

Figure 3. Display mechanism for showing high-resolution data over low-resolution data, as new data is downloaded. Note the new tile added in the top-right corner.
A number of methods for efficient transfer of vector data have been proposed an implemented in different software packages [13,14]. In our implementation, for feature simplification optimization, once data has been downloaded and converted to the shapefile format it is added to the GIS application’s map view window. If optimization for geoprocessing has been selected, the features will be immediately merged into a single shapefile to facilitate analysis functions. If optimal visualization is selected for the data download method, each individual tile will be added to the map, thus using a form of the tiled display optimization developed for WMS services. Additionally, this visualization method will attempt to simplify vector features for a smaller number of overall vertices. The goal is to remove all vector vertices from the data that have no notable effect on the final display of the data due to their density (Figure 4). A final pass over the shapefile is made using a modified implementation of the Douglas-Peucker algorithm [15], which was originally intended to simplify polyline point arrays.
2.4. File Management and Project Saving Considerations
The visualization optimizations described above result in multiple individual parts present in the map, all associated with a single data layer but stored in separate files. Because of this, it is crucial to track all temporary files used, both for timely cleanup and to aid in correct project saving functionality. When a map project is saved, it is necessary to ensure that layers originating from an online data source do not get saved to the project file from temporary locations. If this were to occur, the project would reference a temporary file that will not persist upon reopening the project file. MapWindow allows plug-ins to specify settings which are saved to, and loaded from, the main project file. This allows the software to prepare an XML segment detailing the source of all online data layers in enough detail to rebuild the project from the online data when reloaded. This has the added advantage that a project compiled from online data sources takes a very small amount of disk space to store (typically less than 50 KB). One potential downside to this approach is that when the project is re-opened and the computer does not have an active internet connection, the datasets will not be viewable unless initially the user specified download of local copies of the data.
3. Results and Discussion
The client-side GIS approach and case study implementation presented here resulted in a viewing system for online data that can be easily integrated with existing local data on a desktop GIS. The approach addressed the goal of building upon the strengths of both web based and client-side GIS tools in an integrated “web-enabled” GIS system that optimizes viewing and download of data for analysis.
Our WFS and WMS case study implementation was compared with on-line data functionality in two existing GIS systems: uDig, ArcExplorer, and ArcIMS HTML Viewer. A dataset comprised of several different data types (vector and raster) was accessed using each GIS application, with twenty replicates of the same dataset tested using the same client computer and network connection, and connecting to the same server. Tests were

Figure 4. Removing redundant vertices as no impact on visual appearance and a negligible initial time impact.
repeated for varying numbers of features and varying raster resolutions. The time to acquire an initial view of the dataset for both vector and raster data was measured (ti), as well as the time to download and display all data (tf). Initial and final raster quality (qi and qf, respectively) were evaluated qualitatively using a one-to-ten scale, where ten is highest. Data sources tested include point, polyline and polygon vector data and a raster image representing a 30-meter digital elevation model (DEM). Datasets were served using both ArcIMS in the ArcXML data format, and by MapServer using OGC WFS or WMS as appropriate. The measured values for ti and tf from each application were averaged for each given data type and metric.
Figure 5 shows the time analysis results from this comparative study, with our results on the Y axis and results from the tested tools on the X axis. Each point represents a single average of all replicates performed with the given software. A 1:1 line is shown for reference; any point to the left (or above) the line indicate occurrences where our tool was slower than the comparison product, while points to the right (or below) the line indicate occurrences where our tool was faster than the comparison product. The plot indicates that our tool performs faster than ArcExplorer about half of the time. This is consistent with designed behavior where an initial display is presented as quickly as possible, yielding the fast initial access (ti) times. After initial view, the remaining data is downloaded in prioritized pieces in the background, yielding the slower final display (tf) times. Our implementation performs better than uDig in all cases except one (a final display time), and performs better than the ArcIMS HTML Viewer for initial data display.

Figure 5. Time to load and display data using our online data plugin (ODP) versus comparison tools.
The final display time (tf) is omitted from the plot for the ArcIMS HTML Viewer, because the test is not applicable (the initial display is the only display, thus there is no “final” time to observe).
The complete data load (tf) of polyline features in our tool requires a full 170 seconds while ArcExplorer requires only 68 seconds. Our tool consistently falls behind ArcExplorer for a complete data load, but provides an initial view (ti) several seconds faster. Our tool is typically faster than uDig for initial display by a large margin, and is faster than uDig for a complete data load in several cases. Qualitative measures of raster quality indicated that the initial quality in our tool is less than that of comparison products, but that the final load quality in our tool was higher than comparison products—again reaching the designed behavior.
4. Conclusions
Applications that require access to shared data for visualization and analysis could potentially be improved by the concepts presented here. The ArcXML capabilities of our online data plug-in implementation provide an additional way to work with data when a given ArcIMS website gateway does not yield itself to the task at hand, such as digitizing points from an ArcIMS image background. The website interface may be bypassed entirely, using the underlying data directly and thus allowing the task to be completed easily.
In summary, the primary contributions of this work include the development of a request envelope optimizer to determine what data to download, as well as implementtation of a tile-based display approach and vector feature simplification techniques. The implementation and comparative study presented here have demonstrated the potential for these optimizations with respect to data analysis and display, as a case study to implementation of WFS, WMS and ArcXML data integration within a desktop GIS platform.
5. Acknowledgements
This research was funded by the Pacific Northwest Regional Collaboratory as part of a Pacific Northwest National Laboratory project, funded by NASA through Grant No. AGRNNX06AD43G. This work was also supported in part by the NSF-Idaho EPSCoR Program and by the National Science Foundation under award number EPS-0447689.The authors express gratitude to Patricia Mercer for her editing assistance.
REFERENCES
- D. P. Ames, C. Michaelis and H. Dunsford, “Introducing the MapWindow GIS Project,” OSGeo Journal, Vol. 2, 2007, pp. 8-10.
- Open Geospatial Consortium, Inc., “Vision and Mission,” Accessed December 2011. http://www.opengeospatial.org/ogc/vision
- United States Geological Survey, “Seamless Data Distribution System,” Accessed December 2011. http://seamless.usgs.gov/
- University of Minnesota, “MapServer,” Accessed December 2011. http://mapserver.org/
- Environmental Systems Research Institute (ESRI), “ArcIMS,” Accessed August 2009. http://www.esri.com/software/arcgis/arcims/index.html
- United States Geological Survey, “StreamStats,” Accessed December 2011. http://water.usgs.gov/osw/streamstats/index.html
- F. Yuan, “Windows Graphics Programming,” Prentice Hall, Saddle River, 2001.
- C. Yang, D. W. Wong, R. Yang, M. Kafatos and Q. Li “Performance-Improving Techniques in Web-Based GIS,” International Journal of Geographical Information Science, Vol. 19, No. 3, 2005, pp. 319-342.
- T. Thai and H. Lam, “NET Framework Essentials,” O’Reilly Media, Cambridge, 2003.
- Environmental Systems Research Institute, “ArcXML Programmer’s Reference Guide,” Accessed August 2009. http://edndoc.esri.com/arcims/9.1/
- W3C Consortium, “Extensible Markup Language (XML) 1.0,” 2nd Edition, Accessed August 2009. http://www.w3.org/TR/2000/REC-xml-20001006.pdf
- Open Geospatial Consortium, Inc., “Filter Encoding Implementation Specification,” Accessed August 2009. http://www.opengeospatial.org/
- H. Han, V. Tao and H. Wu, “Progressive Vector Transmission,” Proceedings of the 6th AGILE Conference, Lyon, 24-26 April 2003.
- B. Yang, R. Purves and R. Weibel, “Efficient Transmission of Vector Data over the Internet,” International Journal of Geographical Information Science, Vol. 21, No. 2 2007, pp. 215-237. doi:10.1080/13658810600894281
- D. Douglas and T. Peucker, “Algorithms for the Reduction of the Number of Points Required to Represent a Digitized Line or Its Caricature,” The Canadian Cartographer, Vol. 10, No. 2, 1973, pp. 112-122.