Spectral studies of transition metal complexes with 25, 26 dioxo1,6,12,17,23,24 hexaazacyclohexacosa 1,5,12,16 tetraene macrocyclic ligand (L) ()
1. INTRODUCTION
Schiff bases are widely studied because of increasing recognition in biological system [1] e.g. antimicrobial, antiviral, antifungal, antitumour and other biological activities particularly with first row of transition metal complexes [2-9]. Macrocyclic compounds are similar in structure and reactions to many naturally occurring compounds, Which are known to exhibit selective cation complexation [10,11]. The chemical properties of macrocyclic complexes can be turned to force metal ions to adopt unusal coordination geometry. Transition metal macrocyclic complexes have received much attention as an active part of metalloenzymes [12] as biomimic model compounds [13] due to their resemblence with natural proteins like hemerythrin and enzymes. Synthesis of transition metal complexes of new aza macrocycles with different cavity sizes donor types, ring substituents etc. under different experimental conditions have resulted in a large number and variety of compounds [14,15]. Because of the numerous areas of chemistry where aza macrocyclic complexes have found a niche, the preparation of new macrocyclic ligands with ever more elaborate structures is also a vital area of research. In view of the above applications, the synthesis and characterization of transition metal complexes with such ligand is highly desirable. In this paper we report the synthesis and characterization of transition metal complexes with 25, 26 dioxo1,6,12,17,23,24 hexaaza cyclohexaneosa 1,5,12,16 tetraene macrocyclic ligand [L]. (Figure 1).
2. CHEMISTRY
All the chemicals used were of Anala R grade, and were purchased from Aldrich. Metal salts were purchased from E. Merck and were used as received. All solvents used were of standard/spectroscopic grade.
2.1. Synthesis of Complexes
All the complexes were prepared by template method. An ethanolic solution of diethylenetriamine [10 mL] and glutaricanhydride (10 mL) were mixed. To this soluction the ehtanolic solution of metal salt (0.001 mol) was added. The resulting solution was boiled under refluxed for six hours. The solution was then concentrated upto half of its volume under reduced pressure. On cooling the solution is precipitated out. It was filtered, washed with cold ethanol and dried over P4O10 under vaccum.
2.2. Physical Measurements
The C, H, and N were analyzed on a Carlo-Erba 1106 elemental analyzer. Molar conductance was measured on the ELICO (CM82T) conductivity bridge. Magnetic susceptibility was measured at room temperature on a Gouy-balance using CuSO4∙5H2O as a callibrant Electron-impact mass spectra were recorded on JEOL, JMS, DX-303 mass spectrometer, IR spectra were recorded on a Perkin-Elmer 137 instrument in Csl pellets. EPR spectra of the complexes were recorded as polycrystalline sample and in the DMF solution, at liquid nitrogen temperature for Co(II) and at room temperature for Mn(II) and Cu(II) complexes on E4-EPR spectrometer using the DPPH as the g-marker.
3. RESULTS AND DISCUSSION
Complexes: On the basis of elemental analysis, the complexes were found to have the composition as shown in Table 1.
The molar conductance measurement of the complexes in DMF correspond to be nonelectrolytic nature for Mn(II), Co(II) and Cu(II) while 1:2 electrolytes for Ni(II) complexes. Thus, these complexes may be formulated as [M(L)X2] and [Ni(L)]X2 (where M = Mn(II)Co(II), and Cu(II) and X = C1− and ). In the IR spectra of complexes, the shifting in lower side of a band [v(N-H)] and the band of amides II and III, suggest the coordination through nitrogen of –NH group (N4).
3.1. i.r. Spectra of the Complexes
The presence of the obsorption bands at 1410 - 1421, 1299 - 1319 and 1010 - 1031 cm−1, in the i.r. spectra Figures 2(a)-(c) of the Mn(II), Co(II) and Cu(II) of nitrato complexes suggest the both nitrate groups are coordinated to the central metal ion in a unidentate fashion [16-18]. The Ni(II) nitrato complex exhibits a sharp strong peak at 1387 cm−1, which is in favour of an un-cordinated nitrate group [16,17].
3.1.1. Manganese(II) Complexes
The magnetic moment recorded at room temperature lies in the range 5.90 - 5.96 B.M. corresponding to five unpaired electrons. Electronic spectra of Mn(II) complexes in DMSO solution display four weak intensity adsorption bands (Table 2) in the 15,870 - 16,743 region (ε = 24 - 26 1∙mol−1∙cm−1), 20,356 - 21,685 (ε = 33 - 36 1∙mol−1 cm−1) 24,787 - 27,006 (ε = 61 − 64 1∙mol−1∙cm−1). These bands may be assigned to the transitions, 6A1g – 4A1g (4G), 6A1g - 4Eg, 6A1g (4G) (10B + 5C), 6A1g – 4Eg (4D)(17B + 5C) and 6A1g – 4T1g (4P), respectively [19].
The e.p.r. spectra were recorded at room temperature

Table 1. Molar conductance and elemental analysis data of complexes.
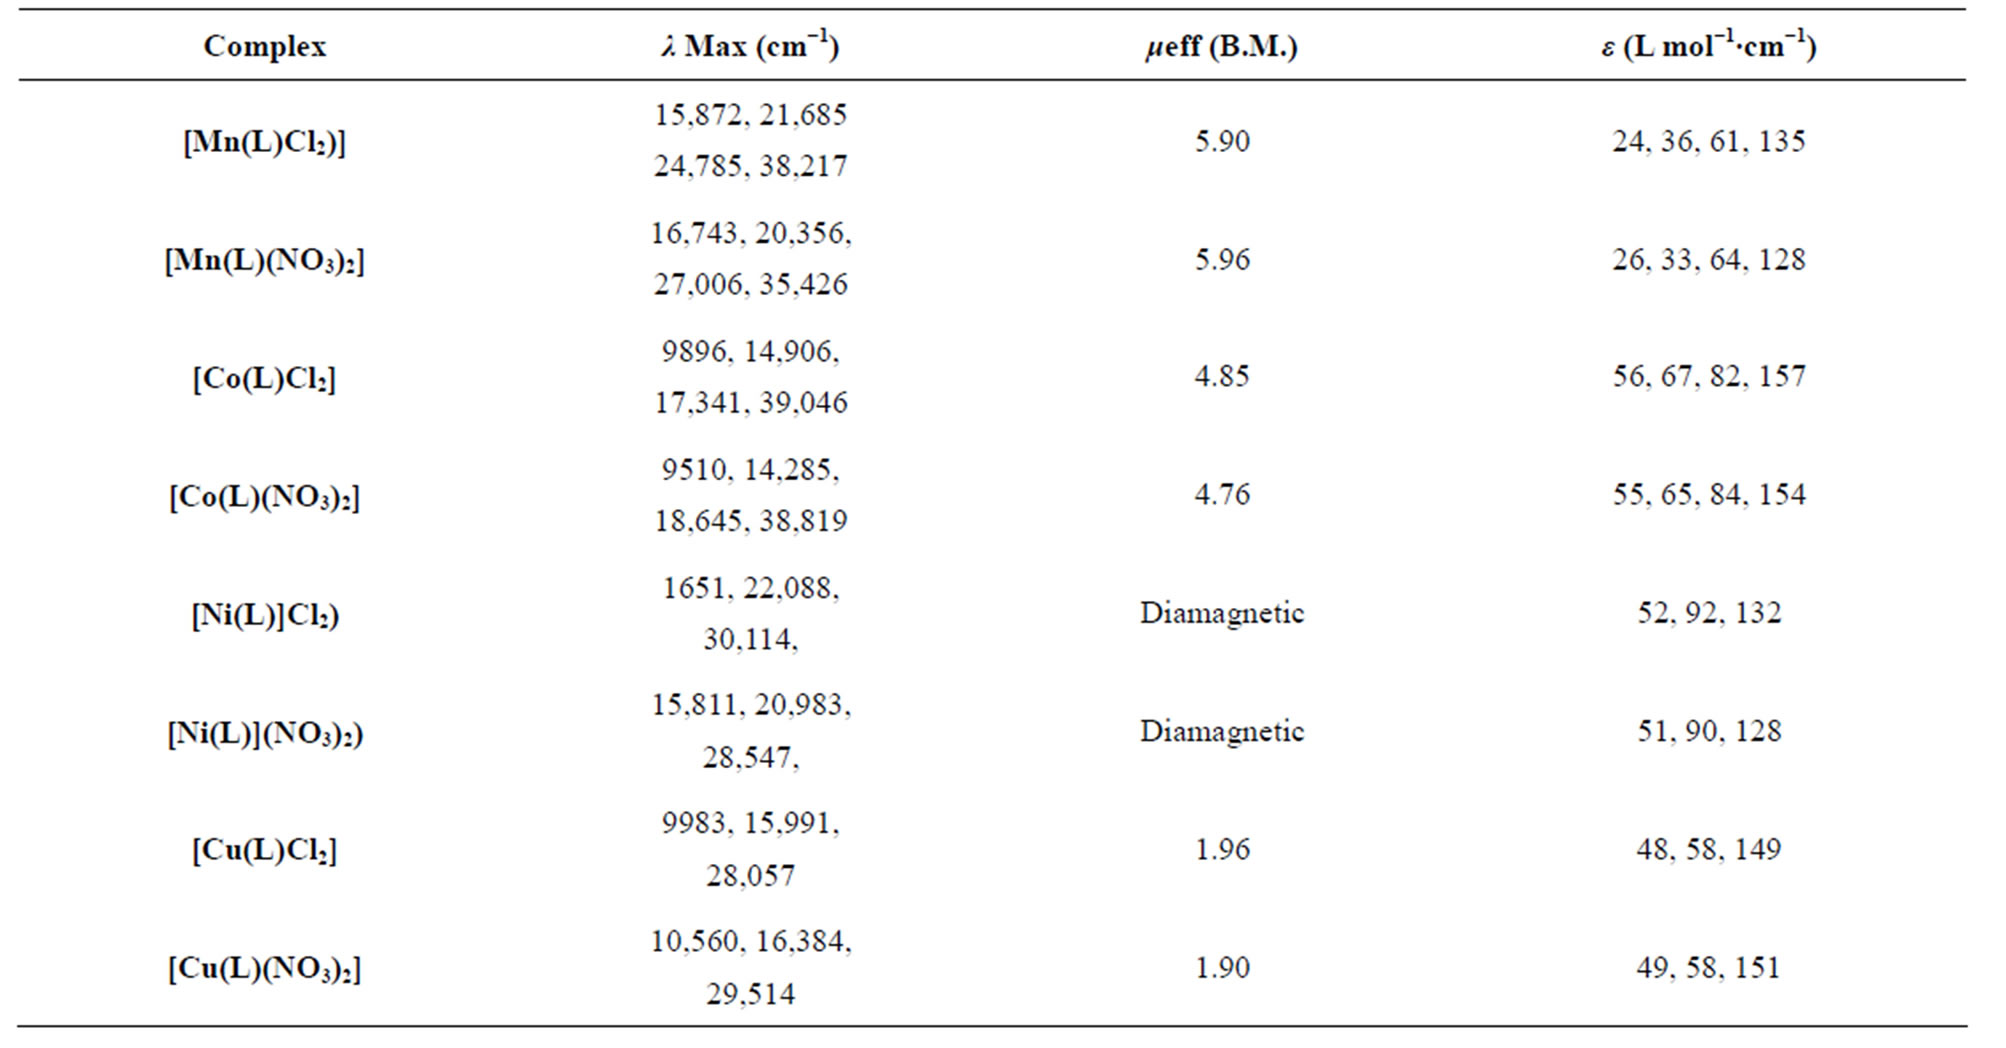
Table 2. Magnetic moments and electronic spectral data of the complexes.
as polycrystalline samples and in DMSO solution. The polycrystalline spectra give an isotropic signal centered at 2.04 - 2.16. The spectra recorded in DMSO solution gives well-resolved six line spectra due to the hyperfine interaction between the unpaired electrons with the 55Mn nuclear (1 = 5/2).
3.1.2. Cobalt(II) Complexes
At room temperature the magnetic moment measurements of cobalt(II) complexes lies in the range 4.76 - 4.85 B.M corresponding to three unpaired electron (Table 2). The electronic spectra of all the cobalt(II) complexes Figure 3" target="_self"> Figure 3 exhibit aborption in the region 6510 - 9896 (ε = 55 - 65 L∙mol−1∙cm−1), 14,285 - 14,906 (ε = 65 - 67 m∙mol−1∙cm−1), 17341-18645 (ε =82 - 74 L∙mol−1∙cm−1) and 39,046 - 38,819 cm−1 (ε = 154 - 157 L∙mol∙cm−1). These bands may be assigned to the transitions: 4T1g (F) – 4T2g (F) (v1), 4T1g – 4A2g (v2) and 4T1g (F) – 4T1g (P) (v3), respectively [20].
It is difficult to make the assignments for the fourth band and it may be considered as a charge transfer band. The position of these suggests an octahedral environment around the cobalt (II) ion.
The e.p.r. spectra of the Co(II) complexes were recorded as polycrystalline samples and in DMSO solution at liquid nitrogen temperature (LNT).
The g-values were found to be almost the same in both cases in polycrystalline samples as well as in the solution, (Table 3).
It indicates that the complexes have the same geometry in the solid as well as in solution. The large deviation in g-values, in the e.p.r. spectra, from the spin only value (g = 2.0023) is due to the large angular momentum contribution.
3.1.3. Nickel(II) Complexes
At room temperature these complexes show the diamagnetic behavior, indicating the square planar environment around the Ni(II) ion.
The electronic spectra of Figure 4 the Ni(II) complexes, exhibit three absorption bands in the range 15,812 - 16,510 (ε = 51 - 53 L∙mol−1∙cm−1), 20,983 - 22,088 (ε = 90 - 92 L∙mol−1∙cm−1) and 28,547 - 30,114 cm−1 (ε = 128 - 132 L∙mol−1∙cm−1). An examination of these bands indicates that the complexes have square planar geometry. These bands may be assigned to the three spin allowed
 (a)
(a) (b)
(b)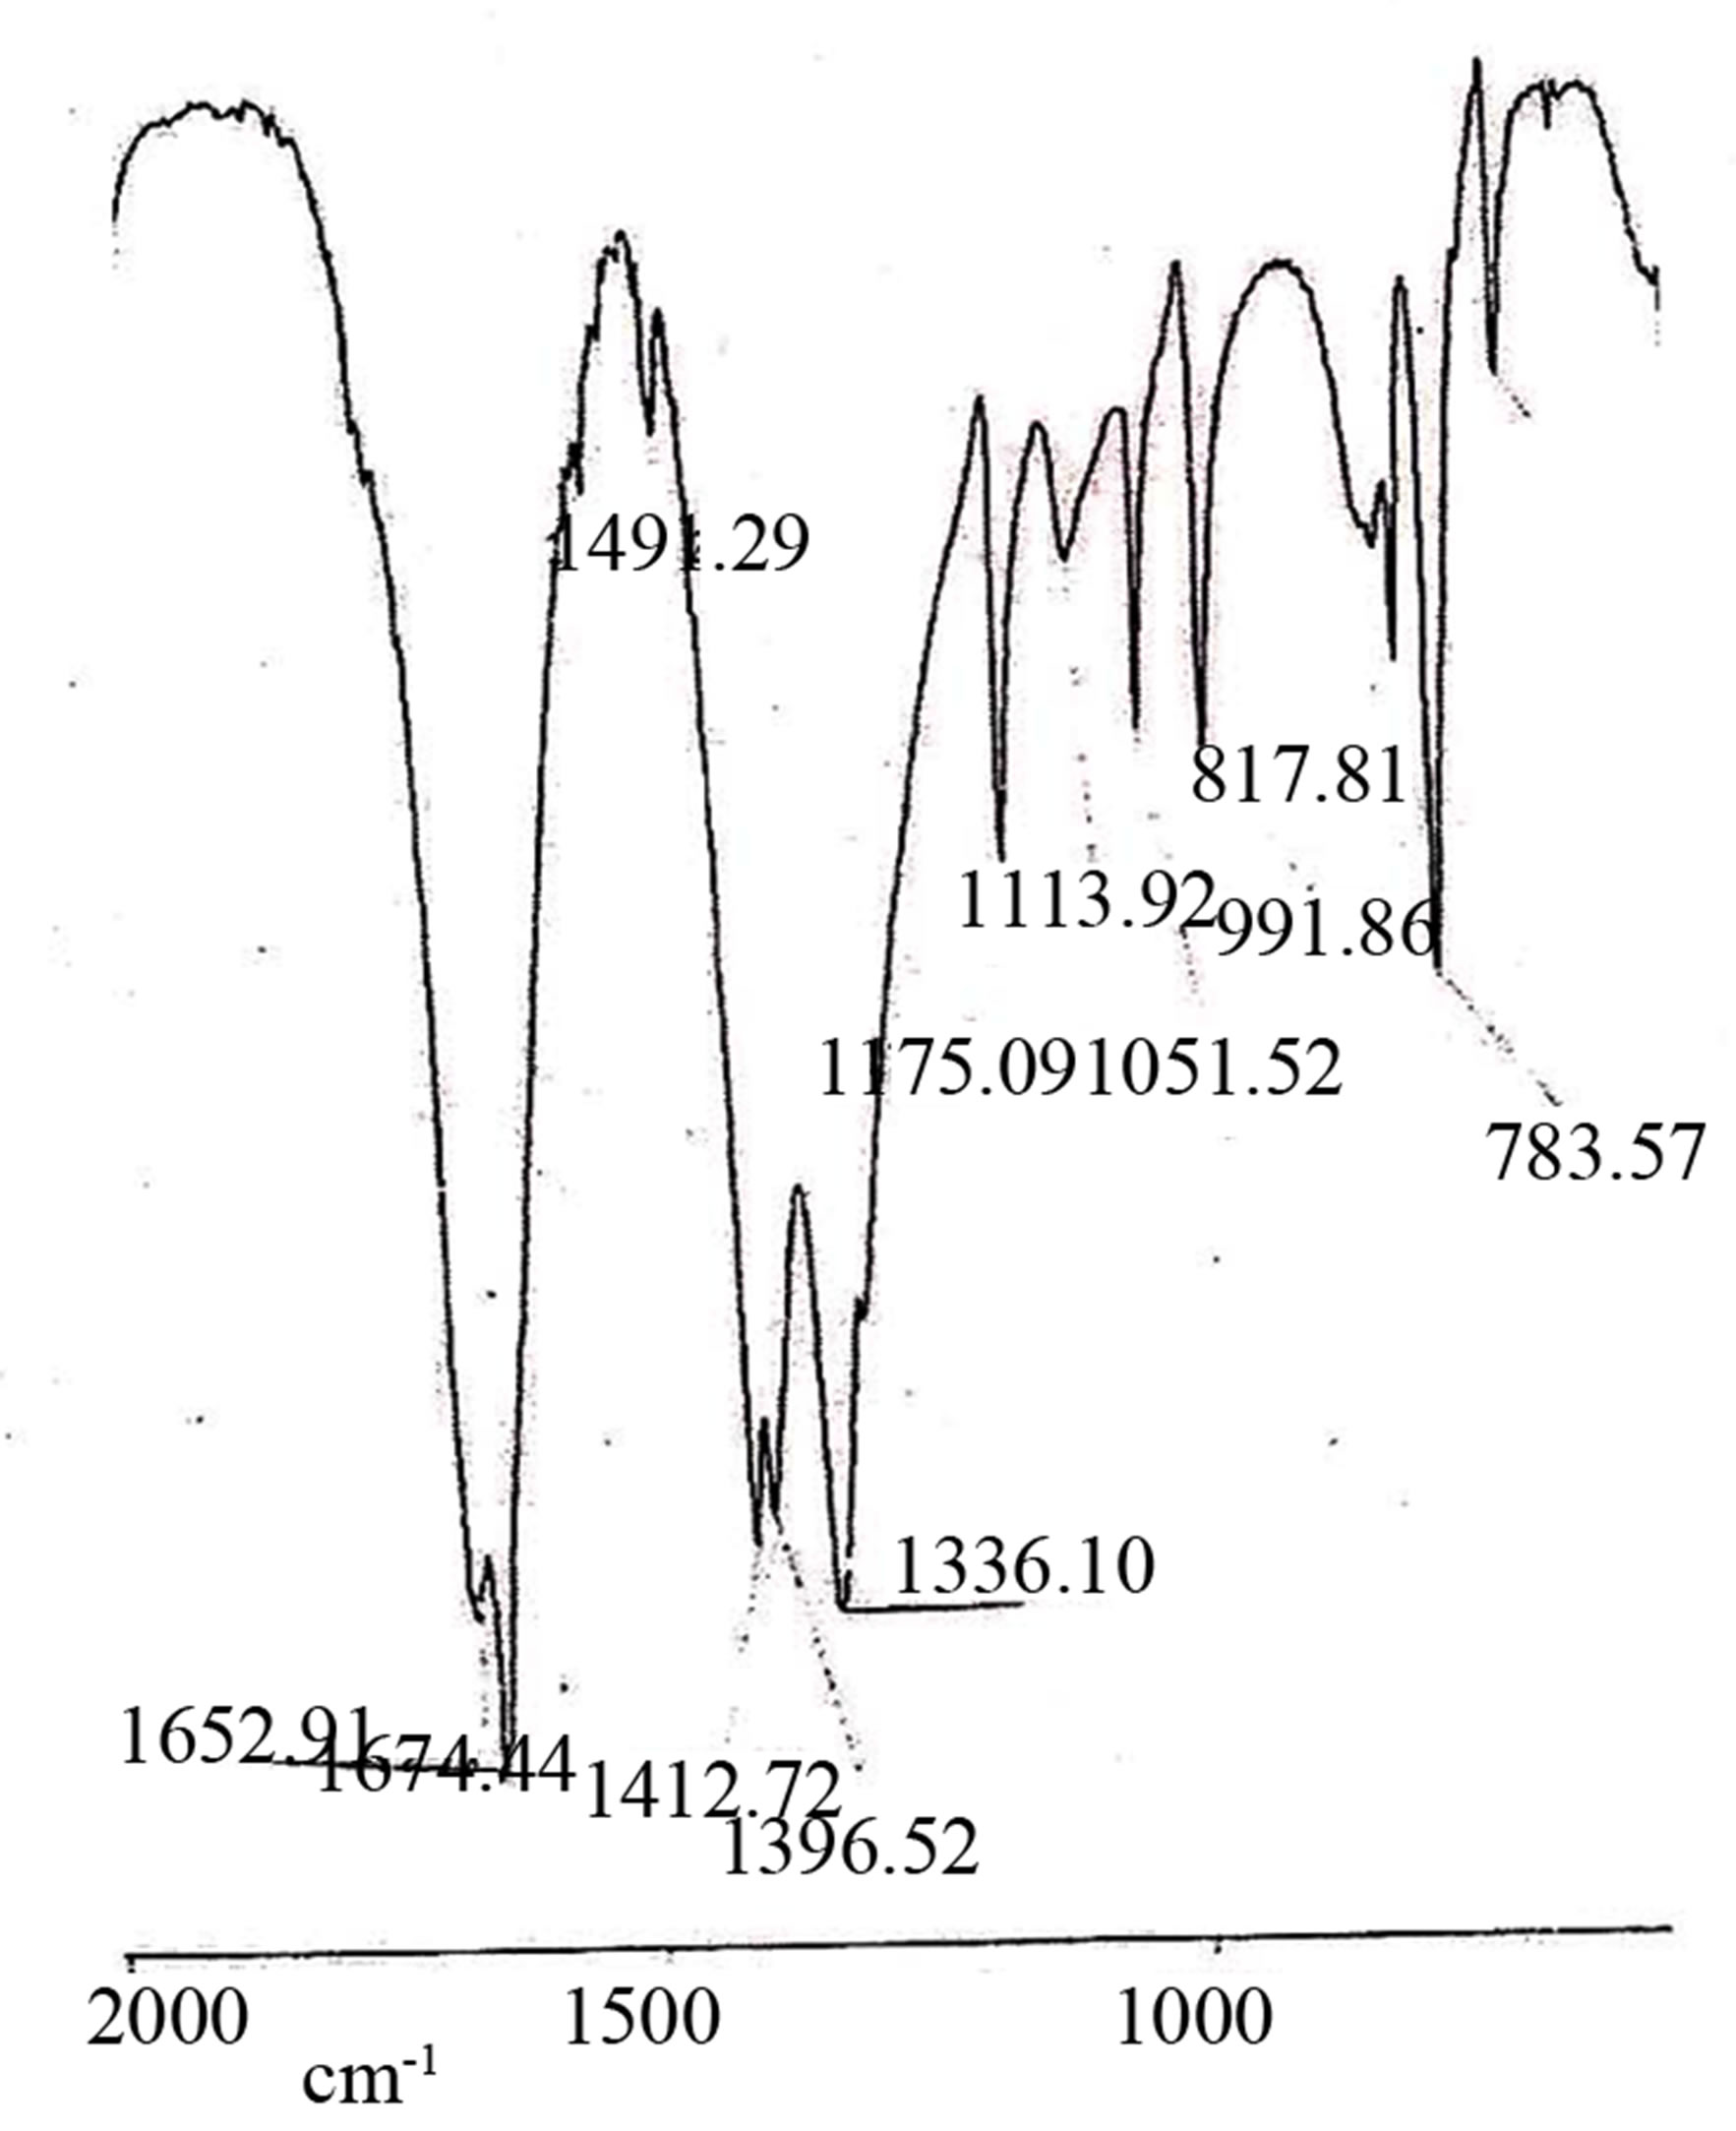 (c)
(c)
Figure 2. (a) IR Spectrum of [Co(L5)(NO3)2]; IR Spectrum of [Ni(L5)(NO3)2]; IR Spectrum of [Cu(L5)(NO3)2].

Figure 3. UV Spectrum of [Co(L5)(NO3)2].
transitions: 1A1g (D) (v1), 1A1g (D) – 1B2g (G) (v2) and 1A1g (D) – 1Eg (G) (v3), respectively [21].
3.1.4. Copper(II) Complexes
The magnetic moment of the Cu(II) complexes at room temperature lie in the range 1.90 - 1.96 B.M corresponding to one unpaired electron. The complexes may be considered to possess a tetragonal geometry.
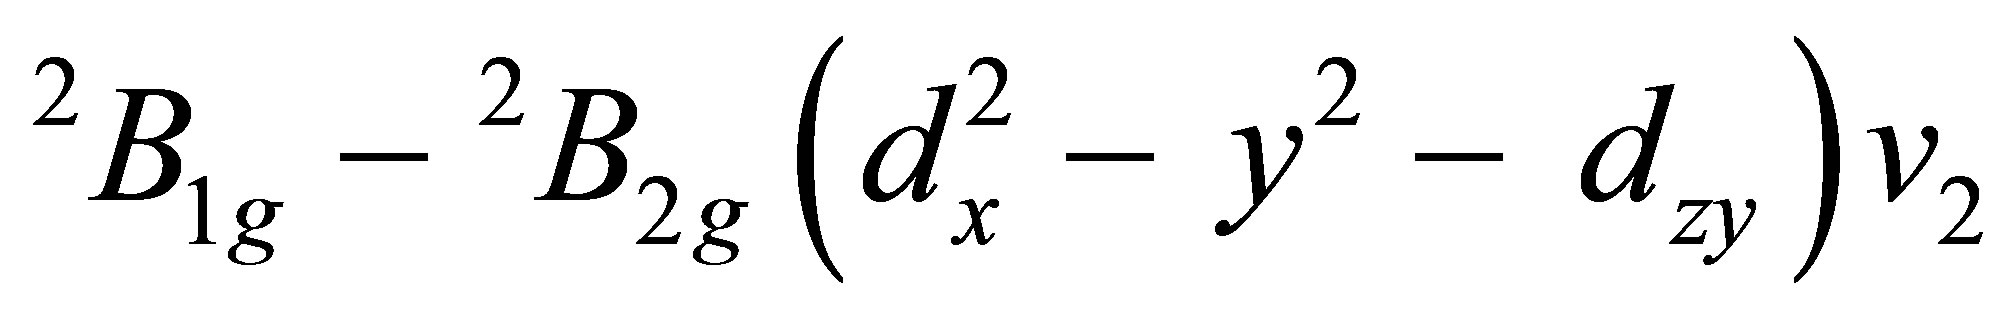
The electronic spectra copper (II) complexes Figure 5 display three bands (Table 2), in the 9987 - 10,560 (ε = 48 - 49 L∙mol−1∙cm−1) 15,991 - 16,384 (ε = 58 L∙mol−1∙cm−1) 28,057 - 29,514 (ε = 149 - 151 L∙mol−1∙cm−1) ranges. These bands corresponding to the transitions 
 and
and
 , respectively [22,23].
E.p.r. spectra of the Cu(II) complexes Figure 6 were recorded, at room temperature, as polycrystalline samples and in DMSO solution, on the X-band at 9.3 GHz under the magnetic field strength 3400 G. Polycrstalline spectra show a well-resolved anisotropic broad signal [20].
The analysis of spectra give g<< = 2.20 - 2.26 and g┴ = 2.06 - 2.10 (Table 3). The trend g<< > g ┴ 2.0023, observed for the complexes, under study, indicate that the unpaired electron is localized in the  orbital of the Cu(II) ion and the spectral figures and characteristic for the axial symmetry, Tetragonally elongated geometry is thus confirmed for the aforesaid complexes [24,25].
G = (g<< − 2)/(g┴ − 2), which is the measurement of the exchange interaction between the metal centers in a solid sample of the complex has also been calculated. According to Hathaway and Billing [26] if G > 4, the exchange interaction is negligible but G < 4 indicates the considerable exchange interaction in the solid complexes. The complexes reported here gives the ‘G’ value in the range 2.43 - 2.60, which is >4, indicating exchange interaction in the solid complexes.
3.2. Ligand Field Parameters
Various ligand field parameters were calculated for the complexes and are listed in Table 4.
The Values of Dq in Co(II) complexes were calculated from transition energy ratio diagram using the v3/v2 ratio [27]. Our results are in agreement with the complexes reported earlier [28]. The Nephelauzetic parameter β was readily obtained by using the relation: β = B (Complex)/B (free ion), where B (free ion) for Mn(II) is 786 cm−1, for Ni(II) is 1041 and for Co(II) is 1120 cm−1 [29]. The values of β lie in the range of 0.46 - 0.070 range. The values of β and indicate the appreciable covalent character of metal ligand “σ” bond. The graphical information contained in the Orgel energy leveldiagram [18,19]. Parameter B and C are a liner combination of certain Columb’s exchange integral and are generally treated as empirical parameters obtained from the spectra of free ions. In Mn(II) the values of B and C are calculated from the second transition because and depend on B and C parameters. The calculated values of the ligand field parameters are given in Table 4. Slater condon shortly parameters F2 and F4 are related to the Recah

Table 3. EPR spectral data of the complexes.

Figure 4. UV Spectrum of [Ni(L5)(NO3)2].

Figure 5. UV Spectrum of [Cu(L5)(NO3)2].
parameter B and C as: B = F2 - 5F4 and C = 35F4. The effect of covalence is to reduce the positive charge on the metal ion as consequence of the inductive effect to the ligand with reduced positive charge, the radial extension of the d orbital increases, this decreases the electronelectron repulsion, lowering the energy of the 3P states.

Table 4. Ligand field parameters of the complexes.
4. XRD
The XRD spectra have been recorded for all the complexes. For all the complexes the value of d is found to be same. This indicates that the complexes have same geometry. Hence on the basis elemental analyses, magnetic moment molar conductance, IR, EPR and X-ray diffraction pattern following structure of the complexes may be suggested Figures 7(a) and (b).
5. CONCLUSION
Complexes of Mn(II), Co(II), Cu(II) & Ni(II) with tetradentate macrocyclic ligand have been prepared and characterized. The proposed study reveled six coordinated octahedral geometry for Co(II), Mn(II) and square planer geometry for Ni(II) and tetragonal geometry for Cu(II) complexes. Various ligand fields and bonding parameters have been calculated and discussed.
6. ACKNOWLEDGEMENTS
Authors are thankful to UGC New Delhi for financial assistance and I.I.T. Bombay for recording EPR spectra.
NOTES