Development of a Performant Method for Glucocapparin Determination in Boscia senegalensis Lam Ex. Poir.: A Study of the Variability ()
1. Introduction
The glucosinolates (GSLs) are particularly abundant sulphur-containing compounds in the families of the Order Capparales - Brassicaceae, Tovariaceae, Resedaceae, Capparaceae and Moringaceae [1]. At least, 120 GSLs were identified in sixteen angiosperm families including a large number of edible species. The type of major GSL present varies largely between different plant species and the organ considered [2]. GSLs are associated in plants with enzymes called myrosinases (thioglucoside glucohydrolase, EC.3.2.3.1). Their hydrolysis into D-glucose and a variety of breakdown products is responsible for the pungent bitter taste of many cruciferous and spice plants. As a result of mechanical wound or pathogen attack, the GSLs and hydrolyzing enzymes come into contact and produce a number of hydrolytic products, in situ [3]. According to the substrate and the reaction conditions, the secondary products are mainly isothiocyanates, oxazolidines thiones, thiocyanates, nitriles and glucose (Figure 1).
Many properties of GSLs and their hydrolysis products are well known. The allylisothiocyanates are used as conservatives in food industry. Although they do not neutralize the free radicals before they can harm cells, as antioxidants and carotenoids would do, GSLs and their hydrolysis products are considered as indirect antioxidants by modulating the activity of xenobiotic metabolizing enzymes [3]. They have a protective effect by inhibiting the proliferation of cancer cells [4]. The hydrolytic products of alkyl and aryl GSL are cytotoxic to Salmonella thyphimurium (Tiedink et al., 1991 cited by [3]. Aurinia sinuate showed a powerful antimicrobial effect on Gram-positive and Gram-negative bacteria and fungi probably by the GSL degradation products such as isothiocyanates and nitriles taking into account their importance in the volatile products [5]. Many other works highlighted the biocide activity of GSL hydrolytic products. Given their occurrence, the use as substitutes to pesticides in seed and stored product treatments is desired in IPM. In this fact, the Capparaceae Boscia senegalensis was successfully tested in cowpea storage and peanut [6-8]. Its efficacy is due to the occurrence of glucocapparin in its organs. Indeed methylisothiocyanate (MITC) is released by hydrolysis of glucocapparin and
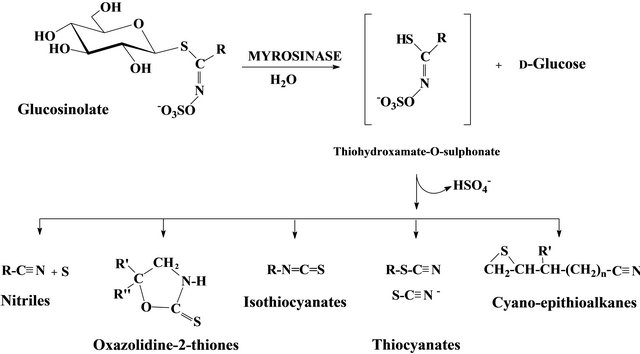
Figure 1. Myrosinase degradation pattern of glucosinolate.
responsible for the insecticidal activity on the bruchids Callosobruchus maculatus and C. serratus. Glucocapparin was identified in leaves of Cleome spinosa and C. chelidonii [9,10]. However, glucocapparin is less documented than other glucosinolates, undoubtedly due to the lack of commercial interest in it. It has been reported that in Western Africa, B. senegalensis holds a considerable nutritive value. The fresh and immature seeds are used like lentils after a process of cooking and complex scrubbing. In Senegal, these preparations are sold in the markets. Dried, they are transformed into flour and prepared into a type of couscous which is often used during the hardest scarth. A terrible year of dryness (1958) was baptized “the year of Boscia”, because it was with this species and its seeds or “peas” that many people survived [11].
Due to the fact that specific biological effects of different glucosinolates vary considerably, it is appropriate to develop sensitive and reliable method for efficient identification and quantification for the particular glucosinolate under investigation [12].
The object of this work is to develop a reliable and effective method to analyze glucocapparin in leaves and fruits of B. senegalensis and to analyze the effect of its localization on main secondary metabolite concentration. Therefore, we adapted the standard ISO 9167-1 method [13] described to analyze the glucosinolates in rapeseeds (Brassica napus). After validation of the analytical method, leaves and fruits of B. senegalensis from four localities in Senegal and different seasons are monitored in order to evaluate the variability of glucocapparin. In addition, an identification of the glucocapparin breakdown products is carried out by gas chromatography coupled with the mass spectrometry.
2. Experimental
2.1. Plant Material
Leaves and fruits of B. senegalensis were collected in four localities of Senegal: Dakar (1442'00"N, 1728'00"W), Thies (1656'W, 1448'N), Louga (1542'00"N, 1612'00"W) and Richard Toll (1628'00"N, 1541'00"W) between April 2010 and November 2011. Samples were collected from plants with the ripest fruits. Different phenological states leaves were collected at various levels of the plants. The plant identification was done at University of Dakar (IFAN) in the botanical section, maintaining the Integrity of the Specifications.
2.2. Preparation of Samples
In the laboratory, samples were dried at ambient temperature (25˚C ± 5˚C) to avoid the premature attack of the myrosinase. For the GSLs extraction, a fine crushing with crusher IKA ®A11basic was carried out.
2.3. Determination of Glucocapparin Content
2.3.1. Preparation of Sulfatase and of Sinigrine Solution
Sulfatase: 3 ml of water and 2 ml of ethanol were added to 75 mg sulfatase of Helix Pomatia (Sigma EC3161). The tube was placed in a vortex for 3 min before being centrifuged at 3000 rpm for 10 minutes. The deposit was discarded and 8 ml of ethanol was added to the supernatant. This mixture was agitated again with a vortex machine for 45 minutes after which the supernatant was collected. A last round of centrifugation at 3000 rpm was done after which the residue was transferred in 5 ml of distilled water.
Sinigrine: Sinigrine was taken as internal standard. A solution (20 µmol/ml) was prepared from the pure product of Sigma Aldrich (Ref.: 51647) which was dissolved in methanol/water 70:30 v/v solution.
2.3.2. Glucocapparin Extraction
50 mg of powdered B. senegalensis dry leaves or fruits were placed in 12 ml glass tubes. In a water-bath at 74˚C ± 1˚C, it was added in the test tubes (10 ml) 4.5 ml of a mixture methanol/water (70/30) beforehand heated to boiling then 1 ml of sinigrine 20 mM. 4.5 ml of the hot solvent mixture were added again in the glass. The solution is agitated during 15 min by means of a magnet. The whole was then centrifuged at 3500 rpm during 10 min. The supernatant was recovered thereafter.
2.3.3. Desulfatation and Purification of Extracted Glucocapparin
30 ± 5 mg of DEAE Séphadex A-25 are placed in a minicolonne (1 ml syringe). The column is washed with distilled water (2 fold 1 ml). pH is adjusted by elution of an acetate buffer (pH 5.8, 0.5 M, 2 ml). It is followed by a washing to distilled water (3 ml). 1 ml of B. senegalensis rough extract was introduced to the column. 1 ml (2 fold) of acetate buffer (pH 5.8, 0.0025 M) are eluded then 150 µl of sulfatase were added to column in order to form the desulfocapparin. After 15 hours, desulfocapparin are eluted by 4 × 0.5 ml of distilled water.
2.3.4. Measurement of Desulfoglucocapparin by HPLC
Desulfoglucocapparin are separated and quantified by HPLC (Agilent 1100 coupled to a DAD detector). The column was a VARIAN (INERTSIL 3 ODS-3, length: 100 mm, diameter: 3 mm, diameter of the particles: 3 µm). Eluant is composed of a mixture of acetonitrile and water (0 min: water 98.1%, 3 to 33 min: gradient from 98.1% to 80% of water, 33 to 45 min: gradient from 80% to water 98.1%). The mobile phase flow was of 0.5 ml/min and 20 µl of solutions were injected. The detector was performed at 229 nm and the temperature of the column was maintained at 30˚C.
By convention, and in respect to the standard ISO [13], glucocapparin is quantified in sinigrine equivalent according to the ratio areas of chromatographic peaks.
2.3.5. Identification of Glucocapparin Breakdown Products by GC-MS
Glucocapparin breakdown products and others GSLs were identified by gas chromatography (Agilent HP-6890 CG) coupled to a mass spectrometer (Agilent 5973 N). The spectral library was Wiley 275 L. 50 mg of crushed fruits/ leaves were introduced into a 10 ml vial with a septum. 250 µl of water and 5 mg of myrosinase (Thioglucosidase from Sinapis alba, Sigma) were added to facilitate hydrolysis. The flask was placed at 25˚C during two hours. The flask was placed at 25˚C during two hours. The volatile derivatives were sampled by SPME (Carboxen PDMS 75 µm fiber Ref 57344Supelco). GC-MS was realized on a HP-5MS ((5%-phenylmethyl)-siloxane, Agilent) column (length 30 m; diameter 250 µm; df = 0.25 µm. The oven temperature program was initiated at 40˚C, held for 5 min then raised first at 5˚C/min to 230˚C, raised in a second ramp at 30˚C/min to 280˚C with a final hold at this temperature for 5 min. The carrier gas is helium (pressure: 49.9 KPa, flow: 1 mL/min) and the injector split/splitless (in splitless mode) is maintained at 250˚C. The source of the mass spectrometer was fixed at a temperature of 230˚C and the scanned mass range was 50 to 350.
2.4. Validation of the Glucocapparin Quantification Method
The procedure of validation is in conformity with the Quality System of Good Laboratory Practice (Monographs of OECD). Glucocapparin not being currently available in the trade, 30 g B. senegalensis leaves collected in April 2011 at Richard Toll are crushed (crushing IKA) and introduced into 100ml methanol. After filtration, the supernatant were extracted with hexane before being evaporated at rotavapor. The liquid residue is then freeze-dried during 48 hours to remove any methanol and water trace. The powder thus obtained is redissolved in 100 ml methanol. Glucocapparin was thereafter defeated and purified on a Sephadex column (cf. 2.3.3) and constituted the desulfoglucocapparin basis solution. For 30 g B. senegalensis leaves, it was obtained 1.8 g of defeated powder. Desulfoglucocapparin content of this powder measured by HPLC (cf. 2.3.4.) was 198.23 µmol/g.
The required solutions to the linearity study are prepared by taking aliquots of the basis defeated solution added to a constant volume of 1ml of defeated sinigrine solution prepared in parallel and according to the same method.
The linearity was established by a variance statistical test based on the 3 lines of calibration resulting from the same solution. The linearity is accepted if the value criticizes F corresponding to a degree of confidence of 0.95 with 4 and 12 degrees of freedom is lower than value 3.26 (Table of distribution F of Snedecor). If the value of F is higher than 3.26, the linearity can be accepted if the two following criteria are observed:
• Determination coefficient R2 is higher than 0.996;
• The accuracy of one 4th series of calibration solutions shows an error lower or equal to 10% compared to the calculated straight regression line (excluded with the LOQ ≤ 15%).
The limits of quantification (LOQ) and detection (LOD) were evaluated by the measurement of the background noise of three analyses of the blanco.
LOQ = 5 × (background noise) + Standard deviation.
LOD = 3 × (background noise) + Standard deviation.
2.5. Analyze Statistical for the Follow-Up of the Contents of Glucocapparin
ANOVA (general linear Model) was applied to the data which were compared thereafter by the test of Tukey with P < 0.05 on Minitab 16.0.
3. Results and Discussion
3.1. Validation
Figure 2 represents the study of linearity obtained after glucocapparin desulfatation and five dilutions from a standard solution at 2.6 µmol/l. Linearity was determined using an analysis of variance based on tree replicates of each concentration. The non-linearity factor was compared with Snedecor distributions table (P = 0.95) with k1 = 4 (6 − 2), k2 = 12 (18 − 6). In these conditions, nonlinearity value was 3.26. The study of the linearity gave a factor F of 19.72. Equation of the average straight regression line was Y = 100.42X − 0.03 (R2 = 0.9998). The criterion F of Snedecor was not observed due to an exceptional repeatability between measurements. Linearity can however be accepted. Indeed, accuracy calculated through a 4th series of injections (Y’ = 98.96X + 0.55; R2 = 0.9993) was 99.9% ± 4.5%. This result fulfilled the requirements of our GLP validation procedures. LOQ and LOD estimated were respectively 0.72 and 0.44 µmol/g. These results confirmed the adaptation of the method to measure glucocapparin accurately. LOD and LOQ measured were in agreement with those reported in other studies [12,14,15].