Approximate Compositional Values and Tissue Fatty Acid Profiles of Nile Tilapia (Oreochromis niloticus L.) Fed Azolla-Diets in Earthen Ponds ()
1. Introduction
Aquaculture productions continue to increase, as a challenge to meet the ever-increasing demand for fish products worldwide. However, aquaculture enterprises are faced with the need to resolve the problem of increasing demand for fish meal (FM). Indeed, according to IFFO [1], global production of FM has stabilized at 6 to 7 million tonnes since 1985. Consequently, the prices has rising, driving research in the feed industry towards finding substitutes [2]. Azolla, a small floating freshwater fern that has been successfully used recently in fish farming [3-7] appears a good candidate. So far, research on Azolla in fish farming has strongly focused on its effects on growth performance and digestibility. No research on the nutritional quality of the fish produced is available, especially regarding fatty acid composition. Yet, there are concerns that high replacement of FM could adversely affect the marketability of the fish, because of consumer perception of altered taste or reduced health benefits due to lowered (n − 3) fatty acids content [8,9]. Indeed, the consumption of fish containing an adequate level of highly unsaturated (n − 3) fatty acids (n − 3 HUFAs) is favourable for human health [10,11], as these fatty acids series is believed to reduce the occurence of heart diseases, strokes and various inflammatory injuries as well as to improve neurological function in newborn infants [12,13]. Many studies have been carried out to evaluate the effects of non-conventional ingredients used in diets as FM substitutes on fish fatty acid composition [13-15]. Findings have confirmed that body fatty acid composition to a large extent mirrors the dietary fatty acids composition [13,15]. However, biochemical observations show that live organisms, especially copepods and rotifers have a more suitable fatty acid pattern for aquaculture purposes, due to their high content in EPA and DHA [16,17], which must not be negligible in tilapia pond aquaculture.
As part of investigations examining the suitability of AM to replace FM in diets for Nile tilapia O. niloticus, the main objective of this study was to analyse proximate composition and whole body fatty acids profile in response to feeding this fish with gradual levels of Azolla in stagnant earthen ponds.
2. Material and Methods
2.1. Ponds, Fish and Feeding Regimes
The experiment was carried out for 90 days in a rural site (6˚29'15.12''N 2˚37'6.42''E, 13 m above the mean sea level) at Louho, a village located in Porto-Novo suburb, Benin (West Africa). In that site, eighteen small ponds of 30 m2 (10 m × 3 m × 1 m, each) were constructed for the experiment. They were filled naturally from the water table. Fingerlings Nile tilapia of homogeneous size and age (initial body weight: 16.3 ± 0.1 g) were obtained from Lassissi fish farming center in Porto-Novo, Benin. They were stocked at a density of 2 fish m–2 (60 fish pond−1) to limit the influence of natural food in pond. The ponds were randomly assigned to 6 triplicate (6 × 3) groups, each set attributed one of the experimental diets. Diets were isonitrogenous (29.2% crude protein) and isoenergetic (16.9 kJ·g−1), formulated using locally available ingredients and the freshwater fern Azolla filiculoides Lamarck. They were formulated to contain 0% (A0), 10% (A10), 20% (A20), 30% (A30), 40% (A40) and 50% (A50) of AM. The Azolla-diets were compared with a control diet (A0) without AM. Formulation and proximate composition of experimental diets are given in Table 1. Experimental diets were prepared according to the procedure described in Abou et al. [6]. After sundrying at 32˚C - 35˚C, the diet was broken into small particles (mm) and preserved in refrigerator (+4˚C) until used for feeding fish.
Fish were fed every day according to Melard [18]. Daily rations were divided into two parts, each hand-

Table 1. Formulation and proximate composition of experimental diets used for feeding Nile tilapia in concrete tanks for 90 days.
distributed at 8:00 h and 16:00 h, respectively. Once every fortnight, fish in stock were sampled with a handling square-net, without entering the pond, and weighed. The daily ration was adjusted according to the actual body weight, and used for the next fortnight.
2.2. Biochemical Analysis
At the beginning of the experiment, thirty fish from the initial batch and six fish per pond at the end were randomly taken and mashed using a Robot coupe food processor. Subsamples were taken and stored at −20˚C for carcass analysis. Whole fish were mashed and whole body crude lipid was determined according to Folch et al. [21].
The diets used were reduced in meal and preserved at −20˚C for biochemical analysis. They were analyzed for dry matter [22], crude protein (Nitrogen × 6.25, Kjeldahl method), crude lipid [21] and crude ash content (incineration for 24 h at 550˚C in a muffle furnace).
Amino acid composition was determined by ionexchange chromatography using a Waters HPLC (Waters, Milford, MA, USA), column AccQ-Tag 3.9 × 150, following hydrolysis of samples with 6 M HCl at 110˚C under an atmosphere of N2 for 18 h. Fatty methyl esters were prepared after transesterification with anhydrous methanol containing 1% sulphuric acid and 0.01% (w/v) butylated hydroxytoluene (BHT) for 16 h at 50˚C [23].
They were separated and quantified by gas chromatography (GC Trace, 2000, Thermo Quest, Carlo Erba, Italy), using a 30 m × 0.32 mm capillary column (FAMEWaxTM, USA).
2.3. Statistical Analysis
Means for growth, proximate composition, and fish body fatty acids were analyzed using one-way Anova, after verifying the homogeneity of their variance [24]. Values for percentage data and ratios were log-transformed prior to analyses. When the effect was significant, comparisons between treatment means was run using Duncan’s multiple range test [25] at P = 0.05. All analysis were done using SPSS program version 17.0 (SPSS, Chicago, Illinois, USA).
3. Results
3.1. Amino Acid of Azolla and Diets, and Fatty Acid Composition of Ingredients and Diets
Essential amino acids (EAA) of Azolla filiculoides and experimental diets are presented in Table 2. Compared to the requirements of tilapias [26], A. filiculoides is poor in methionine. This amino acid is also deficient in diets A30, A40 and A50. The levels of the other EAA in Azolla as in different experimental diets meet the requirements for tilapia [26]. The percentages of fatty acids in A. filiculoides, in the different feedstuffs and in experimental diets are presented in Tables 3 and 4. The most abundant fatty acids found in A. filiculoides were palmitic acid (16:0), oleic acid (18:1n − 9) and LA (18:2n − 6). All experimental diets showed similar percentages for palmitic acid (27.3% - 29.3%), stearic acid 18:0 (10.1% - 12.4%) and oleic acid (16.4 - 20.4%). Percentages of 14:0 (2.22% - 6.92%), 16:1n − 7 (1.95% - 4.42%), 18:3n − 3 (0.96% - 2.40%), 20:5n − 3 (0.61% - 1.52%), 22:5n − 3

Table 2. Essential amino acid (EAA) composition (g/100 g feed) of Azolla filiculoides and experimental diets.
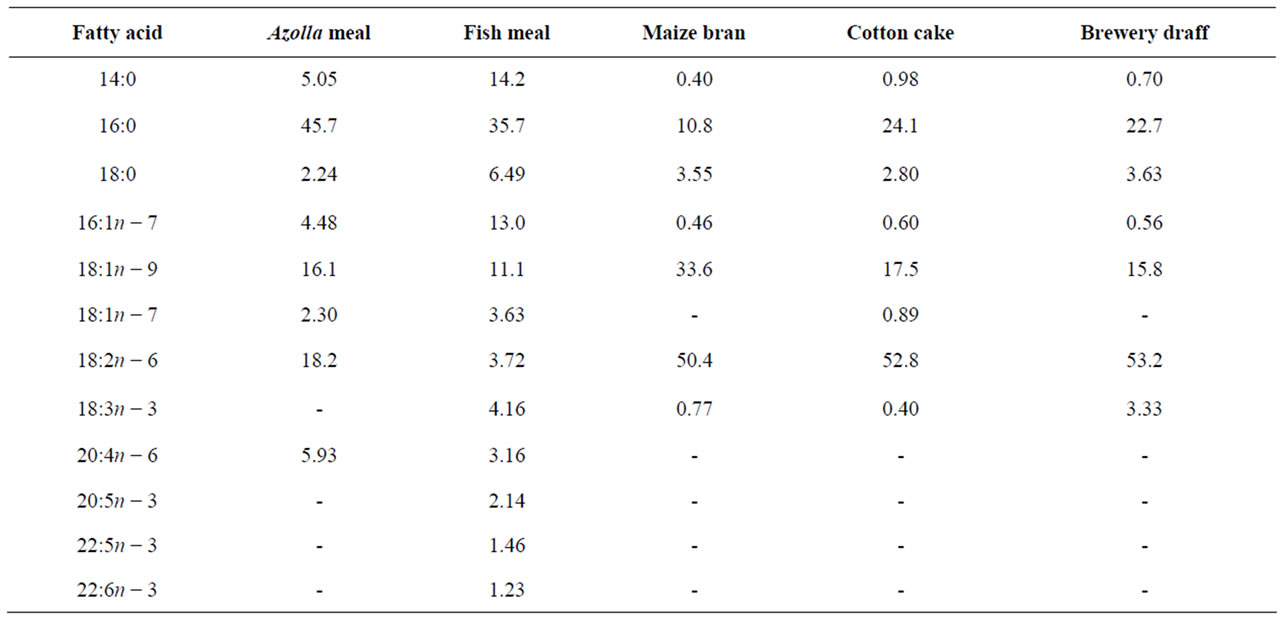
Table 3. Fatty acid composition (% total fatty acids) of Azolla filiculoides and ingredients used in the experimental diets.

Table 4. Percentages of fatty acids (% of total fatty acids) in diets containing gradual level of Azolla fed to Nile tilapia reared in ponds.
(0.15% - 0.61%) and 22:6n − 3 (0.11% - 0.45%) decrease with decreasing FM in diets, whereas LA (18:2n − 6) and ARA (20:4n − 6) levels tend to increase with increasing AM.
3.2. Body Composition and Fatty Acid in Experimental Fish
Data on fish body composition at the beginning and at the end of the experiment are presented in Table 5. Moisture and crude protein were not significantly different among all the experimental diets (P > 0.05). Carcass lipid content was significantly lower at high AM level (A50). Significant variations were found in crude ash (P < 0.05).
Fatty acids in the whole body of experimental fish are presented in Table 6. In general, fatty acids found in high concentration in the diets were also the most abundant in fish. 16:0, 18:1n − 9 and 18:2n − 6 were the most abundant fatty acids in the diets and in fish. Levels of these fatty acids in fish ranged from 26.9% ± 1.1% to 29.1% ± 0.1% for 16:0, 15.0% ± 1.3% to 18.9% ± 0.9% for 18:1n − 9 and 18.2% ± 0.7% to 20.9% ± 1.2% for 18:2n − 6. Myristic acid (14:0) level decreased significantly as AM proportion increased in diets (P < 0.05). The same trend of variation was found for palmitoleic acid (16:1n − 7) and vaccenic acid (18:1n − 7), with values decreasing from 4.49% ± 0.22% to 1.99% ± 0.42% for 16:1n − 7 and from 3.88% ± 0.12% to 2.62% ± 0.73% for 18:1n − 7.
Fish fed A0 to A20 are rich in 14:0, 16:1n − 7, 18:1n − 7, 18:1n − 9 and 18:3n − 3 fatty acids (P < 0.05). Opposite of this group, fish fed A30 to A50 showed higher percentages in 18:0, arachidonic acid (ARA, 20:4n − 6), eicosapentaenoic acid (EPA, 20:5n − 3) and docosahexaenoic acid (DHA, 22:6n − 3). EPA and DHA levels in those last fish showed a markedly higher concentration compared to their level in the diets provided. This leads to a significantly higher concentration of total PUFAs in fish fed AM-diets, mainly in (n − 3) and (n − 6) fatty acids. As a consequence, significant differences were found in the resulting  ratios.
Identical values were obtained in fish fed A20, A30 and A50, which were higher to the values recorded in fish fed A0, A10 and A40 (P < 0.05).
4. Discussion
The results of the present study did not demonstrate any significant difference among fish fed AM-free diet (A0) and those fed either 10% (A10) or 20% (A20) of AM in their diets, in terms of final mean weight and SGR. These trends in growth variation were similar to those reported with other terrestrial and aquatic plants, as substitutes for FM. As in this study, El-Sayed [27], Fasakin et al. [28] and Fasakin et al. [4] reported reduced growth of Nile tilapia when Azolla pinnata R. Brown., Duckweed (Spirodela polyrrhiza L.) and Azolla africana Desv. were used, respectively. According to several studies, factors that limit the use of macrophytes in fish diets are their content of antinutrient factors, or a deficiency in aminoacids and phosphorus. Dato-Cajegas [29] pointed out phosphorus as the major mineral that limits Nile tilapia

Table 5. Growth, feed performance and body composition (% fresh matter basis) of Nile tilapia fed in ponds with diets containing increasing level of Azolla filiculoides for 90 days. Data are mean ± S.D. of three replicates. A0 to A50: diet with 0% to 50% Azolla.


Table 6. Means ± S.D. of fatty acid levels (% of total fatty acids) in the whole body of Nile tilapia O. niloticus fed in ponds with diets containing gradual level of Azolla filiculoides. A0 to A50: diet with 0% to 50% Azolla.
growth in semi-intensive systems. The reported dietary requirement for phosphorus in tilapia varies from 0.90% [30] to 0.46% [31] depending on species, fish size and diet composition. In this study, all the diets used contain sufficient amounts of phosphorus to meet this need. Since A. filiculoides contain no antinutrient factor, the reduction in growth of fish fed diets A30, A40 and A50 could be explain by the lower content of methionine and (n – 3) fatty acids in the fern and thus in high AM-diets, as well as by the low digestibility of crude protein found in A. filiculoides [31,32]. Unfortunately, it seems that these deficiencies are not completely counterbalanced by the inputs from natural food, mainly plankton and invertebrates, through their content in methionine and other amino acids and fatty acids.
Carcass moisture and crude protein in whole fish body were not significantly affected by dietary treatment. Conversely, lipid deposition was affected at high AM level (A50).
Several studies have been reported on the effects of substituting FM with feedstuffs on the carcass composition of fish produced. The trend obtained for moisture and crude protein were in agreement with those reported for Nile tilapia by Patel & Yakupitiyage [33] in ponds and Schneider et al. [34] in aquaria.
The decreasing values of lipid at high AM in diets followed the results of Pouomogne et al. [35] who used cocoa husks, Hossain et al. [36,37] who used Sesbania, and Siddhuraju & Becker [38,39] who used Mucuna seed meal in their diets. The possible explanations for these variations could be the reduction of FM in diet and the lower contribution by plant protein that contained a high amount of non-digestible cuticles [40].
In experimental diets, percentages of myristic acid, stearic acid, palmitoleic acid, vaccenic acid, linolenic acid (LLA), EPA, clupanodonic acid and DHA in diets decreased with decreasing FM, certainly because of the high levels of these fatty acids in FM, compared to AM. Also, the increasing trend of linoleic acid (LA) and ARA levels in experimental diets is probably due to the increase of AM, which contains higher levels of that fatty acid than FM.
Because of the high content of AM in LA and ARA compared to FM, these fatty acids levels increased as AM proportion increased in diets. According to Maina et al. [13] quoting Olsen et al. [41] and Takeuchi et al. [42], tilapia possesses desaturation and elongation enzymes that efficiently convert C18 PUFAs to longer chain PUFAs. In experimental fish, significantly higher levels of ARA were found in fish fed high AM levels, whereas their LA showed significantly lower values. The higher values of ARA and the lower values of LA in fish compared to their levels in diets suggest de novo synthesis of ARA, using LA as precursor. Also, the lower values of LLA in fish compared to their levels in diets corroborated the well established fact that many freshwater fish [43], salmonids [44], rainbow trout [45] and tilapias [13,46] can readily convert LLA to EPA and DHA using metabolic pathways similar to those occurring in higher vertebrates. However, ARA, EPA, clupanodonic acid and DHA levels in all experimental fish were higher than the levels in diets. And these fatty acids values increased in AM-fed fish. According to Maina et al. [13] and Bahurmiz & Ng [46], the fatty acid composition of many fish resembles that of their food. This was also proved in many studies in which FM or fish oil was replaced by non-conventional sources of protein or lipid [15,47-49]. Awaïss et al. [16] found that fatty acid composition in gudgeon and perch reflected that of the rotifer Brachionus calyciflorus Pallas which they were fed. In Ethiopian lakes, the differences in natural food available in several lakes resulted in differences in fatty acid composition of O. niloticus [50].
Moreover, many phytoplankton families [51,52], copepods and rotifers [17,53], and chironomids and oligochaetes [54] are rich sources of LLA, EPA and DHA. It seems that the low levels of the latter fatty acids in AM-diets can be compensated by the consumption of an amount of natural food from the ponds. This contribution of the natural food to fatty acid profile of fish seems to be higher in fish fed high amounts of Azolla in diets. This emphasizes the need to quantify the contribution of natural food organisms to the overall nutritional budget of ponds, especially in those receiving AM. As a conesquence of increase in ARA, EPA, DHA in high AM-fed fish, total PUFAs, (n − 3) and (n − 6) fatty acids, and  values were higher in fish fed high AM levels in ponds.
5. Conclusions
The present study indicated that up to 20% of AM could be incorporated in diets without adverse effects on growth in Nile tilapia, which corresponds approximately to a reduction of 30% of FM protein of the control diet. This study also showed that the incorporation of AM in diets did not affect significantly the fish carcass composition.
Replacing FM with AM in diets for Nile tilapia O. niloticus raised in ponds yields fish with fatty acid profiles suitable for human consumption. As a result of the contribution of natural food available in ponds, the study suggest using AM in pond to produce high quality Nile tilapia with better fatty acid profile for human health.
NOTES