Higher Plasma Potassium Level Reduces 10-Year Cardiovascular Disease Risk Predicted by the Framingham Risk Score among Taxi-Motorbike Drivers Residing and Working in Cotonou, Benin ()
1. Introduction
Cardiovascular diseases (CVD) remain the leading cause of global mortality and disability [1] . In 2019, CVD accounted for 17.9 million deaths (i.e., 32.0% of all deaths) globally [2] , with the majority of deaths now occurring in low- and middle-income countries. Since 1990, there has been an important increase in the number of deaths from CVD in sub-Saharan Africa (i.e., 5.5% of global CVD deaths), with stroke (409,840) being the leading cardiovascular cause of death [3] . A large proportion of this burden is a consequence of the rising prevalence of cardiovascular risk factors such as hypertension, obesity, smoking, dyslipidemia, and type 2 diabetes (T2D) [4] . These five leading risk factors accounted for more than 50% of cardiovascular deaths [5] .
Within populations of Benin, the prevalence of cardiovascular risk factors has risen steadily [6] [7] [8] , and published epidemiological studies over the last decade revealed that the prevalence of stroke ranged between 0.2% and 1.5% [9] . However, the magnitude and trends in CVD incidence and mortality remain largely understudied. Therefore, identifying high-risk features that predict early-onset of CVD is of utmost importance for addressing prevention in early adulthood.
The CVD risk prediction is a cost-effective approach to identify candidate patients (i.e., individuals at high-risk) eligible for preventive treatment. Modifiable and non-modifiable cardiovascular risk factors have been used to create multivariable risk prediction algorithms such as the Framingham Risk Score (FRS) [10] . The FRS algorithm is a useful tool that predicts a 10-year chance of developing CVD. The FRS considers seven cardiovascular risk factors, including sex, age, total cholesterol (TC), high-density lipoprotein cholesterol (HDL-C), blood pressure, smoking habits, and diabetes status [11] .
Importantly, studies that assessed the performance of CVD risk prediction algorithms, including the FRS have predominantly been conducted on populations from high-income countries. Hence, the application of CVD risk prediction tools in African populations has rarely been explored [12] [13] .
Recently, a clustering of traditional and non-traditional cardiovascular risk factors (e.g., hypertension, dyslipidemia, insulin resistance, and hyperuricemia), which induce high cardiovascular risk profiles have been reported in taxi-motorbike drivers (TMDs) working in Cotonou [8] [14] [15] [16] . However, the risk of developing CVD in the next 10 years based on the FRS algorithm has never been explored in populations of Benin, including TMDs.
Given this background, the current study aimed: 1) to estimate the 10-year CVD risk determined by FRS; and 2) to investigate whether plasma iron and potassium levels, within the normal ranges, are independently associated with 10-year CVD risk among TMDs residing and working in Cotonou city.
2. Patients and Methods
2.1. Study Design and Study Participants
The air pollution survey was initially designed to investigate the health consequences of air pollution on exposed populations, including TMDs. The study population consists of apparently healthy TMDs, all men and nonsmokers in whom detailed cardiometabolic markers were assessed. Detailed information on the study population has been described previously [8] .
A total of 147 TMDs were assessed for eligibility, but 13 individuals who lacked demographic, laboratory measurements or had a fasting glucose level > 7.0 mmol/L were excluded. The final statistical analysis included 134 participants patients. Written informed consent was obtained from each participant prior to being enrolled in the study. The study was reviewed and approved by the Benin Environmental Agency. The whole study protocol was conducted in accordance with the Declaration of Helsinki.
2.2. Data Collection and Biochemical Analyses
Tobacco use and exposure duration were self-reported, and information regarding demographics, medical history, and medication use was collected via face-to-face interviews, using a standard questionnaire. Alcohol consumption was classified as “never” and “current” (drinking regularly). Body height and body weight were measured according to standardized guidelines. The body mass index (BMI) was calculated by dividing weight in kilograms by the square of height in meters (kg/m2). Systolic (SBP) and diastolic blood pressure (DBP) measurements were obtained by trained staffs. Blood collection, processing, and laboratory testing have been previously described [8] [14] .
Covariates of interest that included total cholesterol (TC), triglycerides (TG), low-density lipoprotein cholesterol (LDL-C), and high-density lipoprotein cholesterol (HDL-C), liver enzymes such as alanine aminotransferase (ALT), aspartate aminotransferase (AST), and alkaline phosphatase (ALP), creatinine, C-reactive protein (CRP), iron, potassium, uric acid, fasting insulin, and glucose were obtained in each participant, using standardized methods. All biochemical analyses were performed in the research Unit NGERE: “Nutrition-Génétique-Exposition aux risques environnementaux”, Faculté de Médecine, Nancy, France.
2.3. Framingham 10-Year CVD Risk Estimation
The CVD risk was quantified using the Framingham 10-year risk prediction algorithm [11] , which included the following risk factors: sex (male or female), age (20 - 34, 35 - 39, 40 - 44, 45 - 49, 50 - 54, 55 - 59, 60 - 64, 65 - 69, 70 - 74, and 75 - 79 years), SBP (<120, 120 - 129, 130 - 139, 140 - 159, and ≥160 mm Hg), total cholesterol level (<160, 160 - 199, 200 - 239, 240 - 279, and ≥280 mg/dL), HDL-C level (≥60, 50 - 59, 40 - 49, and <40 mg/dL), smoking habits (non-smoker, ex-smoker, and current smoker), and diabetes status. The number of points for each risk factor (i.e., sub-total points) was used to obtain the total points and corresponding 10-year CVD risk score values. Smoking habits and diabetes did not contribute to the total points of FRS because they were exclusion criteria of the study. Estimated 10-year CVD risk scores were categorized into low (<10%), moderate (10% - 20%), and high (>20%). In addition to these pre-defined thresholds, we further classified participants into two groups (i.e., FRS < 2% and FRS > 2%), using risk score > 2% as a cut-off value. This corresponds to the 75th percentile of 10-year CVD risk score in our study population.
2.4. Definition of Variables
Exposure duration was defined as the length of time (years) for which participants had held taxi-motorbike driving job. Alcohol intake was defined as the average consumption of 1 or more alcoholic drinks per day. Insulin resistance (IR) was assessed using the homeostatic model assessment-insulin resistance (HOMA-IR) formula [8] [14] .
2.5. Statistical Analysis
All analyses were performed using IBM SPSS Statistics 20.0 software. Continuous variables are expressed as a mean (standard deviation, SD) or as a median (interquartile range, IQR: 25th-75th). Categorical variables are expressed as percentages. The comparisons between 10-year CVD risk groups were performed using the Student t-test or Mann-Whitney U test for continuous variables, and the chi-square test was used for categorical variables. The associations of plasma iron and potassium levels with 10-year CVD risk were examined using multivariable-adjusted logistic regression models. The 1st tertiles of iron and potassium were set as the reference groups to calculate the odds ratios (ORs) to being above the 75th percentile of predicted 10-year CVD risk with the corresponding 95% confidence intervals (CIs) in the 2nd and 3rd tertiles. All tests were two-sided, and P values < 0.05 were considered statistically significant.
3. Results
3.1. Cardiometabolic Risk Factors and Predicted 10-Year CVD Risk
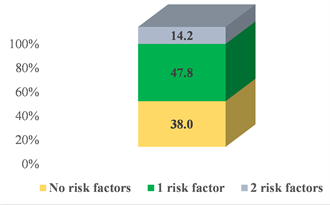
Cardiometabolic characteristics of the whole study cohort are presented in Table 1. Overall, this study included 134 TMDs who were not under lipid-lowering or anti-hypertensive therapies. Their means (SD) of age and BMI were 39.4 (7.8) years and 23.5 (3.9) kg/m2, respectively. Figure 1A depicts the distribution of two conventional cardiovascular risk factors (e.g., high blood pressure and dyslipidemia) that contribute to the FRS algorithm. Sixty-two percent of participants had at least one risk factor. Hypertension and dyslipidemia co-occur in 14.2% of the study participants. The medians (IQR) of plasma iron and potassium were 16.3 (12.8 - 19.9) µmol/L and 4.5 (4.1 - 4.9) mmol/L, respectively.
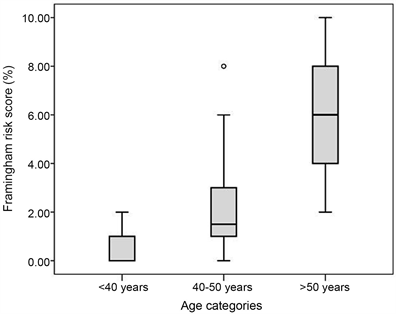
As shown in Table 1, 97.8%, and 2.2% of the study participants were predicted as having low (10-year CVD risk < 10%) and moderate (10-year CVD risk between 10% - 20%) 10-year CVD risk, respectively. The mean (95% CI) of 10-year CVD risk among TMDs was 1.6% (1.2% - 2.0%). The mean (95% CI) of 10-year CVD risk was significantly lower in patients under 50 years, 1.1 (0.8 - 1.4) compared to those above 50 years, 5.6 (4.3 - 7.0), (P = 0.001, Figure 1B). Similarly, the 10-year CVD risk increased with increasing exposure duration (Figure 1C).
A
B
![]() C
C
Figure 1. Prevalence of two conventional cardiovascular risk factors (i.e., hypertension and dyslipidemia) (A) and 10-year CVD risk by age categories (B) and exposure duration (C). Values of zero should be construed as < 1% risk.
![]()
Table 1. Demographic and cardiometabolic factors according to Framingham risk score levels.
Values are presented as means (Standard deviation: SD), median (interquartile range: IQR) or n (%). ALP: alkaline phosphatase, ALT: alanine aminotransferase, AST: aspartate aminotransferase, BMI: body mass index, CRP: C-reactive protein, DBP: diastolic blood pressure, FRS: Framingham risk score, HDL-C: high-density lipoprotein cholesterol, LDL-C: low-density lipoprotein cholesterol, HOMA-IR: homeostatic model assessment-insulin resistance, SBP: systolic blood pressure, TC: total cholesterol, TG: triglycerides. * Values of zero should be construed as <1% risk.
As expected, participants with 10-year CVD risk > 2% were older, had higher SBP, exposure duration, TC, TG, and LDL-C than those with 10-year CVD risk < 2%. Other cardiometabolic factors (BMI, glucose, insulin, ALP, ALT, AST, CRP, uric acid, and HDL-C) did not substantially differ between these two groups (Table 1).
The distribution of 10-year CVD risk according to plasma iron and potassium tertiles are shown in Figure 2. The proportion of participants with 10-year CVD risk > 2% increased with the increase in plasma iron tertiles (Figure 2A). Conversely, the 10-year CVD risk level decreased when plasma potassium levels increased (Figure 2C). Patients with the highest plasma potassium levels are more likely normotensive, while those with high iron levels are more likely hypertensive (Figure 2B and Figure 2D).
3.2. Associations of 10-Year CVD Risk with Plasma Iron and Potassium Levels
Logistic regression models for the relationships of 10-year CVD risk with plasma iron and potassium levels are shown in Table 2. We found any significant associations between 10-year CVD risk and plasma iron levels. The ORs (95% CI) for 10-year CVD risk in the 2nd and 3rd tertiles of plasma iron were 0.76 (0.19 - 2.96) and 2.20 (0.62 - 7.73), respectively. In contrast, our results showed an inverse association between 10-year CVD risk and plasma potassium levels, in a dose-response manner. Plasma potassium levels > 4.8 mmol/L led to an 83% risk reduction of having 10-year CVD risk > 2% (OR = 0.17, 95% CI: 0.04 - 0.82, P = 0.027, Table 2).
![]()
Figure 2. 10-year cardiovascular disease risk and prevalence of hypertension according to plasma iron (A and B) and potassium levels (C and D).
![]()
Table 2. Logistic regression models for the relationships between plasma iron and potassium levels, and 10-year CVD risk.
OR: odd ratio, CI: confidence interval. Model 1 adjusted for fasting glucose, insulin, alcohol, BMI, ALP, ALT, AST, potassium (categorical), CRP, iron (categorical), and exposure duration. Model 2 adjusted for all variables in model 1 plus uric acid and LDL-C.
Our results also showed that exposure duration was independently and positively associated with 10-year CVD (highest vs. lowest tertile: OR = 3.72, 95% CI: 1.18 - 13.1, P = 0.041, Table 2.
4. Discussion
This study estimates the risk of suffering from CVD in the next 10 years predicted by the Framingham risk score among TMDs working in Cotonou. We also examined the relationships of 10-year CVD risk with plasma iron and potassium levels. Our findings indicated that the chance of having CVD in the next 10 years was 1.6% (95% CI: 1.2% - 2.0%) among TMDs. This estimate is lower than previous reports in Sub-Saharan Africa [13] . Wagner et al. analyzed cardiovascular risk factors and subsequent 10-year CVD risk levels in four African countries (South Africa, Kenya, Burkina Faso, and Ghana), applying three prediction algorithms, including Framingham [13] . They reported an overall 10-year CVD risk that ranged from 2.6% to 6.5% (4.9% for Framingham), with estimates being lower in the East and West African sites compared to South Africa [13] . They also found that the 10-year CVD risk was higher in men (3.2% to 7.1%) than in women (2.2% to 3.6%) [13] . Another study that looked into CVD risk prediction between Ghanaian populations in Europe and Ghana also reported higher 10-year CVD risk than estimates in our current study. Their median (25th - 75th) for 10-year CVD risk was 7.3% (3.9 - 13.2) for Framingham versus 5.0% (2.3 - 9.7) for Pooled Cohort Equations [12] . In our study, it is not possible to determine whether the FRS accurately estimates 10-year CVD risk in TMDs, and several factors may contribute to the difference seen in estimates between studies. First, the distribution of cardiovascular risk factors varies across countries. In addition, the Framingham algorithm considers smoking habits and diabetes status, which do not contribute to the total points of FRS because they were exclusion criteria in the current study. Other cardiometabolic risk factors such as hyperuricemia and insulin resistance, which are common in TMDs are not part of the Framingham algorithm. It is worth noting that participants included in this study were slightly younger (age between 22 - 59 years) than in studies by Wagner et al. (40 - 60 years) and Boateng et al. (40 - 70 years) [12] [13] . In our study, the Framingham scores were higher in participants > 50 years compared to those <50 years. This finding suggests that we would have reported comparable estimates if middle-aged and older participants were included. Furthermore, available evidences suggest that the performance of Framingham algorithm varies considerably between populations [17] [18] . A systematic review showed that the Framingham risk prediction has a tendency to over-estimate CVD risk in low-risk populations and under-estimate CVD risk in high-risk populations [18] . Additionally, a study by Marsh showed that both Framingham and QRISK correctly predict less than 70% of cases, with a high ratio of false positive predictions to true predictions [19] . Another study that evaluated the performance of Framingham, Assign, and QRISK2 in predicting high CVD risk on a 1.8 million UK participants showed underestimation of the scores, with the majority of cases occurring in people who had predicted 10-year CVD risk of less than 20% [20] . Other evidences from the literature indicate that estimates of CVD risk algorithms are less accurate in the developing countries and may lead to misclassification bias [13] [21] .
Our study findings revealed that plasma iron was not a predictor of CVD risk in multivariable-adjusted analyses. Previous epidemiological studies that have investigated the associations between iron and CVD risk have yielded conflicting results [22] . Gutierrez-Bedmar et al. reported an inverse association between serum iron and subsequent CVD [23] . However, a recent population-based study by Barywani and co-workers that examined the long-term impact of serum ferritin and serum transferrin (as biomarkers of iron stores) on cardiovascular events found any associations between iron biomarkers and coronary heart disease after 21 years of follow-up [24] . Moreover, increased serum ferritin was associated with increased risk of cardiovascular risk and insulin resistance in patients with family history of T2D [25] .
Another important finding of our study was the inverse association between plasma potassium and 10-year CVD risk. The association between plasma potassium and reduction in the risk of future cardiovascular events was characterized by a threshold effect. Indeed, the 10-year CVD risk did not differ between participants in the 2nd tertile (4.4 - 4.8 mmol/L) and those in the lowest tertile of potassium (OR = 0.56, 95% CI: 0.17 - 1.86). However, this relationship became evident when participants in the highest tertile of potassium were compared with those in the lowest tertile (OR = 0.17, 95% CI: 0.04 - 0.82). These findings may suggest that only high levels of potassium could have significant impact on subsequent cardiovascular events, although longitudinal studies are required to infer a causal relationship. This beneficial effect of higher potassium levels on cardiovascular risk outcomes is in line with increasing evidences from the literature [26] [27] . For instance; Pickering et al. explored the relationships of sodium, potassium, magnesium, and calcium with CVD risk in the Framingham Offspring Study and found an inverse dose-response relationship between potassium intake and CVD risk, which was more pronounced with potassium intake ≥3000 mg/day vs. <2500 mg/day [27] . Adebamowo et al. also demonstrated that high intakes of potassium were also significantly associated with reduced risk of stroke in women [26] . However, a prospective study that followed up 3151 patients for 16 years found no significant association between serum potassium levels and either CVD risk or cardiovascular disease-related deaths [28] .
The molecular mechanisms by which potassium levels may affect future cardiovascular events are not fully elucidated. However, high potassium levels have been shown to suppress oxidative stress in vascular endothelial cells, vascular resistance, platelet aggregation, and arterial thrombosis [29] . Elevated plasma potassium has positive effects on endothelial cells, enhances the release nitric oxide, which promotes vasodilation [30] .
In a previous study, we have shown that higher plasma potassium levels had beneficial effect on lipid profiles [15] . Here, we further demonstrated that such high potassium levels associate with decreased 10-year CVD risk. Taken together, these findings suggest that consumption of foods with high content of potassium should be encouraged in TMDs as well as other populations. Such a strategy may help prevent CVD. Given that antihypertensive drugs such as diuretics increased the risk of hypokalemia [31] , and subsequent chronic disorders (e.g., ventricular arrhythmias [32] ), physicians should pay attention to patients with low potassium levels, in particular those with existing cardiovascular risk factors. Multiple factors are causally related to CVD, and an individual's CVD risk should be used in conjunction with other clinical assessments to determine the best course of action for each individual.
Limitations of this study include the small sample size and its cross-sectional nature. The associations observed between 10-year CVD risk and plasma potassium levels may have been stronger if the corresponding cardiovascular outcomes were assessed in the studied population. A further limitation is that our estimates of 10-year CVD risk may have been influenced by Framingham risk equation, which was developed in Caucasians. Additionally, this study included only male patients and we were unable to evaluate the gender effect on the link between 10-year CVD risk, plasma iron and potassium. This should be the subject of future investigations.
Despite its limitations, this study also has strengths. To our knowledge, this is the first study to estimate 10-year CVD risk and its relationships with plasma iron and potassium levels in Beninese people. Thus, the study findings provide evidence-based for future larger studies.
5. Conclusion
Our study demonstrates that higher plasma potassium levels associate with reduced 10-year CVD risk among TMDs working in Cotonou. As such, monitoring of plasma potassium, particularly in those with existing cardiovascular risk factors, may help prevent CVD. However, larger studies with different designs are required to substantiate our findings, and to determine the performances of different CVD risk prediction algorithms and validation against CVD outcomes to inform which algorithms best predict CVD within populations of Benin.
Acknowledgements
We thank all taxi-motorbike drivers whose cooperation made this study possible. We also express our gratitude to Professors Rosa-Maria Guéant-Rodriguez and Jean-Louis Guéant for their invaluable support in sample collection and biochemical analyses. The Ministry of Higher Education and Scientific Research in Benin partially covered costs related to sample collection.
Authors’ Contribution
PHA and AS conceptualized the study and contributed to data acquisition. AS provided administrative, technical, or material support. PHA performed laboratory work, analyzed data, and wrote the manuscript. Both authors read and approved the final manuscript to be published.