Analysis of the Export Competitiveness of Thai Cassava in the Chinese Market (2010-2020) ()
1. Introduction
Thailand is located in South-Eastern Asia, bordering the Andaman Sea and the Gulf of Thailand. The country mainly exports manufactured goods, electronics, vehicles, machinery, equipment, foodstuff, agricultural goods; mainly rice, cassava, rubber, etc. Major export partners are China, Japan, the United States, and the European Union (International Trade Centre, 2021).
The economy of Thailand is dependent on exports, which accounted in 2019 for about 60 percent of the country’s gross domestic product (GDP). Thailand is a newly industrialized country, with a GDP of 16.316 trillion baht (505 billion USD) in 2018, the 8th largest economy of Asia, according to the World Bank. As of 2018, Thailand has average inflation of 1.06 percent and an account surplus of 7.5 percent of the country’s GDP. The Thai economy was expected to post 3.8 percent growth in 2019. Its currency, the Thai Baht, ranked as the tenth most frequently used world payment currency in 2017. The industrial and service sectors are the main sectors in the Thai gross domestic product, with the former accounting for 39.2 percent of GDP. Thailand’s agricultural sector produces 8.4 percent of GDP—lower than the trade and logistics and communication sectors, which account for 13.4 percent and 9.8 percent of GDP, respectively. The construction and mining sector adds 4.3 percent to the country’s gross domestic product. Other service sectors (including the financial, education, hotel, and restaurant sectors) account for 24.9 percent of the country’s GDP. Telecommunications and trade in services are emerging as centers of industrial expansion and economic competitiveness. The major export products of Thailand are industrial products and agricultural products. Most of the Thai population are framer. Thailand has many types of agricultural products and food production for exports around the world. Someone called Thailand the “Kitchen of the World” (Office of Agricultural Economics by the Cooperation of the Customs Department, 2020).
Thailand is the second-largest economy in ASEAN after Indonesia, an up-per-middle-income country with an open economy, a gross domestic product (GDP) of 503.5 billion USD, and a negative 6.1 percent annual growth in 2020. China has replaced the United States as Thailand’s largest export market while the latter still holds its position as its second-largest supplier (after Japan). While Thailand’s traditional major markets have been North America, Japan, and Europe, economic recovery in Thailand’s regional trading partners has helped Thai export growth.
Thailand and China have a long relationship and trade for a long time. In the present have developed various forms of economic cooperation, especially The China-Thailand Free Trade Agreement (FTA) was signed in June 2003 and took effect four months later, in October 2003. It is a “farm trade early harvest agreement.” Both nations opened their agricultural markets before the bigger China-ASEAN. FTA took effect in 2010 and tariffs on 188 different fruits and vegetables were reduced to zero overnight as part of the agreement. The China-Thailand Free Trade Agreement has been harmful to small farmers on both sides of the border (Mahanakorn Partner Group, 2021).
Cassava is the most important tropical root crop. Its starchy roots are a major source of dietary energy for more than 500 million people. It is known to be the highest producer of carbohydrates among staple crops (Kasikorn Research Center, 2020). According to the United Nations Food and Agriculture Organization (FAO), cassava ranks fourth as a food crop in developing countries, after rice, maize, and wheat. The leaves are relatively rich in protein and can be consumed. Cassava can be stored in the ground for several seasons, thereby serving as a reserve food when other crops fail. Cassava is also increasingly used as an animal feed and in the manufacture of different industrial products. It is used in industrial processes (The Agricultural Research Council, 2021).
Thailand is the biggest exporter of cassava products in the world, the market share is 79.56 percent in the world cassava trade; the next are Vietnam, Indonesia the market shares are 9.73 percent and 2.42 percent. In 2019, Thailand exported 694,815,264 USD in Cassava, making it the 1st largest exporter of Cassava in the world. In the same year, Cassava was the 91st most exported product in Thailand (Economic Base, 2016).
China is the biggest importer of cassava trade from Thailand. China imports cassava chips to produce ethanol, import cassava starch to produce modified starch used in the papermaking and textile industry. The price of cassava for export has been depressed by news of China reducing its Thai imports, following the Chinese government policy to subsidize maize. As a result, Chinese manufacturers that produce alcohol from cassava have switched to corn. The cassava starch production in China is seasonal; the wastewater management is difficult for environmental protection (The Observatory of Economic Complexity, 2021a).
In 2020, China imported 1,130,654,797 USD in Cassava, becoming the 1st largest importer of Cassava in the world. In the same year, Cassava was the 281st most imported product in China. In 2020, China imports Cassava primarily from: Thailand 708,295,917 USD, Vietnam 388,761,057 USD, Laos 6,779,450 USD, Cambodia 12,883,185 USD, and Indonesia 13,905,498 USD. Since 2012, China’s importation of cassava has grown (The Observatory of Economic Complexity, 2021b). Figure 1 presents the top 5 cassava producing countries of China, average imported during 2010-2020.
![]()
Figure 1. The top 5 cassava producing countries of China, average imported during 2010-2020. (Units = U.S. Dollar). Source: United Nation Statistics Division.
China imported cassava products from Thailand between 2010 and 2020 have increased in value and export volume. But in 2014-2017, the value of cassava import declined from 700,120,546 USD to 531,222,840 USD. Because Thailand had a problem with natural disasters and the high cost of cassava raw material. After that, the value increases to 708,295,917 USD until the year 2020. In 2010, China imported cassava products from other countries. Since 2011, China has the highest volume of imported cassava products from Thailand. Vietnam is the second cassava product export to China from in the year 2011, 137,795,395 USD. Then the value of imports cassava from Vietnam to China was increase to 388,761,057 USD in 2020. Following by Cambodia, Lao, Indonesia, and other countries until the year 2020, at 12,883,185 USD, 6,779,450 USD, 13,905,498 USD, respectively (The Observatory of Economic Complexity, 2021b).
1.1. Research Objectives
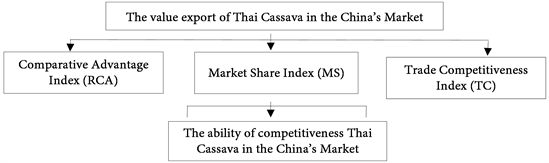
To study the ability of competitiveness Thai Cassava in China including; the potential of Thai cassava exports, market share of Thai cassava, the competitiveness of Thai cassava trade which using the Revealed Comparative Advantage (RCA) Index, the market share (MS) Index, Trade Competitiveness Index (TC) of Thai’s cassava exports in the Chinese market by comparison with the export competitor country: Vietnam, Cambodia, Lao, Indonesia.
1.2. Research Conceptual Framework
2. Literature Review
Akarapong & Ariya (2010) study the competitiveness of Thai agricultural products in the Chinese market. Thailand has the opportunity to benefit from Chinese economic growth. The agricultural products used in this study; rice, cassava, sugar, para rubber, and fruit, considering their competitive and market share. Use export trade ratio index, RCA value, Dynamic RCA value, and competitiveness from the CMS model. The results of this study; Thai’s market share decreased of Thai rice products but other products; cassava, sugar, natural rubber, vulcanized rubber, tapioca starch, fruit, rice products increased. Thai rice faces competition with Chinese rice and rice blending problems. The contraction of the Chinese sugar market has increased the production of sugarcane and the production of Thai entrepreneurs exported to China. Thai natural rubber-faced a change in the import structure of smoked sheet rubber to block rubber. While Thai compound rubber products still have profit from an expansion to the Chinese market, Thai vulcanized rubber products reduced competitiveness past 2 - 3 years.
Piyaporn Changsan (2016) studied the relationship between internal and external factors affecting the export of cassava products to the People’s Republic of China. The objective of this study was the relationship between Internal and external factors affecting the export of cassava products to China and the influence of internal and external factors affecting the forecast of Thailand’s cassava exports to China; collects primary and secondary data from 2006 to 2015. Used data analyzed in the complex regression equations (Multiple Linear Regression) in Ordinary Least Square (OLS). The results of this; the relationship of internal and external factors affecting the export of cassava products to China was 91.81%. The most influential factor was the foreign exchange rate. If the foreign exchange rate in US dollars increases, it will affect the selling price in Thai baht to depreciate, which will increase the value of cassava exports of Thailand to China by 1649.839 tons. The second factor affecting the export value was the quantity of cassava production in Thailand, the gross domestic product of the People’s Republic of China, and the cassava products exported from Vietnam to China.
Pakjira Taweekan (2019) studied the Analysis of Thai Sugar Export Competitiveness in the ASEAN Market. Thailand has continuously increased Revealed Comparative Advantage (RCA) index for sugar exports to the ASEAN market. The comparative advantage index is 35.37 in 2016, increasing to 77.29 in 2018 and having an average of 77.29. Brazil has consistently reduced the Revealed Comparative Advantage (RCA) index, the comparative advantage index was 2.44 in 2016 and reduced to 1.66 in 2018, an average of three years equal to 2.01. While in terms of Market Share (MS), it is found that Thailand has continuously increased its sugar market share in ASEAN and is at a very high level for the whole 3 years, which is equal to 45.39 in 2016 and increased to 62.50 in 2018, an average of three years equal to 55.85. Brazil is likely to continue to decline, which is equal to 11.50 in 2016 and is reduced to 10.20 in 2018, an average of three years equal to 10.20. In addition, it was found that Trade Competitiveness (TC) has the same trend as Revealed Comparative Advantage (RCA) index and Market Share (MS). Thailand tends to increase continuously, namely in 2016, Thailand has Trade Competitiveness (TC) equal to 0.70 and increased to 0.85 in 2018, an average of three years equal to 0.78. Brazil is likely to continue to decline, which is equal to 0.55 in 2016 and down to 0.29 in 2018, an average of three years equal to 0.39.
3. Methodology
3.1. Collecting the Data
The data used in this study include:
1) Secondary data: the data is based on cassava export value and trade situation of cassava and the key competitors in Thailand, Vietnam, Cambodia, Laos, Indonesia, in the Chinese market.
2) Statistical data: trade statistics and also the specific statistical data in cassava export.
Both secondary and statistical data are collected between 2010 and 2020 for 11 years from the government and private department, International Trade Center, The United Nations Bank and Agriculture Organization (FAO), Ministry of Commerce Office of Agricultural Economics, Department of International Trade Negotiation Tapioca Trade Association, Information Center for Thai Business in China, Office of International Trade Promotion, World Bank, Articles, Academic Papers, and Various research, etc.
3.2. Data Analysis
This study using Comparative Advantage Index (RCA), Market Share Index (MS), and Trade Competitiveness Index (TC) of cassava exports with Thailand, Vietnam, Cambodia, Lao, Indonesia is a descriptive analysis. Secondary statistical data was analyzed using RCA Index to compare cassava export competitiveness, MS to compare cassava market share, and TC to the position of the country tends to be an exporter or importer country, during 2010-2020.
3.2.1. Revealed Comparative Advantage (RCA)
RCA analysis of the competitiveness of cassava exports to the Chinese market. This analysis was a descriptive analysis of the statistical data on the export value by using RCA. The export of cassava data was collected between 2010 and 2020. Cassava products of Thailand compared with a competitor by using Balassa’s apparent comparative advantage theory (Balassa, 1965). This indicator is calculated as:
(1)
RCAijk = Revealed comparative advantage of export cassava product from country i to country j
Xijk = Export Value of cassava product from country i to country j (USD)
Xij = Total export value from country i to country j (USD)
Xwjk = The world export value of cassava product to country j (USD)
Xwj = Total world export value to country j (USD)
k = Cassava product
j = China country
In Equation (1), If RCA > 1, country i is in the position comparative advantage in exporting k products. If RCA < 1, country i is in the position at a comparative disadvantage in exporting k products. If RCA = 1, then country i is that is not advantageous and u disadvantage in exporting k product.
3.2.2. Market Share (MS)
MS shows the ratio of certain products’ exports from a country or region to the international exports of that product. The MS index is straight reflected product competitiveness, and objectively reflects a country or region’s share in the international market (Hitcher & Olin cited in Williamson & Milner, 1999). This indicator is calculated as:
(2)
MSIkin = Market Share index of cassava product from i country to n market
Xkin = Total export volume of country i category j products to the Chinese market
Xkn = Total export volume of category j products exported to the Chinese market
n = The Chinese market/country
3.2.3. Trade Competitiveness (TC)
TC is determined by dividing net exports by total trade. The net export is calculated by the difference between the total amount of exports and imports. It usually explains the status of a country’s foreign trade balance and is the core indicator reflecting the role of foreign trade in the domestic economy (Hitcher & Olin cited in Williamson & Milner, 1999). This indicator is calculated as:
(3)
TCij = The competitiveness of cassava in i country
Xij = Export value cassava ini country (USD)
Mij = Import value of cassava in i country (USD)
In Equation (3), if the value is positive, above 0 to 1, then the country tends to be an exporting country for cassava. But if the value is negative, below 0 to −1, then the country tends to be an importing country for cassava. TCij shows the trade competitiveness index of cassava in country i. The TC index ranges from −1 to 1. When 0.8 < TC ≤ 1, the cassava has an outstanding competitive advantage. When 0.5 < TC ≤ 0.8, the cassava has a higher competitive advantage. When 0 < TC ≤ 0.5, the cassava has no significant competitive advantage. The closer the index is to −1, the more competitive the cassava is, the closer the index is to 1, the stronger the international competitiveness of the cassava is. The closer the index is to 0, the closer the level of competitiveness is to average.
4. Results and Discussion
4.1. The Results of the Revealed Comparative Advantage Analysis (RCA) Index
The RCA value in Table 1, shows the competitiveness of Thai cassava compared to other cassava-producing countries; Vietnam, Cambodia, Indonesia, Lao to the Chinese market; the year 2010-2020. The results of the average RCA index value of cassava of the five largest exporting countries to China show that the five countries only one does not have a comparative advantage because an average RCA value below 1, namely Indonesia. But other countries; Thailand, Vietnam, Cambodia, Lao have a comparative advantage with an average RCA value above 1.
Based on Table 1, the average value of the RCA index of Thai cassava is 31.8046. This makes Thailand in the first position. Thailand has the strongest comparative advantage and competitiveness compared to other cassava product countries. Vietnam is in the second position with an average RCA index value of 18.4350 and Vietnam export cassava is also a strong comparative.
Cambodia, Laos, and Indonesia have the average RCA index value of 15.0994 (strong comparative), 1.3730 (relatively strong comparative), 0.0756 (low comparative), respectively. During 2010-2020, Thailand consistently has the highest RCA value in every year except 2010-2012 when compared to Vietnam. Because after 2012 Thai government used policy to decrease Tax on cassava products and Free trade agreement about export/imports between Thailand and China. Indonesia is low comparative because of an average RCA index value of 0.0756. It can
![]()
Table 1. The RCA index of cassava product exporting from five countries between 2010 and 2020 to the Chinese market.
Source: Authors Research.
be seen that Thailand has the highest export market share compared to other countries, as follows: Table 2, The Market Share (MS) of cassava exports from the five largest producing and exporting countries to the Chinese market (2010-2020).
4.2. The Results of Market Share (MS) Index
The MS value in Table 2, shows the Market Share of Thai cassava compared to other cassava-producing countries; Vietnam, Cambodia, Indonesia, Lao in the Chinese market; during 2010-2020. And Table 3, presents the average of cassava product exports from the five largest exporting countries in the Chinese Market 2010-2020. The results of the average MS index of the five largest exporting countries to China show that Thailand has ranked number one export market share of cassava in total exports average value of 69.2702. And the highest exporting country in the Chinese market with an average export value of cassava
![]()
Table 2. The Market Share (MS) of cassava exports from the five largest producing and exporting countries to the Chinese market (2010-2020).
Source: Authors Research.
![]()
Table 3. The average of cassava product exports from the five largest exporting countries in the Chinese Market (2010-2020).
Source: United Nation Statistics Division (2021).
product of 541,389,411 USD from 2010 to 2020. The difference between the average RCA index value of −13.3696 with Vietnam. The second position is Vietnam, average market share of cassava export of 24.5058 and an average export value of cassava product of 188,320,336 USD. Cambodia and Laos with an average market share of cassava exports in total exports with a value of 1.0286, 0.1359 with an average export value of cassava of 5,824,471 USD, 1,726,881 USD, respectively. The difference in the average value of Cambodia with Thailand is −16.7052, in the fifth position, namely Indonesia with the average value of Indonesia’s cassava exports of 1,270,553 USD, and average market share of cassava export of 0.1128, the difference between the average RCA value of Indonesia and Thailand is −31.7290. As explained previously, although the average total export value of cassava in Indonesia is higher in Lao. It does not affect the RCA value of Indonesia because a high RCA value cannot be shown by a high commodity export value as well.
4.3. The Results of Trade Competitiveness Index (TC) Index
The average TC value for Thai cassava export from 2010 to 2020 is 0.9983. The average TC value of Thai cassava export; when compared to the four other producing and exporting countries to the Chinese market, Thailand is the highest export cassava value. Vietnam has an average TC Index, 0.9647 less than Cambodia’s, 0.9928. Lao with an average TC Index of 0.9211, and the last position is Indonesia with an average TC Index of 0.0731. Table 4, describes the trade Competitiveness index to the five largest countries in the Chinese market.
The TC value in Table 4, shows the Trade Competitiveness Index of Thai cassava compared to other cassava producing countries; Vietnam, Cambodia, Indonesia, Lao between 2010-2020 to the Chinese market. The results of the
![]()
Table 4. The Trade Competitiveness Index (TC) of cassava exports from the five largest countries to the Chinese market (2010-2020).
Source: Authors Research.
average TC index are 541,389,411 USD higher than Vietnam’s 188,320,336 USD, with an average TC value of 0.9983 and 0.9647, respectively. Cambodia is a higher TC value than Vietnam; the trade of cassava export to the Chinese market of 5,824,471 USD, with a TC value of 0.9928. Lao was in the flour position with an average TC value of 0.9211 and experienced trade of cassava of 1,726,881 USD. Looking at the TC values of four countries, Thailand, Vietnam, Cambodia, and Laos which are around 0.80 to 1.00, it indicates that these four producing countries are entering the outstanding competitive advantage which means that these four countries have strong competitiveness in the Chinese market. Lastly, in the fifth position is Indonesia has an average TC value of 0.0731 and has an average export value of cassava of 1,270,553 USD. This stage means Indonesia has no significant competitive advantage exports in the Chinese market because the TC index is from 0.00 to 0.50. The closer the index is to 0, the closer the level of competitiveness is to average.
5. Conclusion
This study of the Revealed Comparative Advantage (RCA) Index, Market Share (MS) Index, and Trade Competitiveness (TC) Index of Thai cassava exports to the Chinese market using by comparing with five countries export cassava products to the Chinese market. Those five countries have high import cassava products in the Chinese market. The results of the TC Index: Thailand has the highest TC index and in rate between 0.80 and 1.00. The RCA Index from this study shows that Thai cassava has a strong comparative advantage and competitiveness with an average value of RCA > 1; cassava products have an average RCA value of 31.8046. Vietnam is in the second position: RCA value of 18.4350. Cambodia, Laos, and Indonesia have an average RCA value of 15.0994, 1.3730, 0.0756, respectively. The results of MS Index: Thailand has the highest Market Share between 2010 and 2020.
Thailand has the highest RCA, MS, and TC index from 2010 to 2020. During those periods Thai government used policy to decrease export/import duty on cassava products and the AFTA cooperation agreement between China and Thailand (Department of International Trade Negotiations, 2021). But other countries have a problem with the logistic sector to China and high Tax export/import value. Thailand has strong export cassava products to the Chinese market but domestic demand in Thailand is increasing. Recently, the value of export cassava from Vietnam to China is increasing because foreign investors are increasing investment in Vietnam because of the low labor cost of production, and the fast-growing economy of Vietnam in ASEAN (Information and Communication Technology Center, Office of the Permanent Secretary, Ministry of Commerce in Cooperation with the Customs Department, 2021).
Suggestions and Recommendation
● Thailand should use technology in the leader of cassava products export by transferring technology and innovations to farmers and factories. It can increase production efficiency and reduce production costs. The development of environment-friendly production processes for increased values added to Thai cassava products.
● Thailand, Vietnam, and some ASEAN countries are exporters of cassava products. Both countries should cooperate in various fields such as price and tax to increase the bargaining power of cassava exports to the Chinese market.
● Thailand should develop industries sectors in cassava production to increase the opportunity and value-added; such as biofuel production, bioplastic cosmetics, chemicals, etc. Thailand should focus on values added to cassava product export because of high income.
● Thai government and the Chinese government should promote and cooperate in the development of transport routes logistics to be modern; such as convenient, fast, etc. for increasing the potential of international trade between Thailand and China.