Open Journal of Social Sciences
Vol.07 No.03(2019), Article ID:91080,11 pages
10.4236/jss.2019.73019
Sport Skill Evaluation with Wearable Sensors and Statistical Analysis
Kazunari Ishida
Faculty of Applied Information Science, Hiroshima Institute of Technology, Saeki, Hiroshima, Japan


Received: January 12, 2019; Accepted: March 10, 2019; Published: March 13, 2019
ABSTRACT
This research discusses sport skill evaluation with wearable sensor and statistical analysis. Skateboarding is selected as the target sport to analyze because it will be an official competition in Tokyo 2020 Olympic Games. Skateboarding is one of the difficult sports because of controlling balance to move forward and to get speed on flat ground. The balance control is a basic trick named Tic-Tac, while the trick is difficult for beginners. To make data set for analyzing Tic-Tac skill, we have provided a basic lesson to research participants. After giving them enough self-training time, we put two inertial sensors on a skateboard and waist of a research participant and got total 41 running data with Tic-Tac. According to the result of statistical analysis on the data, we confirmed that swinging a skateboard left and right is the most important motion to generate moving forward driving forth. This result means that inertial sensors are one of the effective tools to evaluate sport skill for sports science and physical education.
Keywords:
Sport Skill, Wearable Sensor, Skateboarding, Tic-Tac, Sports Science, Physical Education, Olympic Games

1. Introduction
This paper proposes an evaluation method of sport skill with wearable inertial sensors and statistical analysis. Skateboarding is one of the attractive sports for young generation and then the competition will be official events in 2020 Tokyo summer Olympic Games. To lean action sports skill, there is few scientific training methodology, although, video sharing services, e.g. YouTube and Youku, are effective tools to share skill and knowledge visually. To tackle the lack of scientific training methodology for action sports training, we have already developed a wearable sensors system. To analyze action sequence of multiple body parts of athlete, we synchronize multiple time series data with precise GPS time stamp. Based on the precise action sequence of movements of athlete’s body and sporting goods, we can identify important factors for successful action sports trick [1].
In recent years, many researchers have employed smartphones with micro electro-mechanical systems (MEMS) to collect and analyze this type of human behavior. Due to the widespread use of smartphones in our daily lives, we can use them to record human activities. Ueda et al. [2] used smartphones to collect movement data of human bodies at desks and estimated the status of test subjects as either concentrated on a task or relaxed without any task. However, we need purpose-specific devices to collect sensor data for healthcare and sports applications. Morita et al. [3] developed a measurement device based on a three-axis accelerometer, three-axis gyroscope, and three-axis digital compass coupled with a Bluetooth modem to record body activity. Avci et al. [4] surveyed a wide range of research papers concerning inertial sensing to analyze actions concerning healthcare and sports. Concerning action sports, Harding et al. [5] used an accelerometer and gyroscope to analyze the variance in the aerial dynamics of snowboarding. Crockett & Jensen [6] attached a motion capture system to a large motor-driven treadmill to analyze the running dynamics of skateboarding. Ishida [7] [8] analyzed running and aerial dynamics of skateboard, inline skate, and BMX on halfpipe and big air ramp. Ishida [1] also analyzed flat ground skateboard tricks, i.e. Ollie, Shove-it, and Kickflip. In this paper, we will focus on the most fundamental trick to go forward with a skateboard, i.e. Tic-Tac, instead of advanced tricks analyzed on previous researches [1] [7] [8].
2. Wearable Sensor System
Due to the wide range of movements in action sports, it is difficult to capture complete actions with a motion capture system, which deploys several high-speed cameras at fixed places. On the other hand, due to the small footprint and light weight of MEMS, it is easy to put inertial sensors on parts of a human body to record all the motion data of action sports in terms of acceleration and angular velocity. A smartphone is an available device that contains various types of sensors. However, in order to get synchronized data sets from multiple devices, we needed precise time stamps on the data collected from each device. In addition, due to the aggressive motions of action sports, the wearable device had to be impact resistant. Due to these very specific needs, we developed our own recording device.
2.1. Hardware
The developed motion recording device is composed of a microcomputer (Arduino), accelerometer and gyroscope (MPU6050), digital compass (HMC5883L), and GPS (MTK3339). The motion and location data is stored on a micro SD-card. The device’s sampling rate is approximately 50 Hz. The data contains a precise time stamp and position from the GPS on each record at each sampling time. The record also contains sensing data from the three-axis accelerometer, three-axis gyroscope, and three-axis digital compass.
2.2. Software
The recording data is processed by pre-processing software. The software converts date and time into timestamp in the data. It also synchronizes and normalizes the timestamp on the data collected from multiple devices on the head, waist, right foot, and left foot. After normalization, it detects the time series of each action automatically.
1) Converting time stamp: A time stamp recorded by GPS consists of hours, minutes, and seconds. The software converts hours and minutes in clock time into seconds to prepare data for time series analysis. Moreover, the time stamps occasionally are broken due to poor satellite reception by the GPS. The software removes those broken records in the data.
2) Adjusting time stamp: Due to the low frequency of GPS update, which is 10 Hz, multiple records in the data have the same time stamp, because the sampling rate of the accelerometer, gyroscope, and digital compass is approximately 50 Hz faster than that of the GPS. In order to reassign an appropriate, unique, and sequential time stamp to each record, we employed linear interpolation.
3) Synchronization of multiple time series: In order to synchronize multiple time series, all time stamps collected from all time sequences were sorted and reassigned to the sequences. The value of the added time stamp in a time sequence was as-signed the same value as the nearest early time stamp in the sequence.
4) Normalization of time step: In order to analyze time series data with statistical method, all time steps in the data had to have the same duration. To avoid deterioration of time sequences with sampling rate at 50Hz, we normalized the sequences to a 10-millisecond duration. Lack of value on a time stamp in a time sequence was filled by the value of the nearest earlier time stamp.
5) Detection of actions: All actions were detected and extracted from the time sequence. Recorded time sequences tended to result in data of long duration. Hence, the manual detection and extraction could be quite a time-consuming task. We did automatic detection and extraction of all actions based on no motion durations in sensor value. Each action data set was written to a separate file.
3. Experiment, Sensor Data, and Statistics
We have recorded motions of research participants’ upper and lower bodies on Tic-Tac runs. To gather inertial sensor data for analyzing Tic-Tac skill, we have provided a basic lesson to research participants and gave enough self-training time. We put two inertial sensors on a skateboard and waist of a research participant and got total 41 running data with Tic-Tac. The running distance is 8 meters. The fastest and latest times are 7 and 90 seconds, respectively.
3.1. Basic Motion to Move Forward
A skateboard does not have any direct mechanism to move forward. Hence a skateboarder has to do Tic-Tac, which is a basic trick to move forward on a skateboard. A skateboarder has to select his or her stance to do Tic-Tac. Before trying to do Tic-Tac, a skateboarder has to learn clockwise and counter clockwise turns, respectively. These turns lead to yaw rotations of skateboard (Figure 1). When the skateboarder turns his or her skateboard, he or she has to stand on two back wheels of skateboard with his or her back foot to float two front wheels. The floating motion leads to pitch rotation of skateboard.
Tic-Tac motion is composed of alternate rotations of clockwise and counter clockwise (Figure 2). Because of difficulty of Tic-Tac motion, some of the beginners tend to swing their bodies on X axis forward and backward to make driving force of skateboard. Unfortunately, they are going to stay same location, because the swing motion cannot generate sufficient force. Tic-Tac or alternate rotations of skateboard is right way to go ahead with a skateboard. Figure 3 shows examples of accelerometers and gyroscopes on skateboard. We can observe alternate rotations on the sensors data. To identify effective motions to generate driving force, we will discuss relation between running time and each sensor data in 3.2.
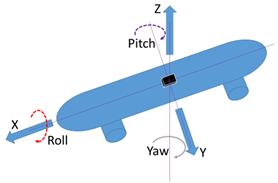
Figure 1. Accelerometer and gyroscope on skateboard.

Figure 2. Tic-Tac motion.
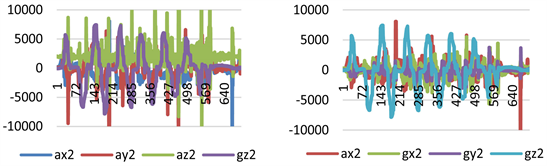
Figure 3. Sensor data on skateboard. (a) Accelerometers; (b) Gyroscope.
3.2. Average and Standard Deviation of Time Series Data
To apply statistical method to analyze time series data of skateboarding, averages and standard deviations are derived from time series data with an inertial sensor. The sensor is composed of three axis accelerometer and three axis gyroscope. Two sensors are attached on waist and skateboard, respectively. These sensors measure upper and lower body motions. The sensor on upper body generates three dimensional acceleration data, i.e. ax1, ay1, and az1, and three dimensional gyroscope data, i.e. gx1, gy1, and gz1. The average and standard deviation have certain prefixes, i.e. a_ and s_. For example, a_ax1 and s_ax1 are average and standard deviation concerning x-axis accelerometer on body. There are 24 variables derived from the two sensors on upper and lower body. To apply linear regression analysis with the 24 independent variables, time duration of each running data, which is the dependent variable, is converted to base-10 logarithm. In this paper, four categories concerning statistical significance are defined such as low * (p ≤ 0.1), medium ** (p ≤ 0.05), high *** (p ≤ 0.01), and extreme **** (p ≤ 0.001).
To estimate effect of upper and lower body motions on running time, the multiple regression function is estimated with the base-10 logarithmic running time and the 24 independent variables with two sensors, and then the adjusted R2 is 0.876. Two independent variables have high or slightly statistical significance, i.e. s_gz2*** and a_gx1*. The correlation between the actual and predicted running time is 0.973. According to the result, the model is reliable and swing motion of lower body or skateboard (s_gz2) is important for getting fast running speed.
To estimate effect of upper body motion, the multiple regression function is estimated with the base-10 logarithmic running time and the 12 independent variables on a skateboard sensor are employed in a regression formula, and then the adjusted R2 is 0.555. Five variables have high statistical significance, i.e. a_ax1***, s_ax1**, s_ay1**, a_az1****, and a_gy1***. The correlation between the actual and predicted running time is 0.823. On the other hand, to estimate effect of lower body motion, the 12 independent variables on skateboard are employed in a regression formula, and then the adjusted R2 is 0.887. A variable has high statistical significance, i.e. s_gz2****. The correlation between the actual and predicted running time is 0.960. According to the results of two cases, skateboard motion is more important than upper body motion to predict running speed.
Effect of each independent variable on the running speed is also analyzed with simple linear regression analysis. Table 1 summaries the results concerning 12 independent variables on lower body. The other 12 variables of upper body are omitted because of low statistical significance. Three correlation levels between actual and predicted values are defined such as weak + (R ≥ 0.6), medium ++ (R ≥ 0.8), and strong (R ≥ 0.9) on the table. The lower body or skateboard motion has direct effect to get fast speed, while the upper body motion has only indirect effect, which balances and unbalances entire body to control skateboard.
4. Correlation Analysis
To understand key factors of tic-tac motion, three types of correlations are employed, i.e. correlation between each pair of sensor’s axes on skateboard, auto-correlations of body and skateboard, and cross-correlations between body and skateboard in terms of accelerometer and gyroscope.
4.1. Correlation between Each Pair of Sensor’s Axes on Skateboard
Correlation between sensor axis pair on skateboard are calculated to analyze skateboard motion in detail. For example, the correlation between ax2 and ay2 is labeled as ax2_ay2. There are 15 pairs of axis of sensor. The multiple regression
(a)  (a)
(a)
Table 1. Independent variables and correlation between actual and predicted time. (a) average variables; (b) Standard deviation variables.
function is estimated with the base-10 logarithmic running time and the 15 independent variables on a body sensor are employed in a regression formula, and then the adjusted R2 is 0.790. Five variables have high statistical significance, i.e. ax2_gz2**, ay2_az2**, ay2_gz2****, gx2_gy2**, and gy2_gz2*. The correlation between the actual and predicted running time is 0.932.
To estimate effect of lower body or skateboard motion on running time, the multiple regression function is estimated with the 12 independent variables derived from sensor on skateboard in terms of average and standard deviation and 15 independent variables in terms of correlation, and then the adjusted R2 is 0.921. Nine variables have high statistical significance, i.e. s_ax2**, s_ay2*, a_az2*, a_gy2*, s_gz2*, ax2_gz2*, ay2_az2**, ay2_gx2**, and gx2_gy2*. The correlation between the actual and predicted running time is 0.987.
To identify important factors to get fast running speed, 41 running data is divided into two category, i.e. fast and slow with a threshold 20 seconds running time. The fast and slow cases have 21 and 20 runs, respectively. The linear discriminant model is estimated with the 12 and 15 independent variables. The model can properly separate 39 cases in 41, which means that successful rate is 0.951.
Evaluation index for all independent variables is defined by each parameter multiplied by each average of independent variable. The difference between fast and slow cases in terms of the index is defined to find important independent variables to achieve fast running speed. The top six variables (and index) are ay2_gz2 (2.497), s_gz2 (1.694), s_ay2 (1.184), gx2_gz2 (0.365), a_ay2 (0.2733), and s_az2 (0.270). Significance of swing motion for getting fast running speed is supported by ay2_gz2, s_gz2, and s_ay2. Tic-tac also needs leaning skateboard (gx2) to turn for swing motion (gz2), which is explained by gx2_gz2.
4.2. Auto-Correlation of Body and Skateboard
To identify relation between running speed and periodicity of motion concerning upper and lower body, 2 average auto-correlations of all six sensor axes are calculated, i.e. acor1 and acor2, respectively. The auto-correlations are converted to base-10 logarithm to identify relation with base 10 logarithmic running time. The multiple regression function is estimated by the 2 variables on upper and lower body, and then the adjusted R2 is 0.965. The variable on skateboard has high statistical significance, i.e. acor2 ****. The other variable on body (acor1) is not statistically significant. The correlation between the actual and predicted running time is 0.983.
To separate effects of upper and lower body on running speed, acor1, which is the auto-correlation of upper body is employed in a regression formula, and then the adjusted R-squared of the model is 0.594. The correlation between the actual and predicted running time is 0.777. In the other hand, acor2, which is the auto-correlation of lower body is employed in a regression formula, and then the adjusted R2 is 0.964. The correlation between the actual and predicted running time is 0.982 (Table 2).
Table 2. Regression analysis and correlation.
The 2 variables (acor1 and acor2) are also employed in a discriminant analysis on running data with 21 fast runs and 20 slow runs. The model can separate 37 cases in 41, which means that successful rate is 0.902. Evaluation index for each variable is also calculated, and then the indexes are 1.954 (acor2) and 0.899 (acor1). According to these results, periodicity of lower body or skateboard is more significant on speed compared to periodicity of upper body in terms of correlation between actual and predicted running speed with regression analysis and discriminant analysis.
4.3. Cross-Correlation between Body and Skateboard
To understand how to generate swing motion of skateboard, two cross-correlations between upper and lower body are calculated in terms of accelerometer and gyroscope, respectively. To generate swing motion, upper body starts rotation to unbalance entire body. And then, lower body follows the upper body rotation to regain body balance and to generate running speed. After regaining body balance, upper body starts counter rotation to unbalance and to get driving force. Zero-lag, maximum, and minimum cross-correlations are employed for analysis of swing motion.
Two zero-lag correlations of accelerometer and gyroscope are employed to estimate two linear regression models, respectively. However the adjusted R2 are low, i.e. 0.015 and 0.044 with normal time scare, and are 0.047 and 0.019 with 10 based logarithmic time scare. According to the result, there is no significant relation of motions between upper and lower because of strict zero-lag or synchronization condition.
To estimate motions of upper and lower body with loose synchronization condition, maximum and minimum values of aggregated cross-correlations on all axes between upper and lower body in terms of accelerometer and gyroscope, i.e. CaMax, CaMin, CgMax, and CgMin. The averages of fast group are 0.950, −0.698, 1.134, and −0.671. The averages of slow runs are 0.673, −0.512, 0.856, and −0.487. They are also employed to estimate the linear regression models to predict the dependent variable, i.e. base 10 logarithmic running time. The adjusted R-squared of the model is 0.772. CaMax***, CaMin****, and CgMin*. The other variable CgMax is not significant. The correlation between the actual and predicted running time is 0.892. The 4 independent variables are also employed in a discriminant analysis on running data with 21 fast runs and 20 slow runs. The model can properly separate 35 cases in 41, which means that successful rate is 0.854. Evaluation index for each variable is also calculated, and then the indexes are 1.027 (CaMin), 0.596 (CaMax), 0.383 (CgMin), and 0.161 (CgMax). The maximum and minimum cross-correlations tend to be derived around zero of time lag. Table 3 summarizes basic statistics of them with time unit of 10 micro second. The outlier means the rate of runs far from the average. The table tells us that all lags are small, which is under 1.5 second and the percentage of outlier is also small, which is under 14%.
To sum up, the regression and discriminant analysis indicates the minimum cross-correlation on accelerometer (CaMin) is the most significant for fast running speed. CaMin is negative value, i.e. −0.698, which describes that counter motion between upper and lower body. The high significance of the variable seems to be meant that counter motion between upper and lower body is effective to generate fast running speed (Table 4).
4.4. Discussion
According to the results in 4.1, 4.2, and 4.3, three important factors are identified, i.e. swing motion of skateboard, periodicity of swing motion, and counter motion between upper and lower body. Figure 4 summarizes important factors of tic-tac motion.
In 4.1, correlation between each pair of sensor’s axes on skateboard is analyzed with discriminant analysis. Significance of swing motion for fast speed is supported by ay2_gz2, which is correlation between side move of front foot (ay2) and rotation of skateboard on back foot (gz2). Tic-tac also needs leaning skateboard to swing it (ay2_gx2), which is correlation between side swing of skateboard (ay2) and leaning one side of skateboard to switch rotation direction of upper body (gx2).
Table 3. Cross-correlation evaluation based on discriminant analysis.
Table 4. Lags of maximum and minimum cross-correlation.
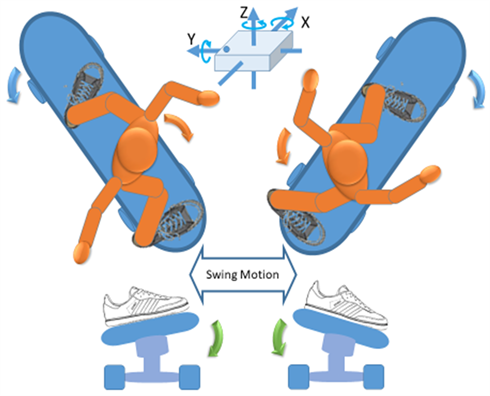
Figure 4. Swing and lean motions for Tic-Tac.
In 4.2, auto-correlations of upper and lower body is also employed to understand relation between periodicity and running speed. Periodicity of lower body or skateboard is more significant on speed compared to periodicity of body in terms of correlation between actual and predicted running speed with regression analysis and discriminant analysis. On the other hand, in 4.3, cross-correlations between upper and lower body in terms of accelerometer and gyroscope is calculated to discuss motion timing. The regression and discriminant analysis indicate the minimum cross-correlation on accelerometer (CaMin) is the most significant for fast running speed. The high significance of the variable seems to be meant that counter motion between upper and lower body is effective to generate fast running speed.
5. Conclusion
This research discussed sport skill with statistical analysis on wearable sensor data. We selected skateboarding as the target sport and Tic-Tac as a basic skill to move forward with a skateboard. According to the result of statistical analysis on sensor data, we identified three important factors to get fast speed are identified, i.e. swing motion of skateboard, periodicity of swing motion, and counter motion between upper and lower body. This result means that wearable sensors and statistical analysis are effective tools to evaluate sport skill and to find important factors for sports science and physical education.
Conflicts of Interest
The author declares no conflicts of interest regarding the publication of this paper.
Cite this paper
Ishida, K. (2019) Sport Skill Evaluation with Wearable Sensors and Statistical Analysis. Open Journal of Social Sciences, 7, 220-230. https://doi.org/10.4236/jss.2019.73019
References
- 1. Ishida, K. (2018) Statistical Analysis of Critical Factors in Action Sports Perfor-mance with Wearable Sensors. Proceedings of Asia-Singapore Conference on Sport Science (ACSS 2018), Singapore, 17-18 July 2018.
- 2. Ueda, T., Sugimura, H., Matsumoto, K. and Isshiki, M. (2013) Activity Recognition of the Human from Sensor Data. Proceedings of the 27th Annual Conference of the Japanese Society for Artificial Intelligence, Toyama, 6-7 June 2013, No. 1C5-6.
- 3. Morita, Y., Okamoto, J., Kawamura, K., Seki, M., Sessa, S., Zecca, M., Lin, Z., Ishii, H., Takasugi, S., Takanashi, A. and Fujie, M. (2010) Gait Analy-sis System of Presumption of Method to Estimate Right and Left Separated Ground Reaction Force Using Acceleration Sensor. Proceedings of the Welfare, Well-Being, Life Support (WWLS), Osaka, 489-491. (In Japanese)
- 4. Avci, A., Bosch, S., Marin-Perianu, M., Marin-Perianu, R. and Havinga, R. (2010) Activity Recognition Using Inertial Sensing for Healthcare, Wellbeing and Sports Appli-cations: A Survey. Proceedings of the 23rd International Conference on Archi-tecture of Computing Systems (ARCS), Hannover, Germany.
- 5. Harding, J. W., Mackintosh, C. G., Hahn, A.G. and James, D.A. (2008) Classification of Aerial Acrobatics. Proceedings of the 7th Snowboarding Using Inertial Sensors ISEA, Biarritz, 2-6 June 2008.
- 6. Crockett, B.A. and Jensen, R.L. (2007) Kinematic Analysis and Muscular Activity of Skateboard Propulsion in Experienced Par-ticipants. Proceedings of the 25th International Symposium on Biomechanics in Sports, Ouro Preto, Brazil, 23-27 August 2007, 602.
- 7. Ishida, K. (2016) Classification of Turn Maneuvers on Halfpipe with Multiple Sensors. Interna-tional Journal of Electronics and Electrical Engineering, 4, 420-425. https://doi.org/10.18178/ijeee.4.5.420-425
- 8. Ishida, K. (2016) Action Sports Analysis Based on Local Cross Correlation and Action Measurement Units with GPS Timestamp. Proceedings of the 3rd International Workshop on Skill Science, JSAI International Symposia on AI, Kanagawa, 16 November 2016.