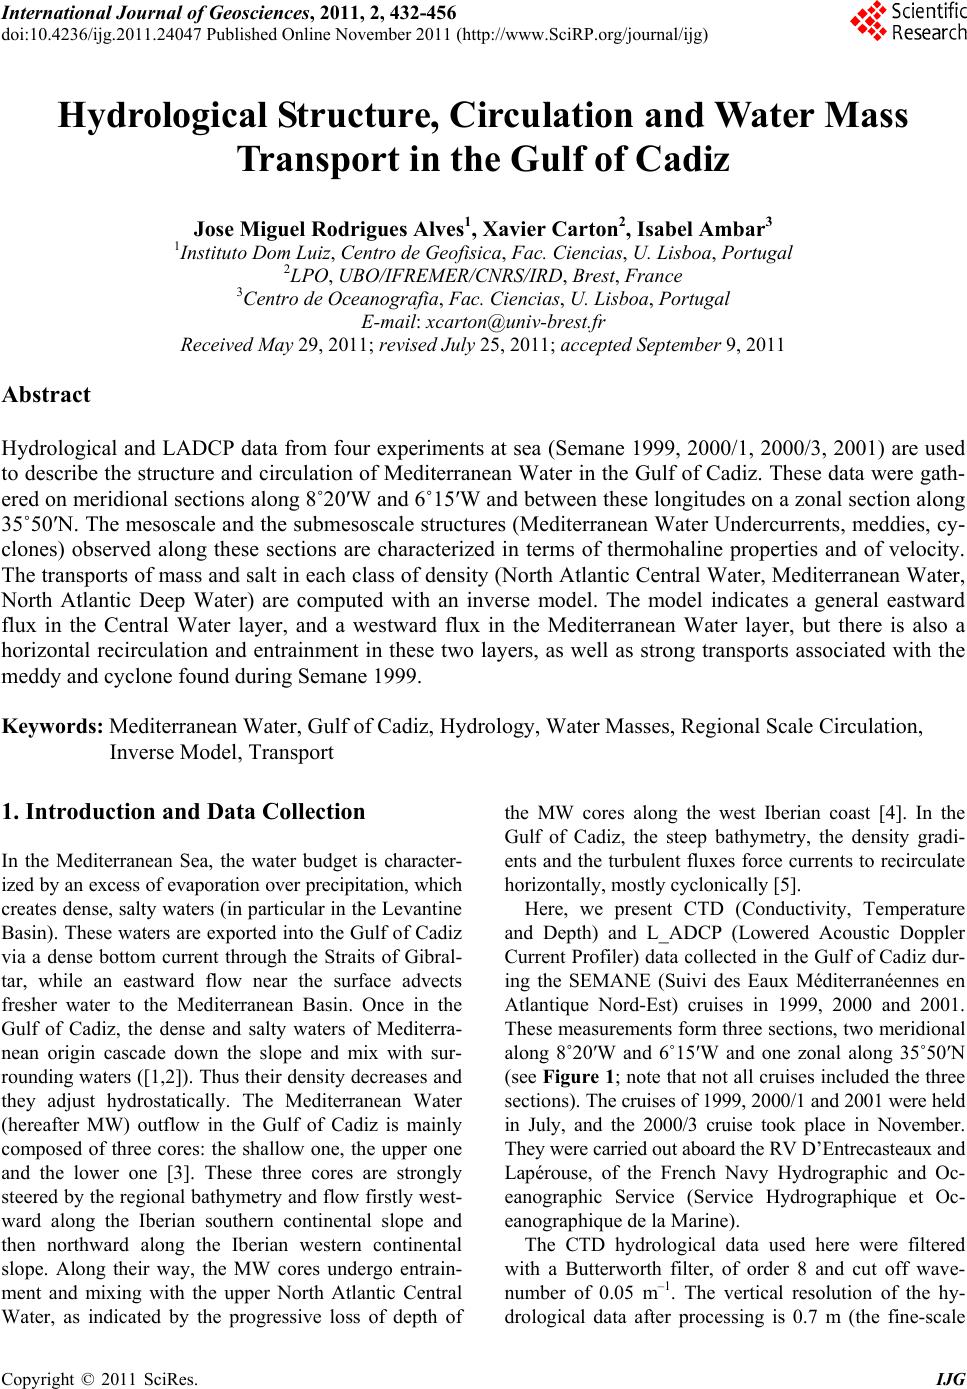
 International Journal of Geosciences, 2011, 2, 432-456 doi:10.4236/ijg.2011.24047 Published Online November 2011 (http://www.SciRP.org/journal/ijg) Copyright © 2011 SciRes. IJG Hydrological Structure, Circulation and Water Mass Transport in the Gulf of Cadiz Jose Miguel Rodrigues Alves1, Xavier Carton2, Isabel Ambar3 1Instituto Dom Luiz, Centro de Geofisica, Fac. Ciencias, U. Lisboa, Portugal 2LPO, UBO/IFREMER/CNRS/IRD, Brest, France 3Centro de Ocean o gr af i a, Fac. Ciencias, U. Lisboa, Portugal E-mail: xcarton@univ-brest.fr Received May 29, 2011; revised July 25, 2011; accepted September 9, 2011 Abstract Hydrological and LADCP data from four experiments at sea (Semane 1999, 2000/1, 2000/3, 2001) are used to describe the structure and circulation of Mediterranean Water in the Gulf of Cadiz. These data were gath- ered on meridional sections along 8˚20′W and 6˚15′W and between these longitudes on a zonal section along 35˚50′N. The mesoscale and the submesoscale structures (Mediterranean Water Undercurrents, meddies, cy- clones) observed along these sections are characterized in terms of thermohaline properties and of velocity. The transports of mass and salt in each class of density (North Atlantic Central Water, Mediterranean Water, North Atlantic Deep Water) are computed with an inverse model. The model indicates a general eastward flux in the Central Water layer, and a westward flux in the Mediterranean Water layer, but there is also a horizontal recirculation and entrainment in these two layers, as well as strong transports associated with the meddy and cyclone found during Semane 1999. Keywords: Mediterranean Water, Gulf of Cadiz, Hydrology, Water Masses, Regional Scale Circulation, Inverse Model, Transport 1. Introduction and Data Collection In the Mediterranean Sea, the water budget is character- ized by an excess of evaporation over precipitation, which creates dense, salty waters (in particular in the Levantine Basin). These waters are exported into the Gulf of Cadiz via a dense bottom current through the Straits of Gibral- tar, while an eastward flow near the surface advects fresher water to the Mediterranean Basin. Once in the Gulf of Cadiz, the dense and salty waters of Mediterra- nean origin cascade down the slope and mix with sur- rounding waters ([1,2]). Thus their density decreases and they adjust hydrostatically. The Mediterranean Water (hereafter MW) outflow in the Gulf of Cadiz is mainly composed of three cores: the shallow one, the upper one and the lower one [3]. These three cores are strongly steered by the regional bathymetry and flow firstly west- ward along the Iberian southern continental slope and then northward along the Iberian western continental slope. Along their way, the MW cores undergo entrain- ment and mixing with the upper North Atlantic Central Water, as indicated by the progressive loss of depth of the MW cores along the west Iberian coast [4]. In the Gulf of Cadiz, the steep bathymetry, the density gradi- ents and the turbulent fluxes force currents to recirculate horizontally, mostly cyclonically [5]. Here, we present CTD (Conductivity, Temperature and Depth) and L_ADCP (Lowered Acoustic Doppler Current Profiler) data collected in the Gulf of Cadiz dur- ing the SEMANE (Suivi des Eaux Méditerranéennes en Atlantique Nord-Est) cruises in 1999, 2000 and 2001. These measurements form three sections, two meridional along 8˚20′W and 6˚15′W and one zonal along 35˚50′N (see Figure 1; note that not all cruises included the three sections). The cruises of 1999, 2000/1 and 2001 were held in July, and the 2000/3 cruise took place in November. They were carried out aboard the RV D’Entrecasteaux and Lapérouse, of the French Navy Hydrographic and Oc- eanographic Service (Service Hydrographique et Oc- eanographique de la Marine). The CTD hydrological data used here were filtered with a Butterworth filter, of order 8 and cut off wave- number of 0.05 m–1. The vertical resolution of the hy- drological data after processing is 0.7 m (the fine-scale 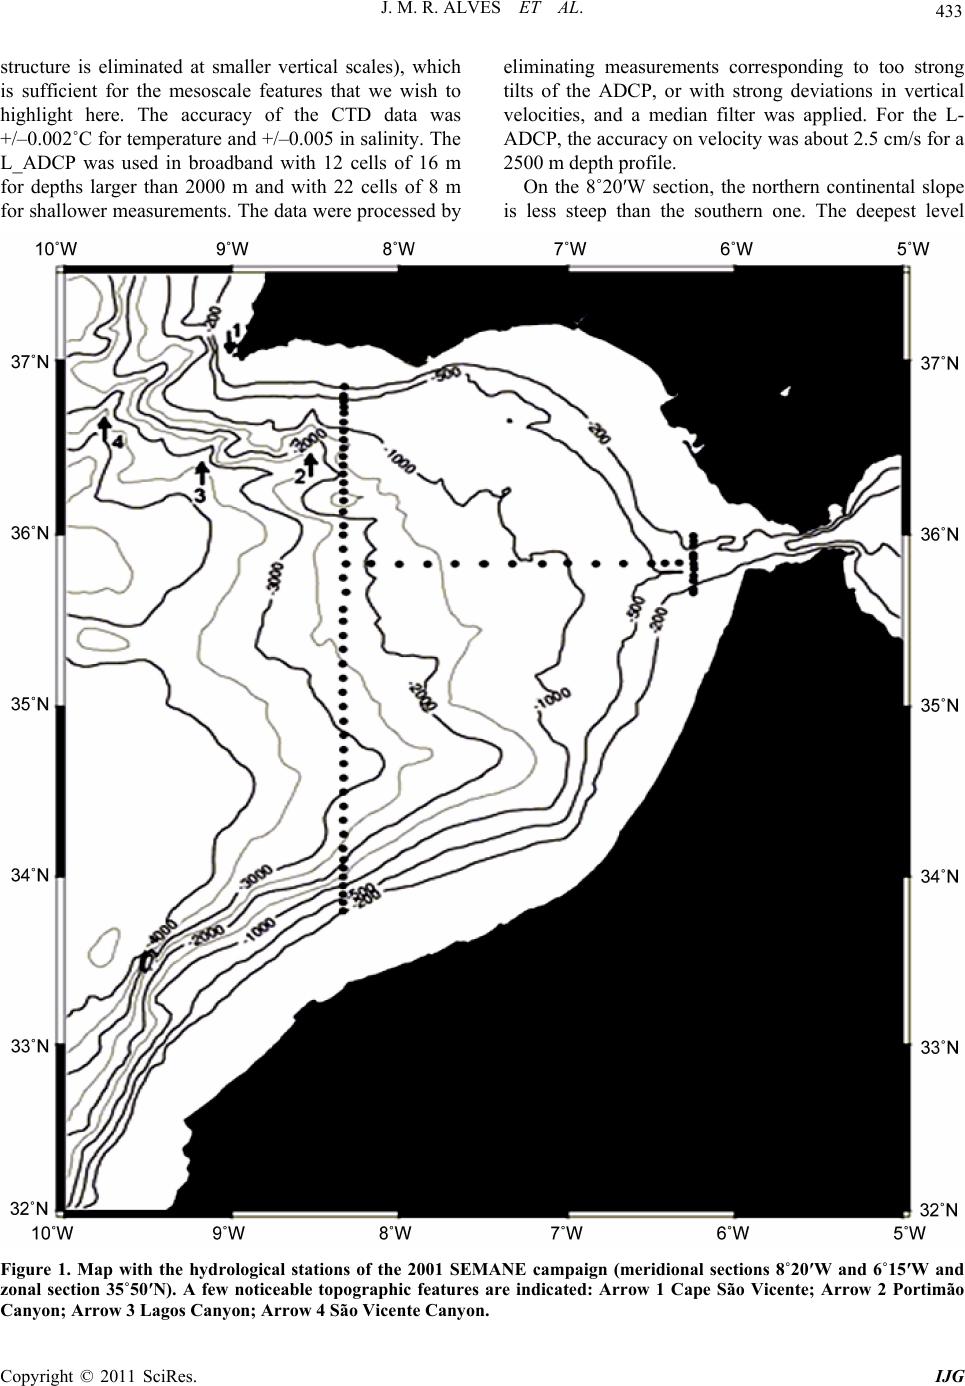 433 J. M. R. ALVES ET AL. structure is eliminated at smaller vertical scales), which is sufficient for the mesoscale features that we wish to highlight here. The accuracy of the CTD data was +/–0.002˚C for temperature and +/–0.005 in salinity. The L_ADCP was used in broadband with 12 cells of 16 m for depths larger than 2000 m and with 22 cells of 8 m for shallower measurements. The data were processed by eliminating measurements corresponding to too strong tilts of the ADCP, or with strong deviations in vertical velocities, and a median filter was applied. For the L- ADCP, the accuracy on velocity was about 2.5 cm/s for a 2500 m depth profile. On the 8˚20′W section, the northern continental slope is less steep than the southern one. The deepest level Figure 1. Map with the hydrological stations of the 2001 SEMANE campaign (meridional sections 8˚20′W and 6˚15′W and zonal section 35˚50′N). A few noticeable topographic features are indicated: Arrow 1 Cape São Vicente; Arrow 2 Portimão anyon; Arrow 3 Lagos Canyon; Arrow 4 São Vicente Canyon. C Copyright © 2011 SciRes. IJG 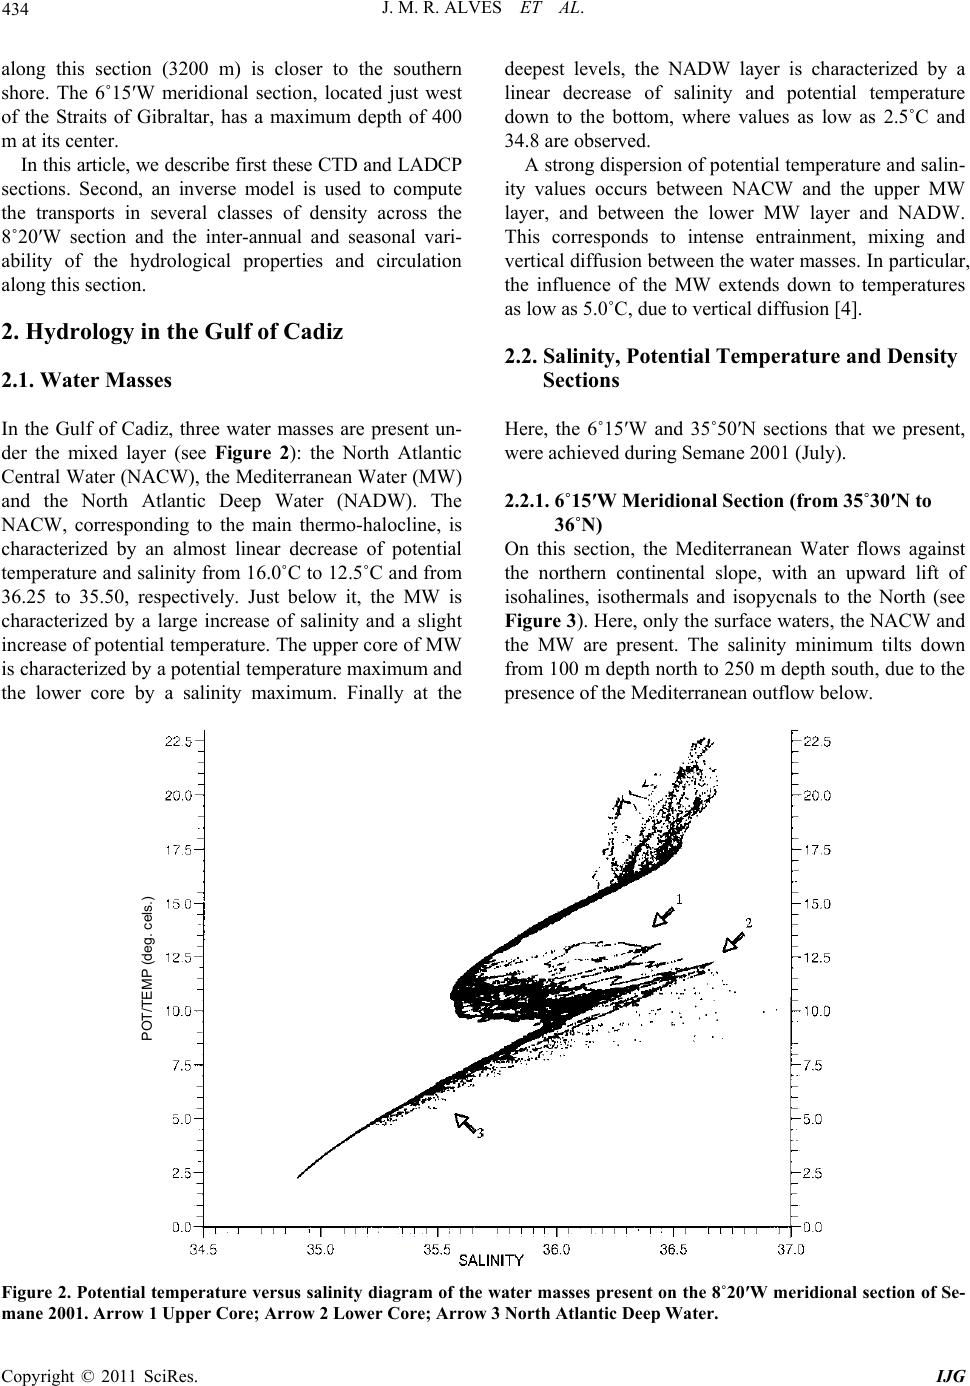 434 J. M. R. ALVES ET AL. along this section (3200 m) is closer to the southern shore. The 6˚15′W meridional section, located just west of the Straits of Gibraltar, has a maximum depth of 400 m at its center. In this article, we describe first these CTD and LADCP sections. Second, an inverse model is used to compute the transports in several classes of density across the 8˚20′W section and the inter-annual and seasonal vari- ability of the hydrological properties and circulation along this section. 2. Hydrology in the Gulf of Cadiz 2.1. Water Masses In the Gulf of Cadiz, three water masses are present un- der the mixed layer (see Figure 2): the North Atlantic Central Water (NACW), the Mediterranean Water (MW) and the North Atlantic Deep Water (NADW). The NACW, corresponding to the main thermo-halocline, is characterized by an almost linear decrease of potential temperature and salinity from 16.0˚C to 12.5˚C and from 36.25 to 35.50, respectively. Just below it, the MW is characterized by a large increase of salinity and a slight increase of potential temperature. The upper core of MW is characterized by a potential temperature maximum and the lower core by a salinity maximum. Finally at the deepest levels, the NADW layer is characterized by a linear decrease of salinity and potential temperature down to the bottom, where values as low as 2.5˚C and 34.8 are observed. A strong dispersion of potential temperature and salin- ity values occurs between NACW and the upper MW layer, and between the lower MW layer and NADW. This corresponds to intense entrainment, mixing and vertical diffusion between the water masses. In particular, the influence of the MW extends down to temperatures as low as 5.0˚C, due to vertical diffusion [4]. 2.2. Salinity, Potential Temperature and Density Sections Here, the 6˚15′W and 35˚50′N sections that we present, were achieved during Semane 2001 (July). 2.2.1. 6˚15′W Meridional Section (from 35˚30′N to 36˚N) On this section, the Mediterranean Water flows against the northern continental slope, with an upward lift of isohalines, isothermals and isopycnals to the North (see Figure 3). Here, only the surface waters, the NACW and the MW are present. The salinity minimum tilts down from 100 m depth north to 250 m depth south, due to the presence of the Mediterranean outflow below. POT/TEMP (deg. cels.) Figure 2. Potential temperature versus salinity diagram of the water masses present on the 8˚20′W meridional section of Se- mane 2001. Arrow 1 Upper Core; Arrow 2 Lower Core; Arrow 3 North Atlantic Deep Water. C opyright © 2011 SciRes. IJG 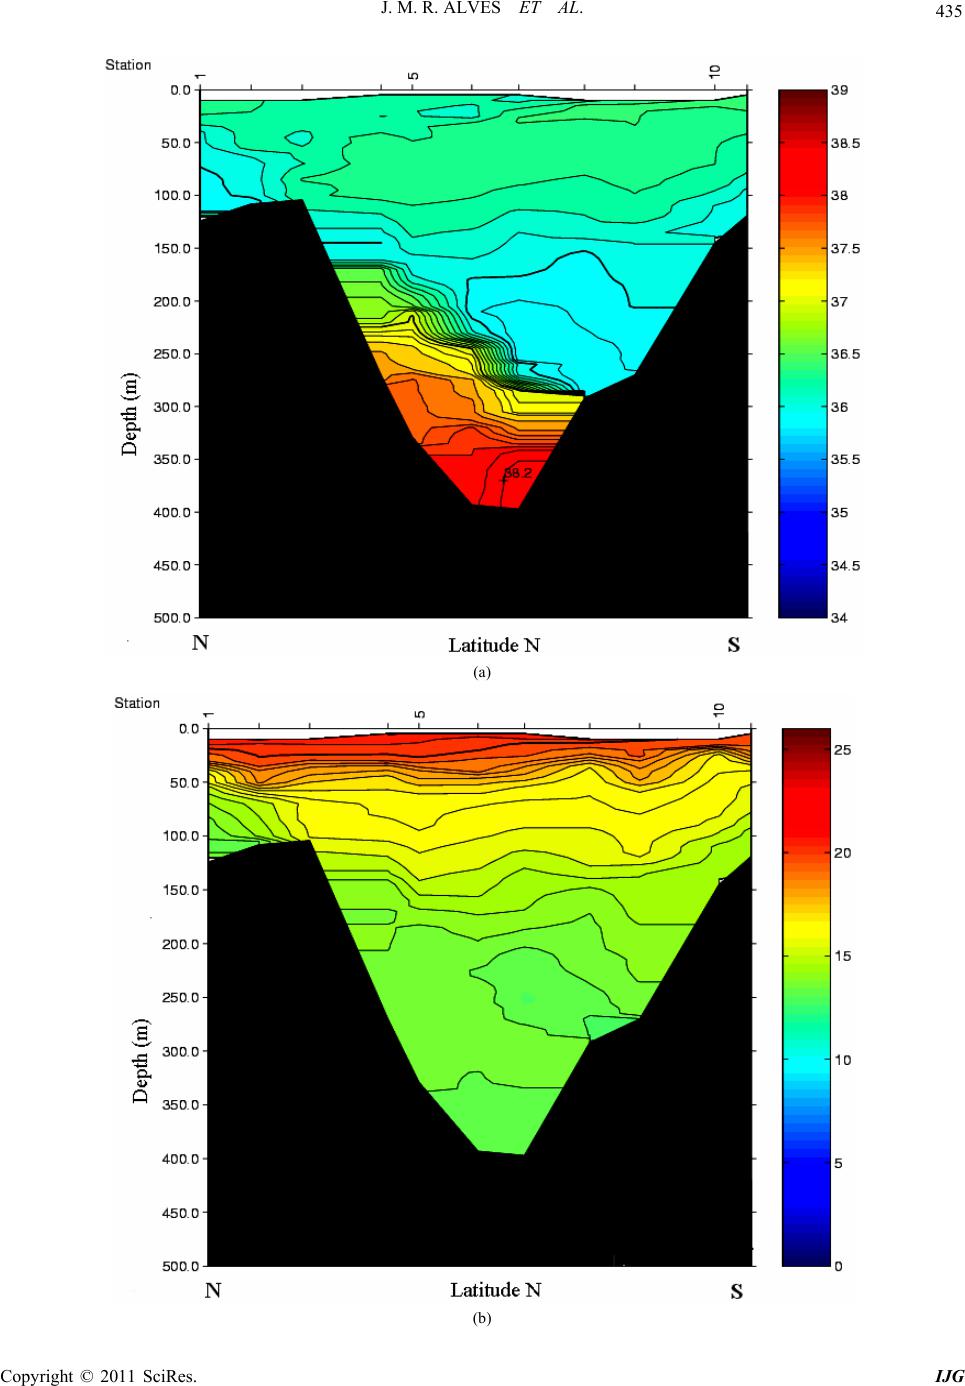 435 J. M. R. ALVES ET AL. (a) (b) Copyright © 2011 SciRes. IJG 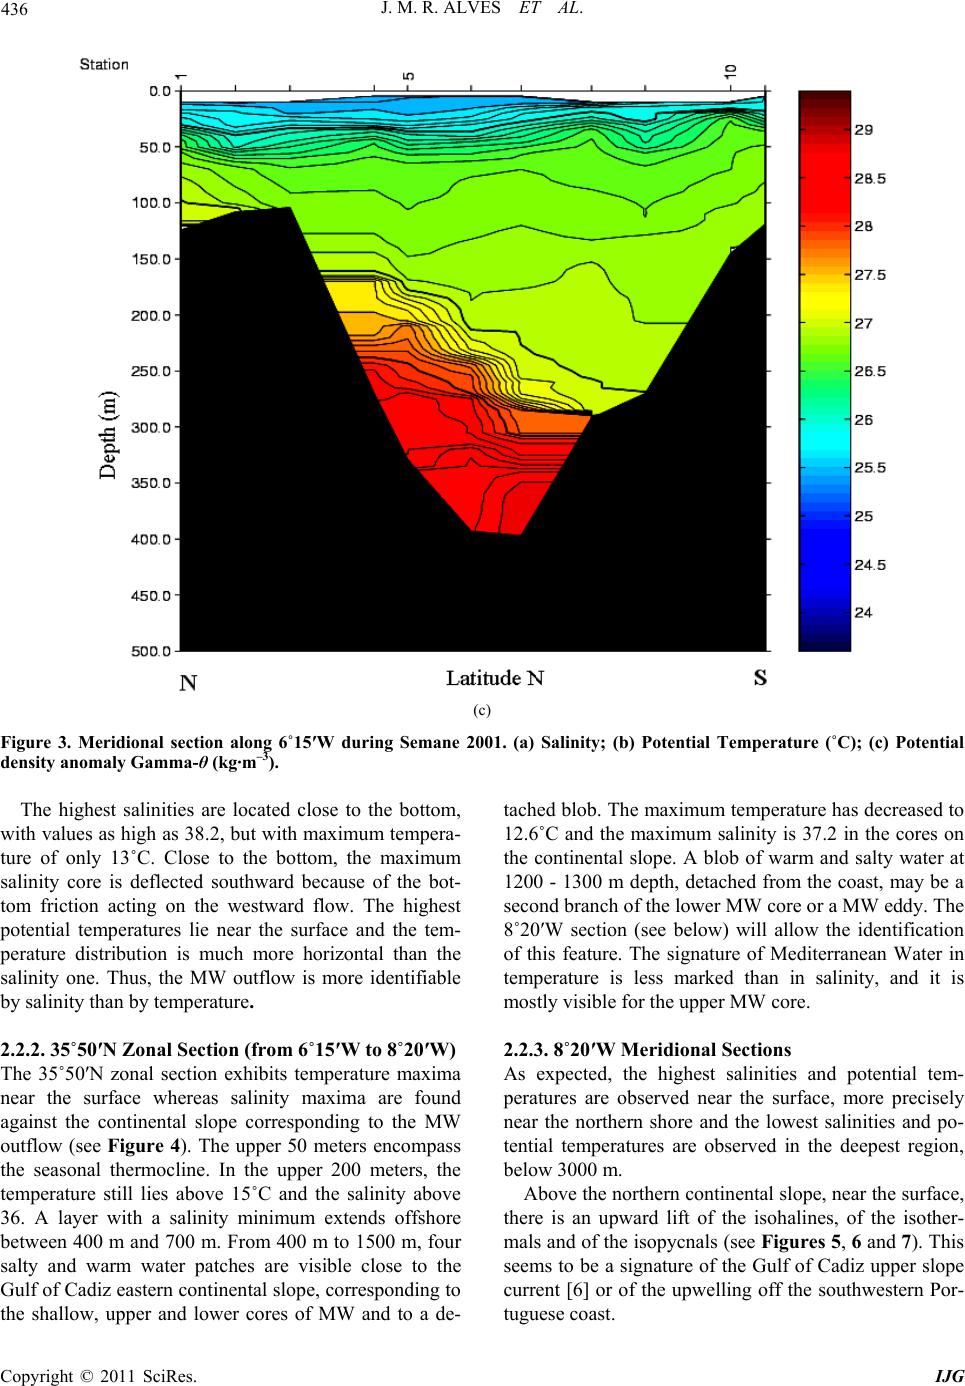 J. M. R. ALVES ET AL. Copyright © 2011 SciRes. IJG 436 (c) Figure 3. Meridional section along 6˚15′W during Semane 2001. (a) Salinity; (b) Potential Temperature (˚C); (c) Potential density anomaly Gamma-θ (kg·m–3). The highest salinities are located close to the bottom, with values as high as 38.2, but with maximum tempera- ture of only 13˚C. Close to the bottom, the maximum salinity core is deflected southward because of the bot- tom friction acting on the westward flow. The highest potential temperatures lie near the surface and the tem- perature distribution is much more horizontal than the salinity one. Thus, the MW outflow is more identifiable by salinity than by temperature. 2.2.2. 35˚50′N Zonal Section (from 6˚15′W to 8˚20′W) The 35˚50′N zonal section exhibits temperature maxima near the surface whereas salinity maxima are found against the continental slope corresponding to the MW outflow (see Figure 4). The upper 50 meters encompass the seasonal thermocline. In the upper 200 meters, the temperature still lies above 15˚C and the salinity above 36. A layer with a salinity minimum extends offshore between 400 m and 700 m. From 400 m to 1500 m, four salty and warm water patches are visible close to the Gulf of Cadiz eastern continental slope, corresponding to the shallow, upper and lower cores of MW and to a de- tached blob. The maximum temperature has decreased to 12.6˚C and the maximum salinity is 37.2 in the cores on the continental slope. A blob of warm and salty water at 1200 - 1300 m depth, detached from the coast, may be a second branch of the lower MW core or a MW eddy. The 8˚20′W section (see below) will allow the identification of this feature. The signature of Mediterranean Water in temperature is less marked than in salinity, and it is mostly visible for the upper MW core. 2.2.3. 8˚20′W Meridional Sections As expected, the highest salinities and potential tem- peratures are observed near the surface, more precisely near the northern shore and the lowest salinities and po- tential temperatures are observed in the deepest region, below 3000 m. Above the northern continental slope, near the surface, there is an upward lift of the isohalines, of the isother- mals and of the isopycnals (see Figures 5, 6 and 7). This seems to be a signature of the Gulf of Cadiz upper slope current [6] or of the upwelling off the southwestern Por- uguese coast. t  437 J. M. R. ALVES ET AL. (a) (b) Figure 4. Zonal section along 35º50′N during Semane 2001: (a) Salinity; (b) Potential temperature (˚C). The NACW layer below the surface layer is charac- terized by a decrease of salinity and potential tempera- ture (see Figures 5 and 6). The level of minimum salin- ity lies near 500 - 600 m depth. Deeper down, the layer corresponding to MW is clearly composed of three different elements: the under- currents on the northern continental slope, detached ed- ies (in some of the realizations of this section) and a d Copyright © 2011 SciRes. IJG  438 J. M. R. ALVES ET AL. (a) (b) C opyright © 2011 SciRes. IJG  439 J. M. R. ALVES ET AL. (c) (d) Figure 5. Salinity distribution along the 8˚20′W section. (a) July 1999; (b) July 2000; (c) November 2000; (d) July 2001. more diffuse tongue. All three elements are clearly iden- tifiable in salinity, while only the former two correspond Copyright © 2011 SciRes. IJG  440 J. M. R. ALVES ET AL. (a) (b) C opyright © 2011 SciRes. IJG  441 J. M. R. ALVES ET AL. (c) (d) Figure 6. Potential temperature (˚C) distribution along the 8˚20′W section. (a) July 1999; (b) July 2000; (c) November 2000; (d) July 2001. Copyright © 2011 SciRes. IJG  442 J. M. R. ALVES ET AL. (a) (b) C opyright © 2011 SciRes. IJG  J. M. R. ALVES ET AL. Copyright © 2011 SciRes. IJG 443 (c) Figure 7. Density anomaly distribution (kg·m–3) along the 8˚20′W section (a) July 1999; red squares indicate the region where the highest geostrophic velocities were computed; (b) July 2000; (c) July 2001. to a marked temperature anomaly. The MW undercur- rents have salinity maxima varying between 36.5 and 37, and maximum temperature of the order of 12.5˚C. The eddies have maximum salinity between 36.2 and 36.4 (they correspond to MW which has recirculated in the Gulf of Cadiz, and therefore has mixed somewhat) and maximal temperature of the order of 12.4˚C. Finally, the tongue is more diffuse with 36 in salinity and 12˚C in temperature. The MW layer is present from 500 until 1600 m, near the northern continental slope, and from 700 until 1300 m south of this slope. It is also noted that the high salini- ties and temperatures of MW observed in the 6˚15′W section are no longer present in the 8˚20′W section, as the MW outflow undergoes entrainment and mixing with the NACW while progressing downstream. Finally, the thermohaline properties of NADW are observed in the deeper part of these sections (below 2700 m). In the MW layer, detached fragments are clearly visi- ble in the July 1999, 2000 and 2001 sections; in 1999, they correspond (from North to South) to a small eddy, to a cyclone and to a meddy, which were studied in detail in [7]. A filament lies between the cyclone and the south- ern meddy that is clearly seen in horizontal maps of sa- linity at 1200 m depth only. In July 2000, the patch lies in the southern half of the section, with about 36.2 in salinity and 120 km in meridional extent. A perpendicu- lar cross-section along 35˚05′N, from 8˚05′W to 9˚08′W, and a deep-drogued surface buoy trajectory (see Appen- dix) confirm that this fragment is a meddy. In 2001, the elongated lens between stations 20 and 34 corresponds to a meddy. This meddy is about 60 km in zonal extent and 80 km in meridional extent. Again two small fragments are observed near stations 36 - 37 and 43 - 44. A detached patch is also observed in the section of November 2000, close to the undercurrents, smaller (about 65 km in size) than in July 2000, and with about the same salinity peak. This fragment is also observed in the temperature sections, though less conspicuous. For November 2000, no other data are available to confirm if the detached fragment is a meddy. Now we compare the July with the November sections (see again Figures 5 and 6). The lower MW core is at slightly deeper levels near the northern continental slope 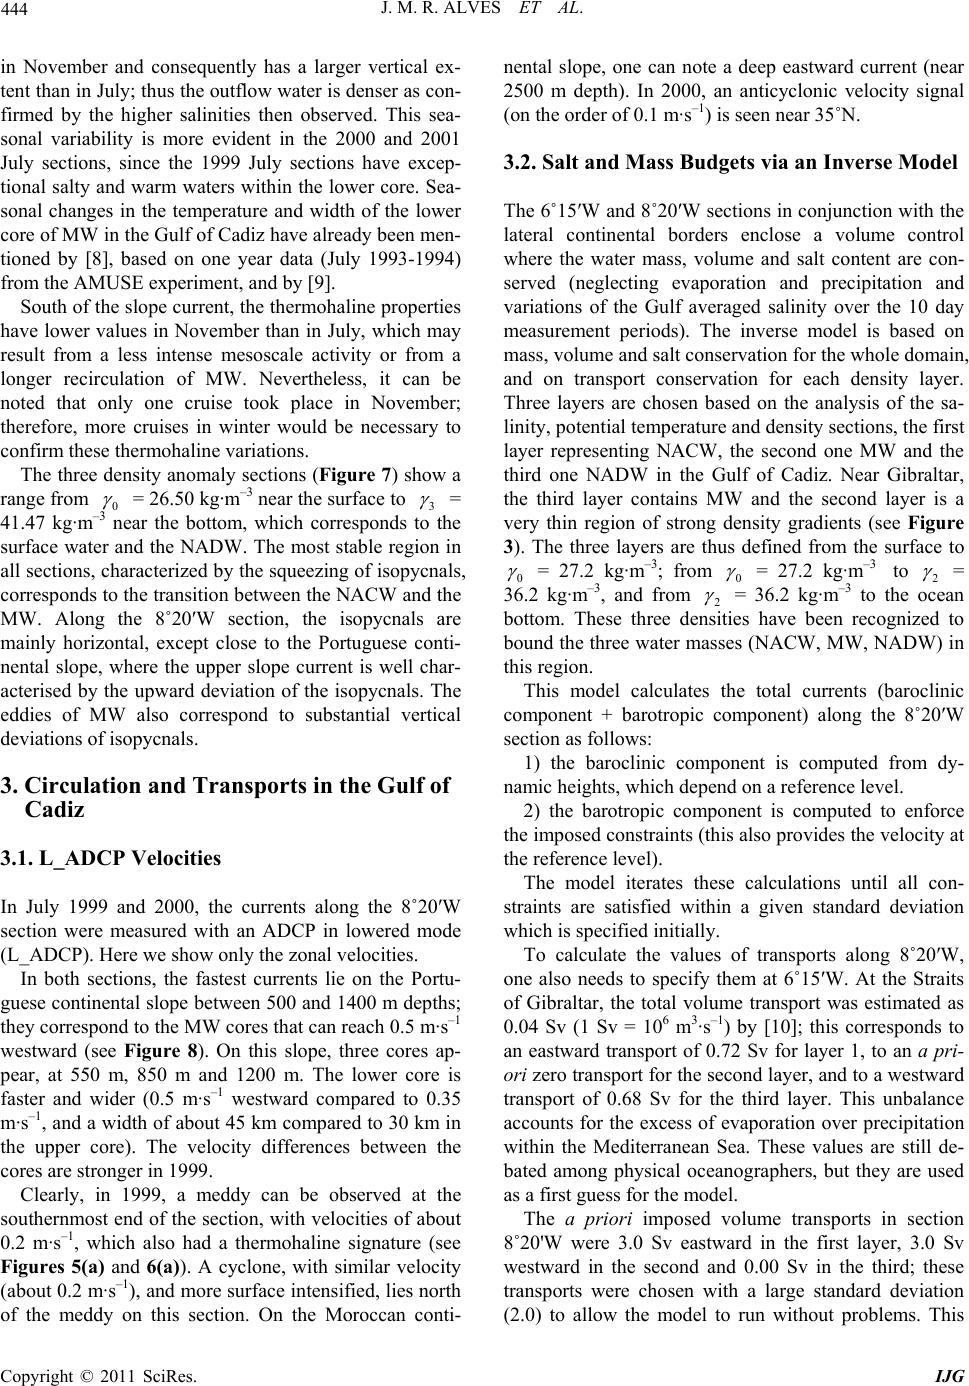 444 J. M. R. ALVES ET AL. in November and consequently has a larger vertical ex- tent than in July; thus the outflow water is denser as con- firmed by the higher salinities then observed. This sea- sonal variability is more evident in the 2000 and 2001 July sections, since the 1999 July sections have excep- tional salty and warm waters within the lower core. Sea- sonal changes in the temperature and width of the lower core of MW in the Gulf of Cadiz have already been men- tioned by [8], based on one year data (July 1993-1994) from the AMUSE experiment, and by [9]. South of the slope current, the thermohaline properties have lower values in November than in July, which may result from a less intense mesoscale activity or from a longer recirculation of MW. Nevertheless, it can be noted that only one cruise took place in November; therefore, more cruises in winter would be necessary to confirm these thermohaline variations. The three density anomaly sections (Figure 7) show a range from 0 = 26.50 kg·m–3 near the surface to 3 = 41.47 kg·m–3 near the bottom, which corresponds to the surface water and the NADW. The most stable region in all sections, characterized by the squeezing of isopycnals, corresponds to the transition between the NACW and the MW. Along the 8˚20′W section, the isopycnals are mainly horizontal, except close to the Portuguese conti- nental slope, where the upper slope current is well char- acterised by the upward deviation of the isopycnals. The eddies of MW also correspond to substantial vertical deviations of isopycnals. 3. Circulation and Transports in the Gulf of Cadiz 3.1. L_ADCP Velocities In July 1999 and 2000, the currents along the 8˚20′W section were measured with an ADCP in lowered mode (L_ADCP). Here we show only the zonal velocities. In both sections, the fastest currents lie on the Portu- guese continental slope between 500 and 1400 m depths; they correspond to the MW cores that can reach 0.5 m·s–1 westward (see Figure 8). On this slope, three cores ap- pear, at 550 m, 850 m and 1200 m. The lower core is faster and wider (0.5 m·s–1 westward compared to 0.35 m·s –1, and a width of about 45 km compared to 30 km in the upper core). The velocity differences between the cores are stronger in 1999. Clearly, in 1999, a meddy can be observed at the southernmost end of the section, with velocities of about 0.2 m·s–1, which also had a thermohaline signature (see Figures 5(a) and 6(a)). A cyclone, with similar velocity (about 0.2 m·s–1), and more surface intensified, lies north of the meddy on this section. On the Moroccan conti- nental slope, one can note a deep eastward current (near 2500 m depth). In 2000, an anticyclonic velocity signal (on the order of 0.1 m·s–1) is seen near 35˚N. 3.2. Salt and Mass Budgets via an Inverse Model The 6˚15′W and 8˚20′W sections in conjunction with the lateral continental borders enclose a volume control where the water mass, volume and salt content are con- served (neglecting evaporation and precipitation and variations of the Gulf averaged salinity over the 10 day measurement periods). The inverse model is based on mass, volume and salt conservation for the whole domain, and on transport conservation for each density layer. Three layers are chosen based on the analysis of the sa- linity, potential temperature and density sections, the first layer representing NACW, the second one MW and the third one NADW in the Gulf of Cadiz. Near Gibraltar, the third layer contains MW and the second layer is a very thin region of strong density gradients (see Figure 3). The three layers are thus defined from the surface to 0 = 27.2 kg·m–3; from 0 = 27.2 kg·m–3 to 2 = 36.2 kg·m–3, and from 2 = 36.2 kg·m–3 to the ocean bottom. These three densities have been recognized to bound the three water masses (NACW, MW, NADW) in this region. This model calculates the total currents (baroclinic component + barotropic component) along the 8˚20′W section as follows: 1) the baroclinic component is computed from dy- namic heights, which depend on a reference level. 2) the barotropic component is computed to enforce the imposed constraints (this also provides the velocity at the reference level). The model iterates these calculations until all con- straints are satisfied within a given standard deviation which is specified initially. To calculate the values of transports along 8˚20′W, one also needs to specify them at 6˚15′W. At the Straits of Gibraltar, the total volume transport was estimated as 0.04 Sv (1 Sv = 106 m3·s–1) by [10]; this corresponds to an eastward transport of 0.72 Sv for layer 1, to an a pri- ori zero transport for the second layer, and to a westward transport of 0.68 Sv for the third layer. This unbalance accounts for the excess of evaporation over precipitation within the Mediterranean Sea. These values are still de- bated among physical oceanographers, but they are used as a first guess for the model. The a priori imposed volume transports in section 8˚20'W were 3.0 Sv eastward in the first layer, 3.0 Sv westward in the second and 0.00 Sv in the third; these transports were chosen with a large standard deviation 2.0) to allow the model to run without problems. This ( C opyright © 2011 SciRes. IJG 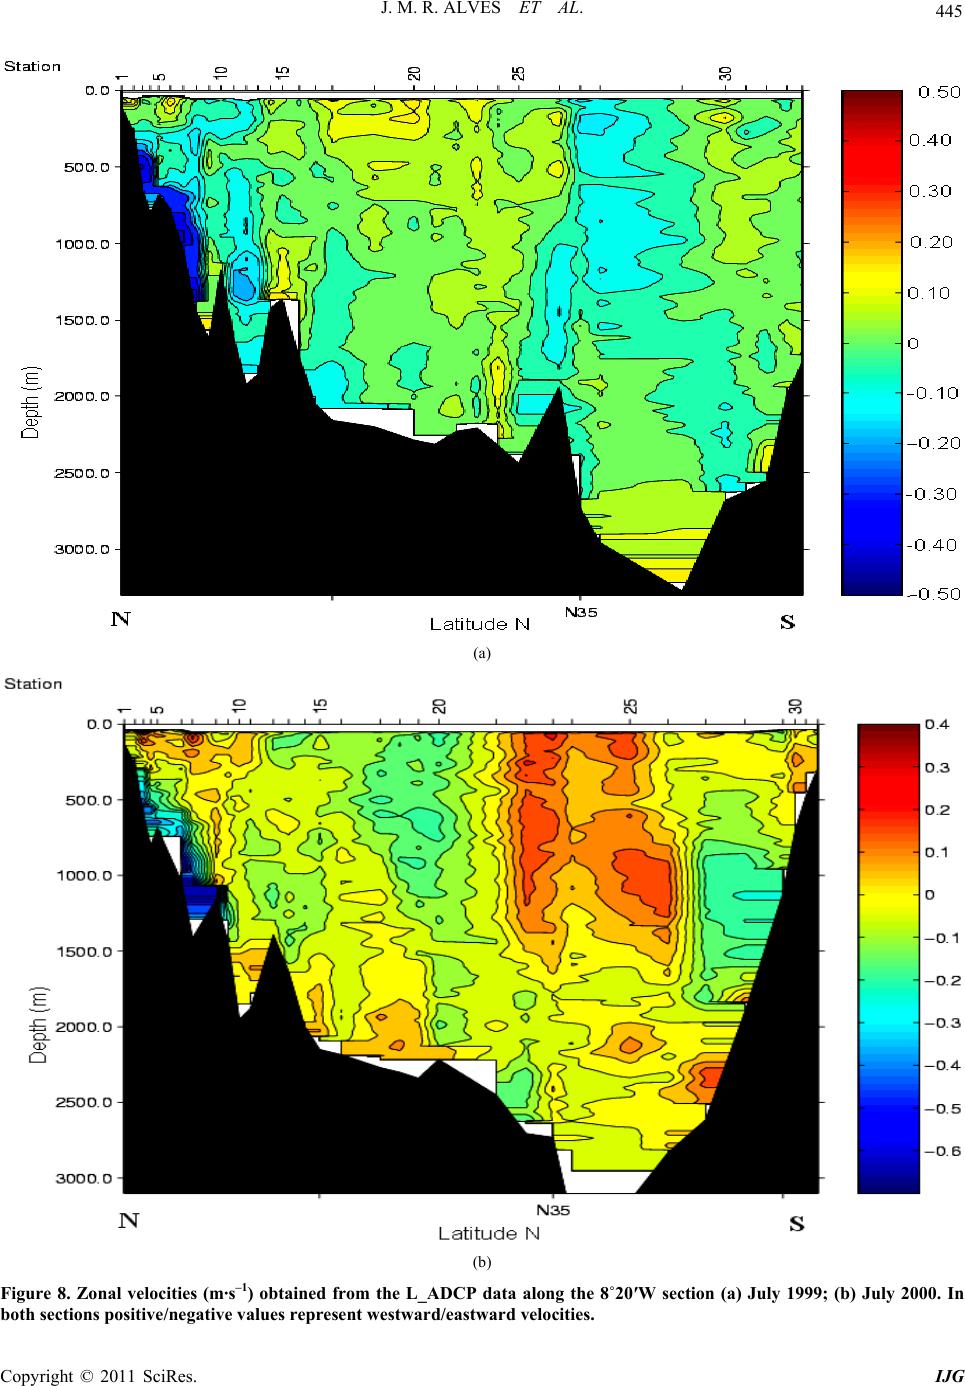 J. M. R. ALVES ET AL. Copyright © 2011 SciRes. IJG 445 (a) (b) Figure 8. Zonal velocities (m·s–1) obtained from the L_ADCP data along the 8˚20′W section (a) July 1999; (b) July 2000. In oth sections positive/negative values represent westward/eastward velocities. b  446 J. M. R. ALVES ET AL. initial imbalance between the inflow at the Straits of Gi- braltar and the null flux at 8˚20′W is immediately com- pensated by the model while converging to the solution; furthermore it is within the limits of the standard devia- tion. A salt balance at the Straits of Gibraltar (that is, cov- ering the Mediterranean Sea) was also taken into account Qi·Si = Qo·So (1) with Qi = 0.72 Sv (volume inflow), Si = 36.10 (salinity inflow) and Qo = 0.68 Sv (volume outflow), considering that the salinity in the Gulf of Cadiz is constant. With the values of Qi, Si and Qo a salinity outflow value (So = 38.22) was obtained from the salt balance equation. In addition to the imposed transports, geostrophic ve- locities were used as first guess for the inverse model. With each a priori imposed geostrophic velocity a stan- dard deviation of 0.10 was imposed for the 8 northern- most stations pairs to account for the variability in the slope current region and a deviation of 0.05 for the other stations pairs; after the inversion, the results are valid if they lie in this imposed range. With this information and these constraints, the in- verse model calculates the total velocities and the trans- ports in each range of densities. 3.2.1. Graphs of the Cumulative Transports In addition to the geostrophic transports, the Ekman transports were also computed from climatological wind data and they were included in the first layer. The Ekman transports were always directed westward in the three July experiments and eastward in the November experi- ment. This is expected, since the winds are mainly north- erlies in July and southerlies in November over the Gulf of Cadiz. The order of magnitude of the Ekman trans- ports was always two times smaller than the geostrophic transports, so that their influence in the total transport is negligible. Near the bottom of the Gulf, the transports at the deep- est level were weak, having only some importance near the continental slopes; these transports were computed considering that the velocity in the bottom triangle was equal to the velocity of the last pair of stations. The dif- fusive vertical transports were also taken into account here, although the sensitivity studies showed that they have a negligible influence on the final total transports. The cumulative transports (i.e. the meridional integral of transports from the northern shore to the local position) were computed for each realisation of the 8˚20′W section. In the graphs of cumulative transports presented in Fig- ure 9, an ascending line represents an eastward flow zone and a descending line represents a westward flow zone. The total cumulative transports are obtained at the southern end of the 8˚20′W section on the Moroccan shelf, about 330 km from the Portuguese shore. They are, averaged over the four 8˚20′W sections, 2 Sv eastward in the first layer, 2 Sv westward in the second layer and almost zero in the third layer. The opposite values of the total cumulative transports in the first and second layers are mainly caused by an eastward current located be- tween 30 and 80 km from the Portuguese shore, which is always present in the first layer and is weaker or absent (respectively in November 2000, and in the other case) in the second layer. Therefore, in the first layer, cumulative eastward transports of about 2 or 3 Sv are observed within 80 to 100 km of the Portuguese shore. Apart from this feature, the graphs of cumulative transport show similar variations in the first and second layers. Now, we describe these variations from North to South, and for each section. In July 1999 and 2001, a strong westward current ex- ists in the first and second layers from kilometer 80 unto kilometer 150. From then on to kilometer 300, the cur- rents are eastward, and finally they are westward near the Moroccan shore. In November 2000, the westward and then eastward flows are nearly absent between kilometers 80 and 200. Then, as in the previously described sections, the current is eastward up to kilometer 300 and finally westward. In July 2000, there are again some similarities between layers 1 and 2, but the transport pattern is different from that of the three other sections. The eastward transport globally increases up to kilometer 200 and then de- creases towards the Moroccan shore. Substantial local variations of this transport (i.e. strong local currents) are observed. Therefore, the circulation is rather cyclonic in the center of the Gulf of Cadiz in July 1999, November 2000 and July 2001; it is weakly anticyclonic in July 2000. We attribute this difference to the presence of a large meddy, with a fairly barotropic velocity signature, in the center of the Gulf, in July 2000. The cyclonic circulation in the Gulf of Cadiz has been observed by several other cruises, float trajectories or model outputs at the regional scale (see for instance [6,7, 9,11,12]) and thus, seems to be the most frequent situa- tion. The transports in July 1999 experiments are larger than those computed for the other cruises, principally in the second layer and at the middle of the section, due to the presence of a coupled eddy pair (cyclone + meddy). Thus, between the cyclone and the meddy, the eastward transports of the southern side of the cyclone added to the northern side of the meddy yield the 14 Sv cumula- tive transport observed at the middle of the section. Also, C opyright © 2011 SciRes. IJG  447 J. M. R. ALVES ET AL. (a) Copyright © 2011 SciRes. IJG 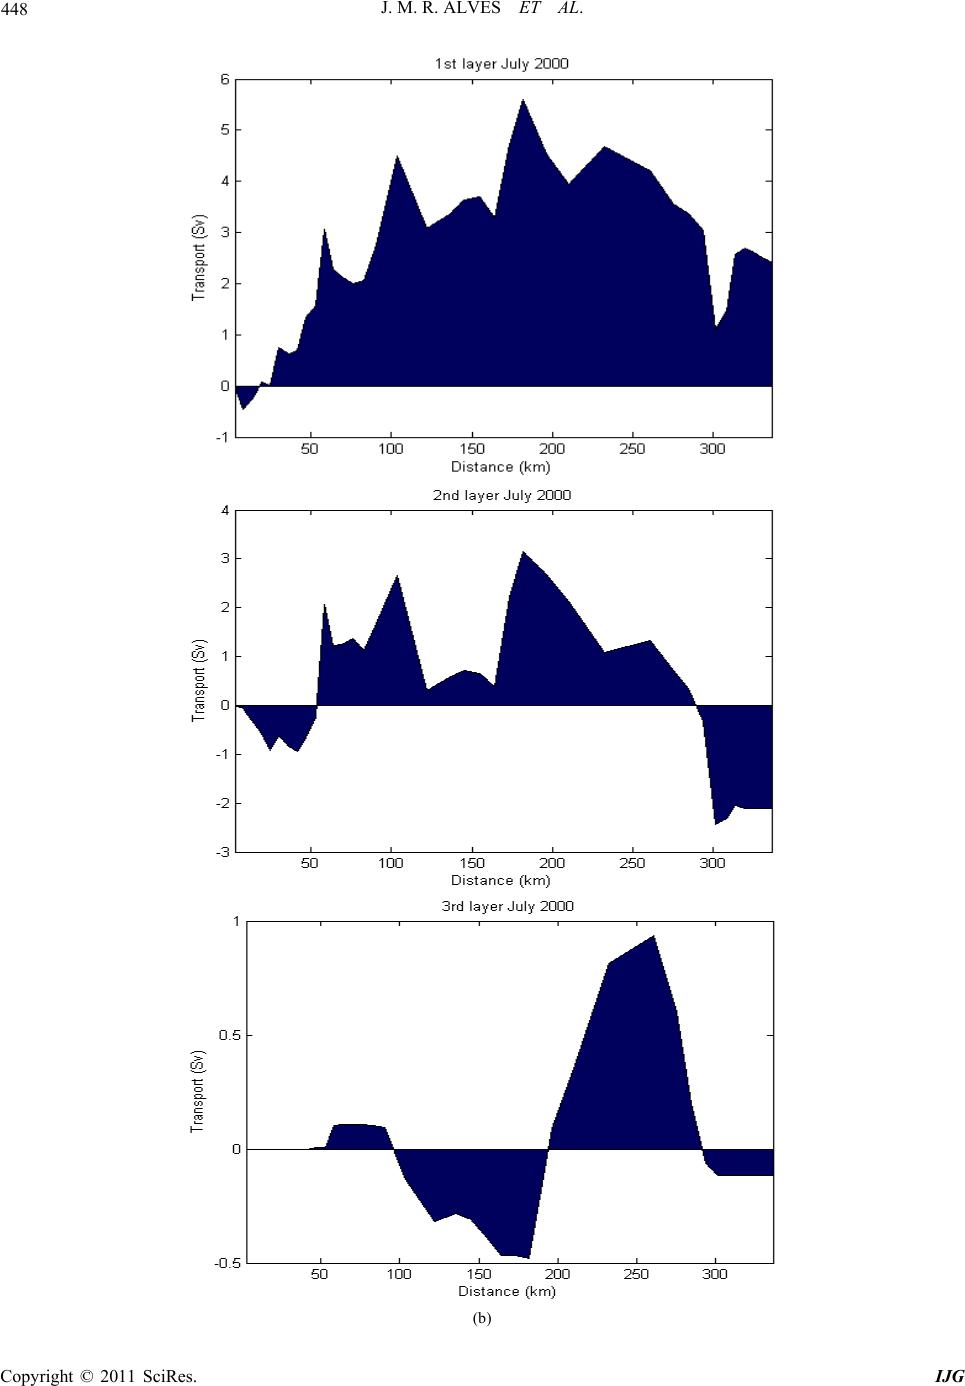 448 J. M. R. ALVES ET AL. (b) C opyright © 2011 SciRes. IJG 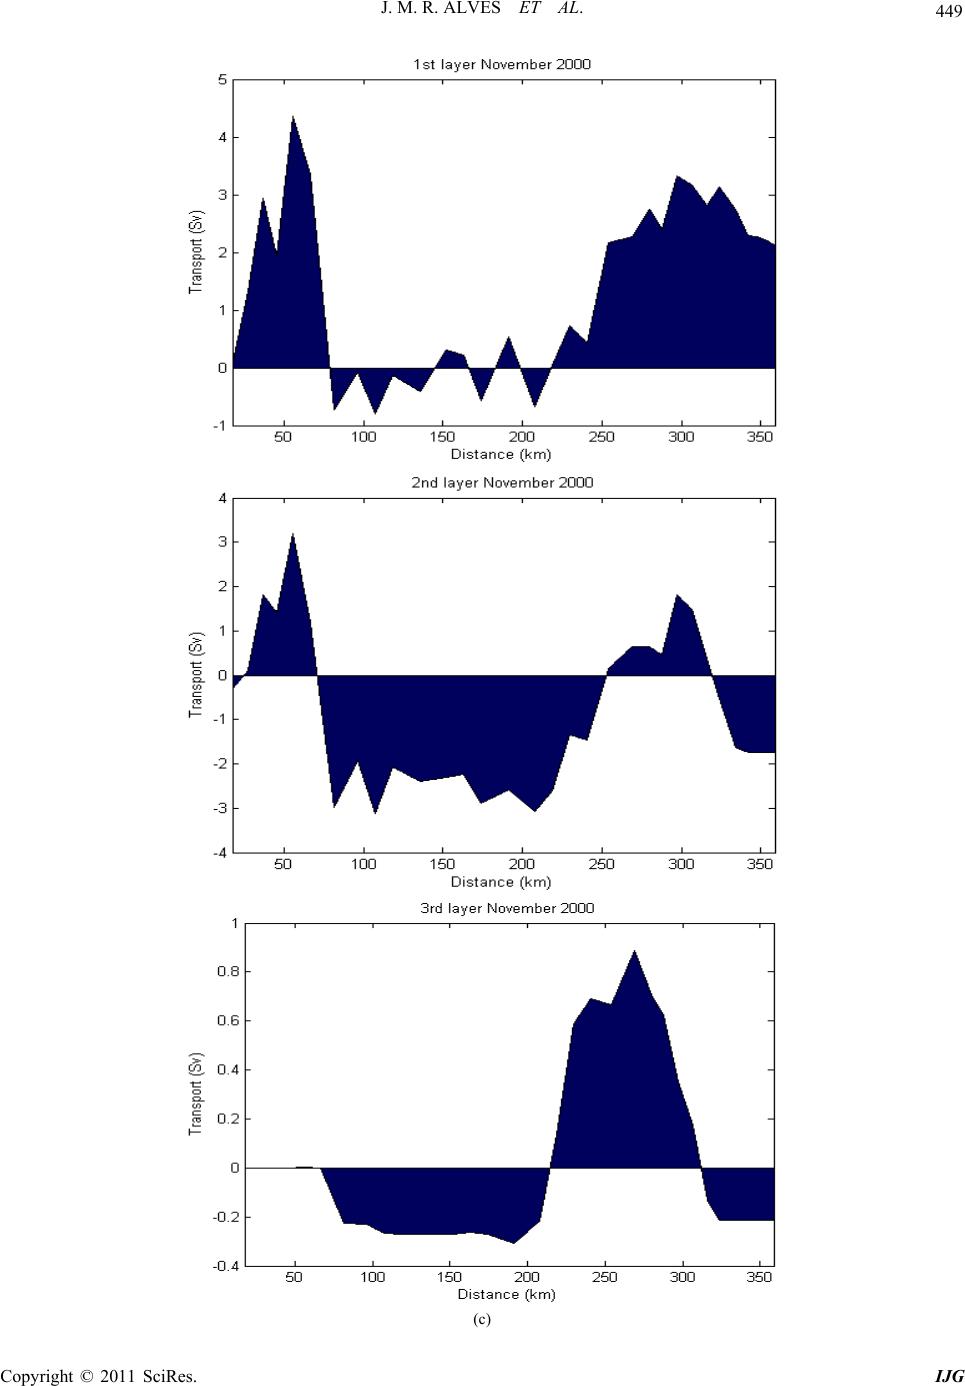 449 J. M. R. ALVES ET AL. (c) Copyright © 2011 SciRes. IJG 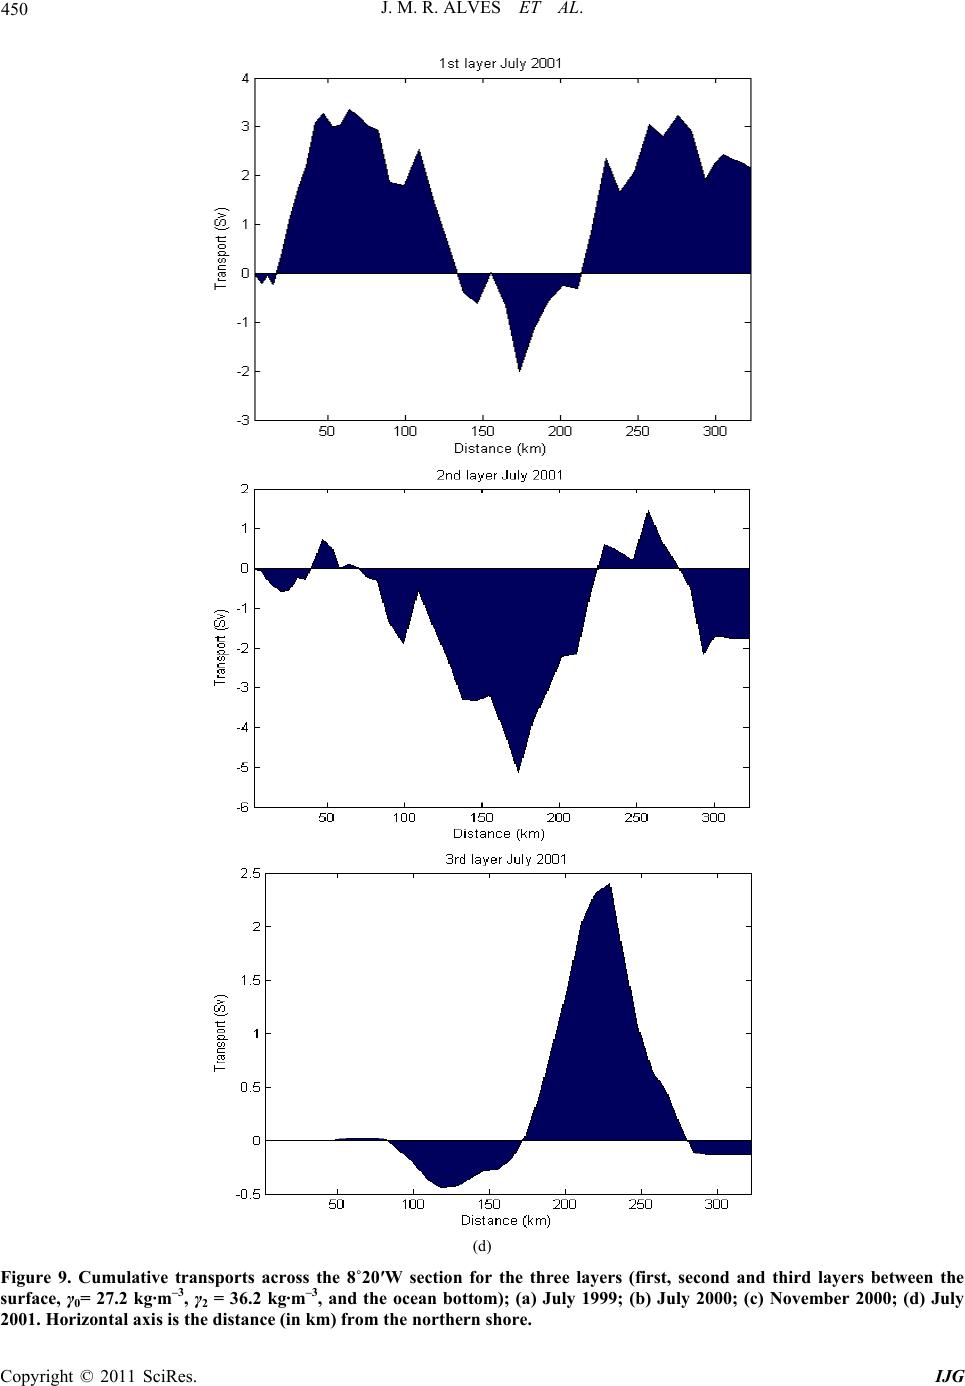 450 J. M. R. ALVES ET AL. (d) Figure 9. Cumulative transports across the 8˚20′W section for the three layers (first, second and third layers between the surface, γ0= 27.2 kg·m–3, γ2 = 36.2 kg·m–3, and the ocean bottom); (a) July 1999; (b) July 2000; (c) November 2000; (d) July 2001. Horizontal axis is the distance (in km) from the northern shore. C opyright © 2011 SciRes. IJG  J. M. R. ALVES ET AL. Copyright © 2011 SciRes. IJG 451 the transports associated with the cyclone are 50% stronger than those associated with the meddy (due to the faster velocities and to the larger extent of the cyclone). This is in agreement with the L_ADCP velocities. In July 2000, the northern continental slope current is enclosed in a very narrow region. Comparing it with the thermohaline sections (Figures 4 and 5) shows that the thermohaline anomaly associated with the lower MW core is larger than the width of the westward currents. This could indicate a horizontal recirculation of part of the MW south of the slope current. In the deepest layer (between isopycnal 2 = 36.90 kg·m–3 and the seafloor) in July 2000, November 2000 and July 2001, an eastward transport is seen in the north- ern part and a westward transport in the southern part, corresponding to a deep anticyclonic circulation. Instead, in July 1999, the deep circulation was reversed with a westward current in the northern part and an eastward flow in the southern part, corresponding to a cyclonic circulation. This anomaly may be related to the presence of the intense cyclone in the Gulf or to the general circu- lation in the Northeastern Atlantic Ocean. We compare the cumulative transports of the four ex- periments in Figure 10. In the first layer the eastward transports range between 1.93 Sv in July 1999 and 2.39 Sv in July 2000; in the second layer the westward trans- ports range between 1.69 Sv in July 1999 and 2.07 Sv in July 2000 and in the third layer the westward transports vary between 0.07 Sv in July 1999 and 2001 and 0.20 Sv in November 2000. The difference between the first and second layer transports at 8˚20′W (which is much larger than the 0.04 Sv difference between the first and third layers at 6˚15′W closer to the Straits of Gibraltar), and the conversion of transports from the third layer near the Straits of Gibraltar to the second layer at 8˚20′W show that strong vertical fluxes take place. These fluxes are diapycnic, related to the entrainment and mixing of water masses into the MW outflow. The diapycnal fluxes from the first to the second layer vary between 1.21 Sv in July 1999 and 1.67 Sv in July 2000, much stronger than those between the second and third layers that have a maxi- mum of only 0.61 Sv (in July 2001). This corresponds to the strong entrainment of NACW into MW as this latter cascades and progresses in the eastern part of the Gulf of Cadiz. Sensitivity studies were performed by varying the ini- tial guesses for transports at 8˚20′W, or the standard de- viations, in the inverse model. These studies showed that the values of the transports can change somewhat with the change of the imposed constraints, but never the di- rections of the transports. So the direction of the trans- ports denotes a fairly invariant general circulation pattern in the Gulf of Cadiz (except in the presence of very large and intense mesoscale eddies in the middle of the Gulf). 4. Conclusions The MW outflow is a deep current with 13˚C tempera- ture and 38.2 salinity along the northern part of the Straits of Gibraltar, which evolves into three undercur- rents on the Iberian continental slope, as seen in the 35˚50′N and 8˚20′W sections, with a strong decrease in salinity just after the Straits of Gibraltar. On the 8˚20′W section, a cyclone and a meddy were observed as well as smaller fragments, in July 1999; an intense meddy was observed in July 2001; in 2000, lens-like anomalies were also present, but with weaker thermohaline anomalies. In July 2000, a meddy was observed west of this section near 35˚05′N. In the Gulf of Cadiz, the warm and salty MW is also present as a tongue between 1000 and 1500 m depths with weaker temperature and salinity than in the undercurrents or eddies. Comparing the salinity and potential temperature dis- tributions with the L_ADCP sections, westward strong velocities are associated with the undercurrents on the Iberian continental slope, as expected. At the lower MW core level, the thermohaline anomalies are slightly wider than the horizontal extent of the westward velocities as- sociated with the slope current. The southern edge of this region corresponds to an eastward current; MW escapes from the slope current and returns eastward; this recircu- lation could be caused by the Portimão canyon located 20 km downstream of the 8˚20′W section. Potential vor- ticity gradients have reversals in sign (not shown), which allow barotropic or baroclinic instability of the under- currents. The Portimão canyon is a well-known site of meddy and MW cyclone generation ([13-15]). These eddies often recirculate cyclonically in the Gulf, due to cyclone-meddy pairing, and thus contribute both to the regional-scale circulation in this layer, and to the pres- ence of the MW tongue, via diffusion. South of the Ibe- rian continental slope, the currents associated with the MW tongue are much weaker, less than 0.05 m·s–1, most often in the same direction as in the NACW layer. Faster velocities (on the order of 0.15 to 0.25 m·s–1) are found where MW eddies are observed. For the NACW layer, the cyclonic recirculation is due to the fact that the area of the Strait of Gibraltar section is only 3% of the area of the 8˚20′W section; this implies that only a small percentage of the NACW will enter the Straits of Gibraltar. In the same way, only a fraction of the water in the MW layer comes directly from the Straits of Gibraltar. Therefore, we must observe westward currents in the NACW layer and eastward currents in the MW one; this was verified with the L_ADCP sections, and in the 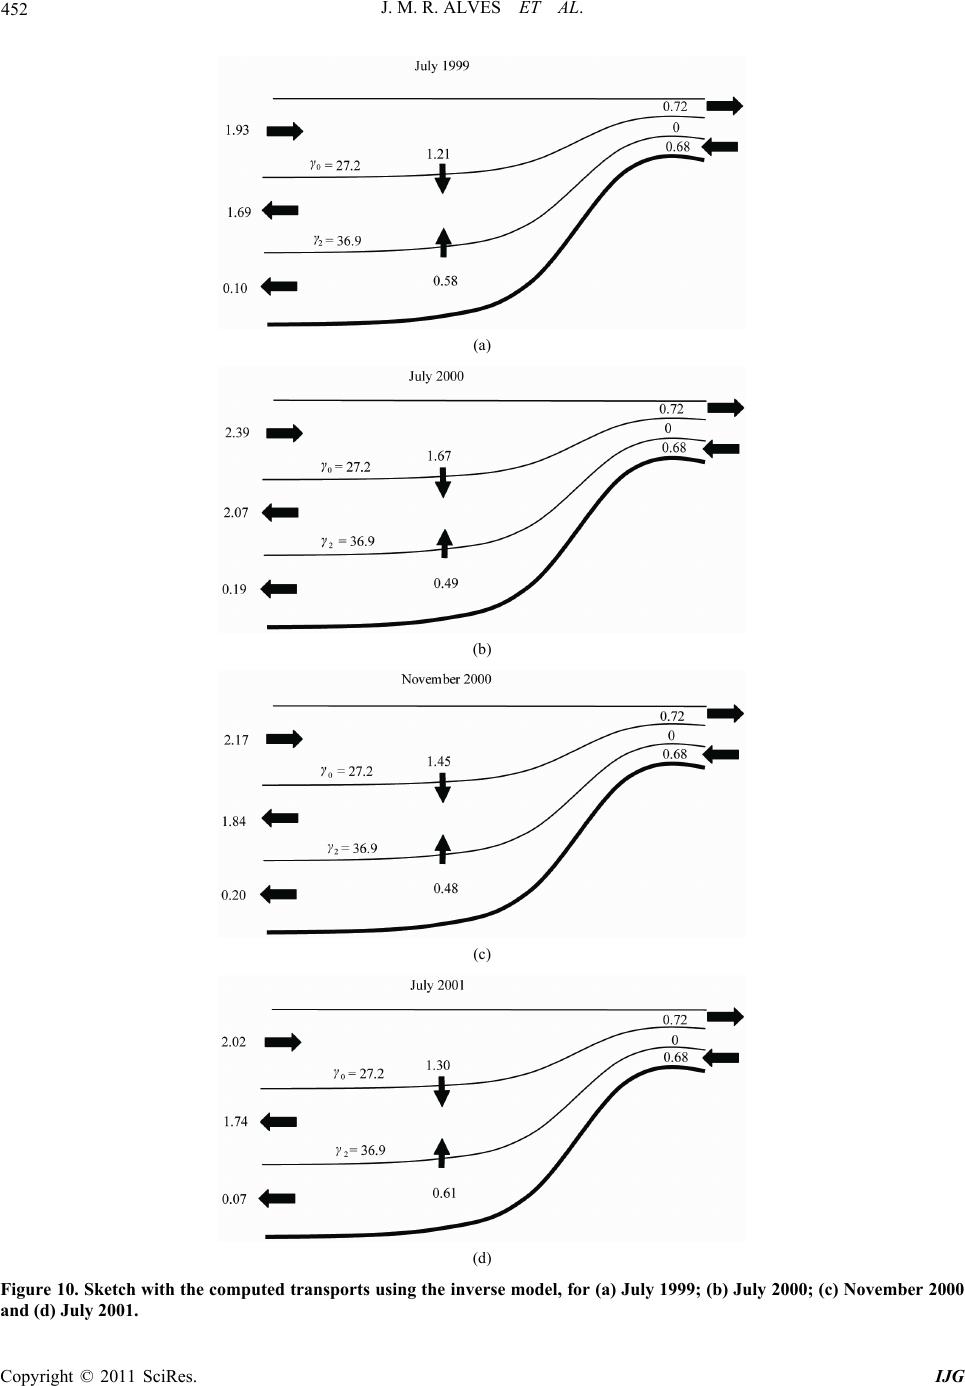 452 J. M. R. ALVES ET AL. (a) (b) (c) (d) Figure 10. Sketch with the computed transports using the inverse model, for (a) July 1999; (b) July 2000; (c) November 2000 nd (d) July 2001. a C opyright © 2011 SciRes. IJG  J. M. R. ALVES ET AL. 453 transports obtained from the inverse model. 9, and in r Michel Arhan for his con- “Influence de la topographie de fond sur In the L_ADCP sections, principally in 199 th Wat e transports, we also observed horizontal recirculation in the deepest layer (below 2500 m), anticyclonic in July 2000, November 2000 and July 2001 and cyclonic in July 1999. Indeed, the bottom topography forces NADW to recirculate since it cannot enter the Straits of Gibraltar. The local transport in this deep circulation can reach about 2.5 Sv, but the cumulative transports across the Gulf of Cadiz are very small. The reverse direction of the deep circulation in July 1999 could be related with the presence of the intense cyclone, or with the general cir- culation in the eastern Atlantic, which is beyond the scope of this paper. The horizontal transports along the 8˚20′W section and the diapycnal fluxes between layers obtained by the in- verse model had always the same direction in all sensi- tivity tests. In the large-scale circulation, an eastward flow in the southern part and a westward flow in the northern part of the Gulf of Cadiz are found in the first and second layers (see also [6,11,16]). The cumulative transports in the Gulf of Cadiz are eastward in the first layer, westward in the second layer and close to zero in the third layer. The diapycnal fluxes converge from the first and third layers to the second one, the former being larger. Therefore, this study confirms that MW leaving the Gulf of Cadiz entrains a substantial amount of NACW and some NADW, that there is also a noticeable recirculation in the Gulf in all layers, and that part of this recirculation is related to mesoscale eddies. Seasonal and inter-annual variabilities will be better evaluated when more winter measurements and more years of data will be available. . Acknowledgements 5 he authors wish to thank DT tribution to this study and Dr Jerome Paillet for design- ing these hydrological sections. The Captain and crew of RV D’Entrecasteaux and the SHOM center of oceanog- raphy are thanked for providing and processing the data. . References 6 1] F. Madelain, [ l’ecoulement mediterraneen entre le detroit de Gibraltar et le cap Saint Vincent,” Cahiers Oceanographiques, Vol. 22, 1970, pp.43-61. [2] C. Mauritzen, Y. Morel and J. Paillet, “Mediterranean er Influence on the Central Waters of the North At- lantic Ocean,” Deep Sea Research Part I: Oceanographic Research Papers, Vol. 48, No. 2, 2001, pp. 347-381. doi:10.1016/S0967-0637(00)00043-1 terranean Outflow—II. The Deep Circulation in the cinity of the Gulf of Cadiz,” Deep Sea Research, Vol. No. 5, 1979, pp. 555-568. [3] I. Ambar and M. R. Howe, “Observations of the Medi- Vi- 26, e Gulf of Cadiz Slope Current,” [4] N. Daniault, J. P. Maze and M. Arhan, “Circulation and Mixing of the Mediterranean Water West of the Iberian Peninsula,” Deep Sea Research, Vol. 14, 1994, pp. 1685- 1714. [5] J. Ochoa and N. A. Bray, “Water Masses Exchange in the Gulf of Cadiz,” Deep Sea Research, Vol. 38, Suppl. 1, 1991, pp. S465-S503. [6] A. Peliz, P. Marchesiello, A. M. P. Santos, J. Dubert, A. Teles-Machado, M. Marta-Almeida and B. Le Cann, “Surface Circulation in the Gulf of Cadiz: 2. Inflow-Out- Flow Coupling and th Journal of Geophysical Research, Vol. 114, No. 3, 2009, pp. 1-16. doi:10.1029/2008JC004771 [7] X. Carton, L. Cherubin, J. Paillet, Y. Morel A. Serpette and B. Le Cann, “Meddy Coupling with a Deep Cyclone in the Gulf of Cadiz,” Journal of Marine Systems, Vol. 32, No. 1-3, 2002, pp. 13-42. doi:10.1016/S0924-7963(02)00028-3 [8] A. S. Bower, L. Armi and I. Ambar, “Lagrangian Obser- vations of Meddy Formation during A Mediterranean Undercurrent Seeding Experiment,” Journal of Oceanography, Vol. 27, No. 12, 1997, Physical pp. 2545-2575. doi:10.1175/1520-0485(1997)027<2545:LOOMFD>2.0. CO;2 [9] I. Ambar, N. Serra, F. Neves and T. Ferreira, “Observa- tions of the Mediterranean Undercurrent and Eddies i the Gulf of Cadiz during 2001,” Journal of Marine Sys tems, V n - ol. 71, No. 1-2, 2008, pp. 195-220. doi:10.1016/j.jmarsys.2007.07.003 [10] H. L. Bryden, J. Candela and T. H. Kinder, “Exchange through the Straits of Gibraltar,” Progress in Oceanog- raphy, Vol. 33, No. 3, 1994, pp. 201-248. doi:10.1016/0079-6611(94)90028-0 sical Research, /2007JC004159 [11] A. Peliz, J. Dubert, P. Marchesiello and A. Teles- Machado, “Circulation in the Gulf of Cadiz: Model and Mean Flow Structure,” Journal of Geophy Vol. 112, 2007, C11015. doi:10.1029 10, [12] X. Carton, N. Daniault, J. Alves, L. Cherubin and I. Am- bar, “Meddy Dynamics and Interaction with Neighboring Eddies Southwest of Portugal: Observations and Model- ing,” Journal of Geophysical Research, Vol. 115, 20 C06017. doi:10.1029/2009JC005646 [13] L. Cherubin, X. Carton, J. Paillet, Y. Morel and A. Ser- pette, “Instability of the Mediterra-Nean Water Under- currents Southwest of Portugal: Effects of Baroclinicity and of Topography,” Oceanologica Acta, Vol. 23, No. 5, 2000, pp. 551-573. doi:10.1016/S0399-1784(00)01105-1 [14] N. Serra and I. Ambar, “Eddy Generation in the Mediter- ranean Undercurrent,” Deep Sea Research, Vol. 49, No. 19, 2002, pp. 4225-4243. doi:10.1016/S0967-0645(02)00152-2 [15] N. Serra, I. Ambar and R. H. Kase, “Observations and Numerical Modeling of the Mediterranean Outflow Split- Copyright © 2011 SciRes. IJG  J. M. R. ALVES ET AL. 454 ,” Deep Sea Research Part II . 52, No. 3-4, 2005, ting and Eddy Generation Topical Studies in Oceanography, Vol : pp. 383-408. doi:10.1016/j.dsr2.2004.05.025 [16] L. Lamas, A. Peliz, I. Ambar, A. Barbosa Aguiar, N. Maximenko and A. Teles-Machado: “Evidence of Time- mean Cyclonic Cell SW of Iberian Peninsula: The Medi- terranean Outflow-Driven Beta-Plume,” Geophysical Re- search Letters, Vol. 37, 2010. L12606. doi:10.1029/2010GL043339 Appendix: The Meddy of July 2000 ˚N on the ˚20′W section, a complementary section, perpendicular y; this buoy was connected to a holey- so mately the same period (9 days). This corresponds to a 0.12 m·s–1 velocity in the first case and a doubled value In view of the thermohaline anomaly near 35 8 to the latter, was achieved along 35˚05′N, from 8˚05'W to 9˚08′W. The temperature and salinity maps shown in Figure A1 indicate that the meddy core had T = 13˚C and S = 36.6. But this core is narrow, which explains why it was not sampled on the 8˚20′W section. The zonal extent of the meddy, based on isohaline 36, is clearly larger than 100 km. This value is compatible with the 120 km meridional extent of its salinity signature on the 8˚20′W section. A Surdrift (surface drifting) buoy was released in the core of this medd ck drogue at 900 m depth via a 3 mm thick kevlar ca- ble. Figure A2 indicates that this buoy first performed two anticyclonic loops with about 30 km diameter, then three loops with about 60 km diameter, and approxi- (0.24 m·s–1) in the second case. One must note that hy- drodynamic drag is exerted on the kevlar cable so that these values bear a 30% uncertainty (see [7]). Neverthe- less, the 0.12 m·s–1 velocity is compatible with the L_ADCP measurements. The second value (0.24 m·s–1) is not compatible with these measurements; it could be explained by a merger of this meddy with another one, initially lying west of it. This would explain both the increase in rotational kinetic energy and the sudden dou- bling of the loop diameter. The westward meddy motion is also seen to accelerate as the loop diameter increases. The buoy was finally ejected from the meddy and drifted southward for a month with an average velocity of 0.08 m·s –1. The buoy mission was terminated as its strong acceleration indicated a loss of the deep drogue. It was close to the Moroccan continental slope then. C opyright © 2011 SciRes. IJG 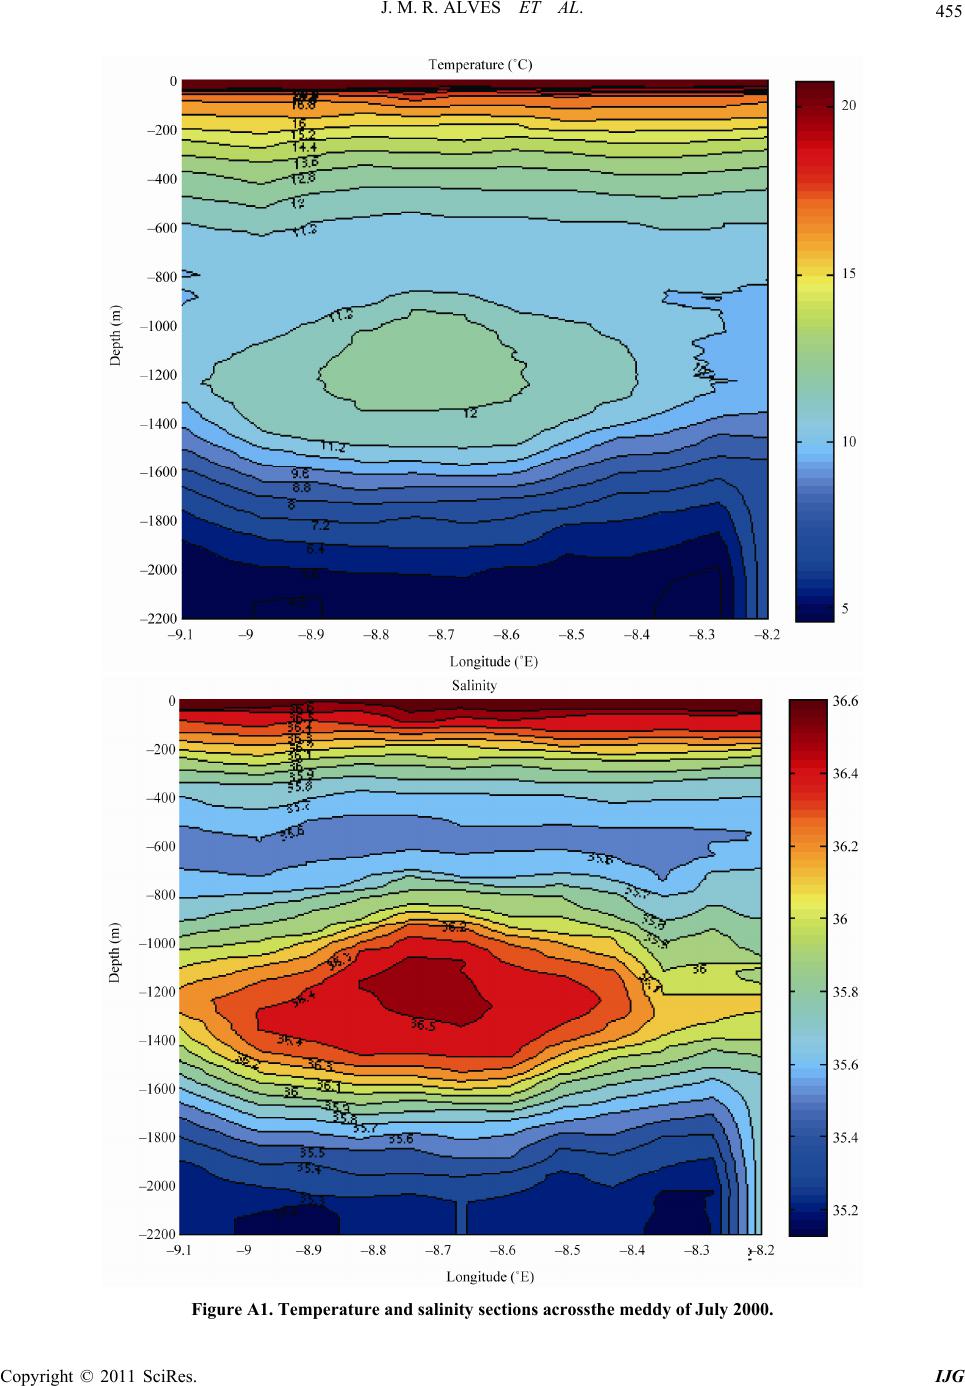 455 J. M. R. ALVES ET AL. Figure A1. Temperature and salinity sections acrossthe meddy of July 2000. Copyright © 2011 SciRes. IJG 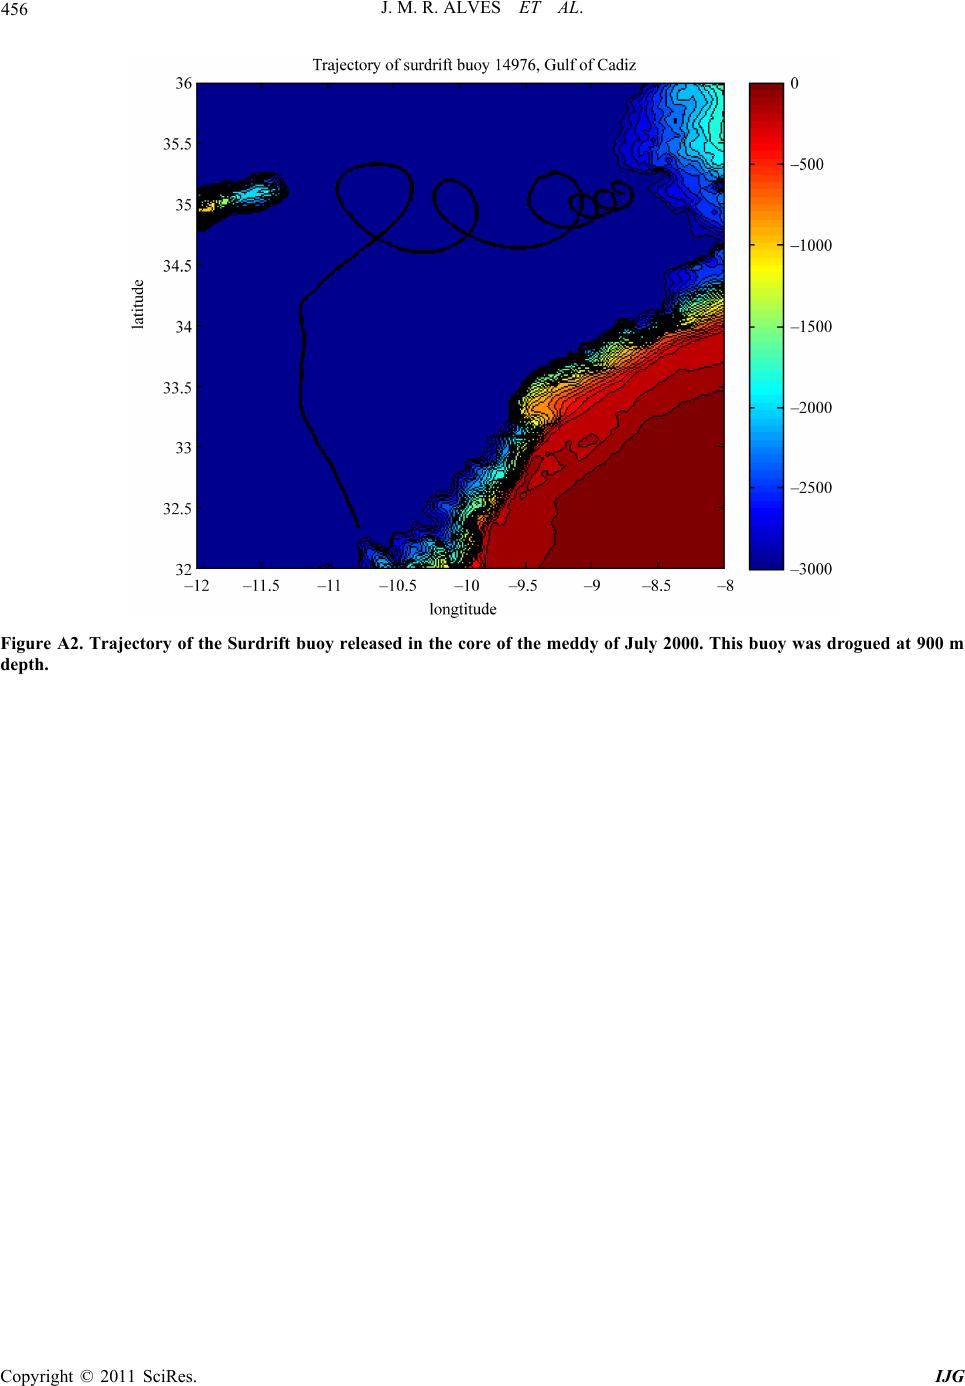 456 J. M. R. ALVES ET AL. Figure A2. Trajectory of the Surdrift buoy released in the core of the meddy of July 2000. This buoy was drogued at 900 m depth. C opyright © 2011 SciRes. IJG
|