 American Journal of Plant Sciences, 2011, 2, 569-577 doi:10.4236/ajps.2011.24068 Published Online October 2011 (http://www.SciRP.org/journal/ajps) Copyright © 2011 SciRes. AJPS 569 Morphological and Physiological Responses of Weedy Red Rice (Oryza sativa L.) and Cultivated Rice (O. sativa) to N Supply Marites A. Sales1, Nilda R. Burgos2, Vinod K. Shivrain2, Brad Murphy4, Edward E. Gbur, Jr.5 1Department of Plant Pathology, University of Arkansas, Fayetteville, USA; 2Department of Crop, Soil and Environmental Sciences, University of Arkansas, Fayetteville, USA; 3Syngenta Crop Protection, Vero Beach, FL, USA; 4Department of Horticulture, Univer- sity of Arkansas, Fayetteville, USA; 5Agricultural Statistics, University of Arkansas, Fayetteville, USA. Email: nburgos@uark.edu Received April 13th, 2011; revised May 28th, 2011; accepted August 25th, 2011. ABSTRACT Red rice (Oryza sativa L.), a noxious weed in rice production, competes with cultivated rice for nutrients. Accumulation of more N in red rice than in cultivated rice may be due to a mechanism different from that of cultivated rice. To test this assumption, red rice and cultivated rice were grown in nutrient solution to compare their growth and physiological responses to N supply. Experimental design was a split-plot, where main plot factor was rice type (Stf-3, ‘Wells’); split-plot factor was N treatment [T1 (complete nutrient solution); T2 (–NH4NO3); T3 (+NH4NO3 for 24-h post-N defi- ciency); and T4 (+NH4NO3 for 48-h post-N deficiency)]. Nitrogen deficiency was defined as N sufficiency index (NSI) < 95%. Height, tiller number, biomass, and root morphology were monitored to determine morphological responses. Stf-3 red rice had significantly greater growth measurements than Wells in terms of shoot and root characteristics. At T4, Stf- 3 showed higher increment in root length and surface area than Wells. Shoot tissue concentrations of N and total sug- ars were measured to determine physiological response in N-deficient and N-supplemented plants. Stf-3 had greater N and sucrose tissue concentrations at N-deficient conditions compared with Wells, implying a stress-adaptive molecular mechanism regulated by N and sucrose availability. Keywords: Hydroponics, Nitrogen Concentration, N Uptake, Rice (Oryza Sativa L.), Root Morphology, Sucrose Concentra tion, Sugars 1. Introduction Rice is a staple food for more than half of the world’s population. The United States produces less than 2% of the volume of world rice production, but is a major rice exporter, providing 12% - 14% of the annual volume of the global rice trade [1]. Arkansas is the largest rice- growing state, containing over 45% of U.S. rice acreage, according to the USDA National Agricultural Statistics Service. A major challenge facing rice producers in the southern U.S. is weed competition. Red rice, a weedy rice relative belonging to the same genus and species as the cultivated rice (Oryza sativa) is one of the most dif- ficult weed species to control because of its similarity to the crop [2]. About 60% of the rice fields in Arkansas are infested by red rice [3]. Red rice has a competitive ad- vantage over cultivated rice because it grows taller and faster, and tillers profusely, thus depriving cultivated rice of necessary nutrients, light and space owing to its height and massive root system. Under non-competitive condi- tions, red rice produces almost double the grain yield of commercial cultivars [4]. When competing with culti- vated rice, one red rice plant·m–2 reduced yield of ‘New- bonnet’ rice, a tall cultivar by 219 kg·ha–1 [5]. Red rice caused an estimated loss of $ 275 ha–1 in 2006 alone [3]. These economic losses include damaging effects of plant lodging and price docking of rice grains contaminated with red rice kernels. In addition, red rice uptake of even half of the optimum fertilizer N requirement for rice cul- tivars, estimated at 200 kg·N·ha–1 in the southern U.S. [6], is enough to drastically reduce rice yields and the eco- nomic benefits of N fertilization. Red rice accumulated more fertilizer N and produces more biomass than ‘Drew’ rice under field conditions, suggesting that it could have higher yields even in low N supply [7]. The  Morphological and Physiological Responses of Weedy Red Rice (Oryza sativa L.) 570 and Cultivated Rice (O. sativa) to N Supply implied tolerance to N-deficient conditions in weedy red rice is a trait that would be of agronomic importance in cultivated rice. Nitrogen is the most important inorganic macronutri- ent and is a limiting factor in crop productivity. It is a major constituent of proteins, cofactors, and secondary metabolites [8], and thus affects all levels of plant func- tion [8-10]. Plants contain 1% - 6% N by weight and absorb N as both nitrate (3 NO ) and ammonium (), depending on plant age and type, environment, and other factors [11]. Before can be used in the plant, it must be reduced to or ammonia (NH3). The NH3 produced is assimilated into amino acids that are subse- quently combined into proteins and nucleic acids. Nitro- gen is also an integral part of chlorophyll needed for photosynthesis [12], so high photosynthetic activity, vig- orous vegetative growth, and a dark green color are indi- cators of adequate N supply. Plants regulate photosyn- thesis to balance the flow of C through an optimized dis- tribution of its N resources [13]. The profound effect of N supply on overall plant growth and development is modulated by C status [14], and most likely, cross-talk with other factors, such as hormones, cytokinins and ab- scissic acid [15]. Nitrogen deficiency, therefore, affects other metabolic pathways. + 4 NH 3 + 4 NO NH In recent years, elucidating plant response to stress has been facilitated by investigations at the cellular level. One morphological adaptation to nutrient deficiency is alteration of root architecture, such as increased number and length of root hairs to reach a wider area of the en- vironment and, consequently, increase nutrient acquisi- tion [8]. Molecular analyses have also revealed other phenotypic expressions of nutrient stress adaptation, such as increased densities of transport molecules to enhance nutrient utilization [16], release of plant compounds to increase bioavailability of soil nutrients [17,18], and en- hanced nutrient uptake capacities regulated at the level of membrane transport [19-21]. General response systems to nutrient stress involve use of stored polysaccharides or recycling of cellular components to prevent severe defi- ciencies in respiratory substrates and maintain important biochemical pathways [22-24]. A degradative process known as vacuolar autophagy was induced by starch starvation in maize [25,26] and rice [27] and would be a likely process in any stress response pathway which uses starch as a precursor. Alteration in carbohydrate metabo- lism in response to N also indicates changes in the flux of soluble sugars in the plant. Removing weeds from the paddy field increases the amount of N in the rice plant [28]. Plant density is an important factor in competition because it is inversely related to resources available to the plant [29]. When cultivated rice was planted with red rice at varying densi- ties, only rice cultivars with comparatively high tillering capacity, leaf area and dry stem weight could compete very well with red rice [30,31]. Since red rice has mor- phological and physiological features that suggest com- petitive advantage over cultivated rice in adapting to N- poor conditions, it is expected to accumulate more N and produce more biomass compared with cultivated rice at low N conditions. Comparing morphological and physic- ological responses of weedy and cultivated rice types under N stress conditions is the first step towards eluci- dating adaptive mechanisms in red rice that are either absent or less efficient in the cultivated rice, hence, this study. 2. Materials and Methods 2.1. Plant Material Rice types compared were the tall, awnless, medium- grain red rice accession Stf-3 and ‘Wells’. Accession Stf-3 is a strawhull red rice collected from St. Francis County, Arkansas, USA. A strawhull red rice was se- lected because it is the most prevalent red rice type based on hull color, and is most similar to Wells rice in height at maturity [32]. Wells is a long-grain rice cultivar, which matures approximately 124 d after planting. Be- cause of its high milled rice yield, stable head rice yield, and tolerance to rice blast and sheath blight [33], Wells was planted in 31% of rice production areas in Arkansas by 2006, making it the rice cultivar of choice [34]. The second most popular cultivar was planted in only 13% of rice area. Seeds were surface-sterilized with 10% H2O2 for 10 min followed by 70% ethanol for 5 min, then washed thoroughly in sterile deionized water and germinated at 30˚C for 48 h in Petri dishes lined with moist filter paper. Uniformly germinated seeds were transferred into 6 cm diameter wells in black plastic trays (27 cm × 53 cm) (Pro-Tray, Hummert, MO, USA) fitted into 35-L plastic tubs (36 cm × 62 cm × 31 cm) (Multi-Reservoir, Ameri- can Agritech, AZ 85283, USA) containing aerated, de- ionized water until a week after germination when it was replaced with half-strength nutrient solution [35]. 2.2. Nutrient Solution The nutrient solution was composed of NH4NO3 (40 ppm), NaH2PO42H2O (10 ppm), K2SO4 (40 ppm), CaCl2 (40 ppm), Mg2SO47H2O (40 ppm), MnCl24H2O (0.5 ppm), (NH4)6Mo7O244H2O (0.05 ppm), H3BO3 (0.2 ppm), ZnSO47H2O (0.01 ppm), CuSO45H2O (0.01 ppm), FeCl36H2O + citric acid (monohydrate) (2 ppm), and Na2SiO35H2O (0.1 mM). Nutrient solution pH was Copyright © 2011 SciRes. AJPS 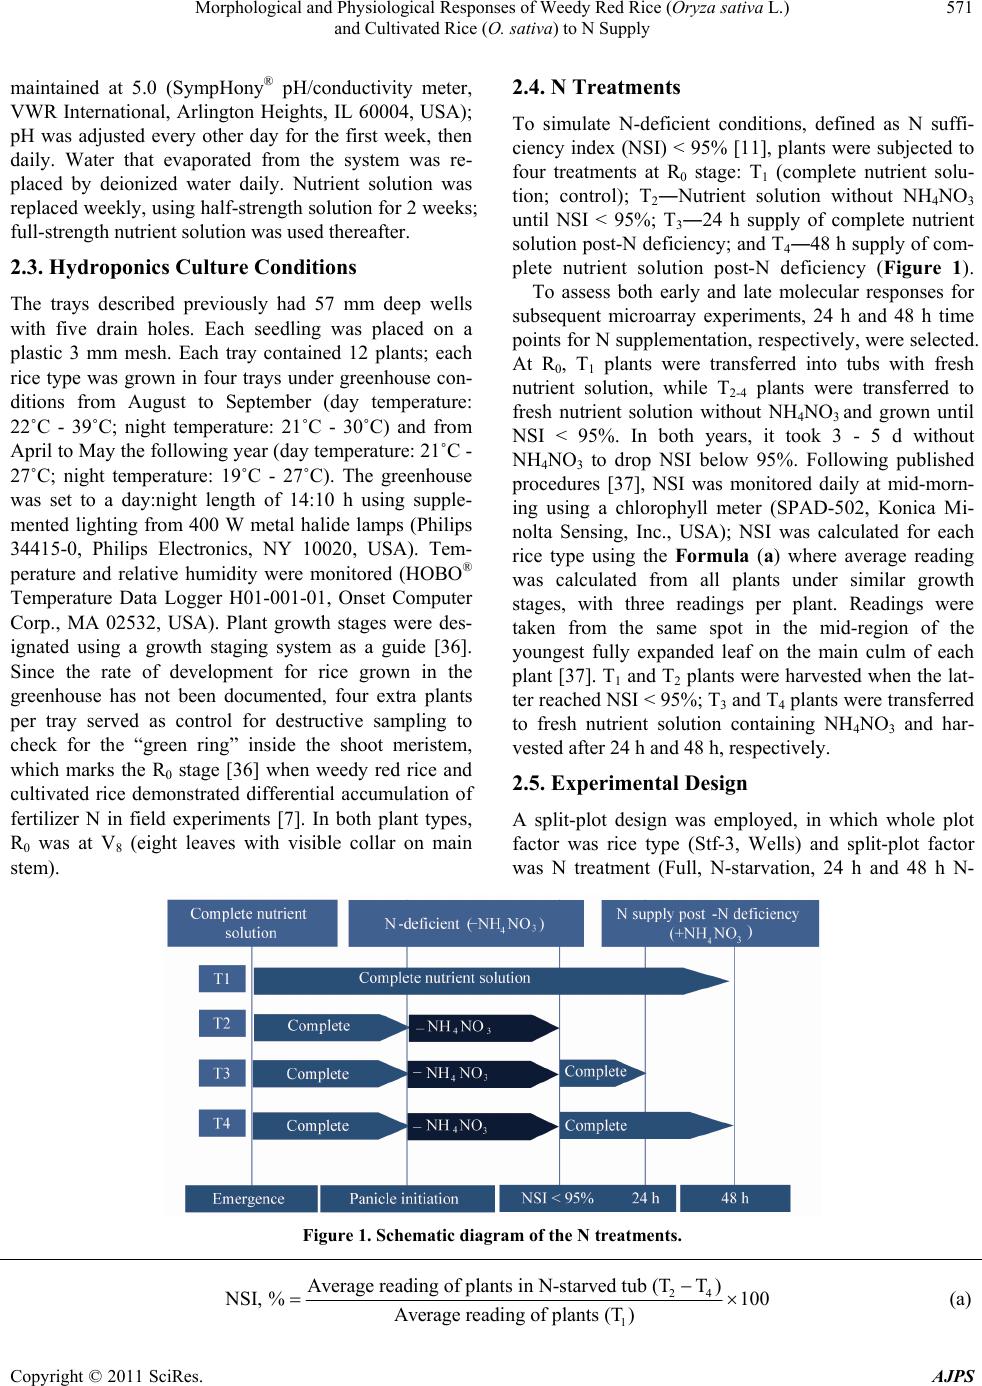 Morphological and Physiological Responses of Weedy Red Rice (Oryza sativa L.) and Cultivated Rice (O. sativa) to N Supply Copyright © 2011 SciRes. AJPS 571 2.4. N Treatments maintained at 5.0 (SympHony® pH/conductivity meter, VWR International, Arlington Heights, IL 60004, USA); pH was adjusted every other day for the first week, then daily. Water that evaporated from the system was re- placed by deionized water daily. Nutrient solution was replaced weekly, using half-strength solution for 2 weeks; full-strength nutrient solution was used thereafter. To simulate N-deficient conditions, defined as N suffi- ciency index (NSI) < 95% [11], plants were subjected to four treatments at R0 stage: T1 (complete nutrient solu- tion; control); T2―Nutrient solution without NH4NO3 until NSI < 95%; T3―24 h supply of complete nutrient solution post-N deficiency; and T4―48 h supply of com- plete nutrient solution post-N deficiency (Figure 1). 2.3. Hydroponics Culture Conditions To assess both early and late molecular responses for subsequent microarray experiments, 24 h and 48 h time points for N supplementation, respectively, were selected. At R0, T1 plants were transferred into tubs with fresh nutrient solution, while T2-4 plants were transferred to fresh nutrient solution without NH4NO 3 and grown until NSI < 95%. In both years, it took 3 - 5 d without NH4NO3 to drop NSI below 95%. Following published procedures [37], NSI was monitored daily at mid-morn- ing using a chlorophyll meter (SPAD-502, Konica Mi- nolta Sensing, Inc., USA); NSI was calculated for each rice type using the Formula (a) where average reading was calculated from all plants under similar growth stages, with three readings per plant. Readings were taken from the same spot in the mid-region of the youngest fully expanded leaf on the main culm of each plant [37]. T1 and T2 plants were harvested when the lat- ter reached NSI < 95%; T3 and T4 plants were transferred to fresh nutrient solution containing NH4NO3 and har- vested after 24 h and 48 h, respectively. The trays described previously had 57 mm deep wells with five drain holes. Each seedling was placed on a plastic 3 mm mesh. Each tray contained 12 plants; each rice type was grown in four trays under greenhouse con- ditions from August to September (day temperature: 22˚C - 39˚C; night temperature: 21˚C - 30˚C) and from April to May the following year (day temperature: 21˚C - 27˚C; night temperature: 19˚C - 27˚C). The greenhouse was set to a day:night length of 14:10 h using supple- mented lighting from 400 W metal halide lamps (Philips 34415-0, Philips Electronics, NY 10020, USA). Tem- perature and relative humidity were monitored (HOBO® Temperature Data Logger H01-001-01, Onset Computer Corp., MA 02532, USA). Plant growth stages were des- ignated using a growth staging system as a guide [36]. Since the rate of development for rice grown in the greenhouse has not been documented, four extra plants per tray served as control for destructive sampling to check for the “green ring” inside the shoot meristem, which marks the R0 stage [36] when weedy red rice and cultivated rice demonstrated differential accumulation of fertilizer N in field experiments [7]. In both plant types, R0 was at V8 (eight leaves with visible collar on main stem). 2.5. Experimental Design A split-plot design was employed, in which whole plot factor was rice type (Stf-3, Wells) and split-plot factor was N treatment (Full, N-starvation, 24 h and 48 h N- Figure 1. Schematic diagram of the N treatments. 24 1 Average reading of plants in N-starved tub (TT) SI, %100 Average reading of plants (T ) (a)  Current Distortion Evaluation in Traction 4Q Constant Switching Frequency Converters 572 readdition). There were four replications, with three plants per replication per N treatment. Randomization was constrained by the following: each rice type was placed at both sides of the greenhouse, on two benches; each N treatment was randomly assigned to a row of three plants within each tub. 2.6. Data Collection and Statistical Analyses To determine inherent morphological and growth rate differences between red rice and Wells rice, height and tiller number were measured weekly. After imposition of N treatments, biomass and root characteristics were re- corded at harvest. To determine biomass production, plant samples were separated into roots and shoots and oven-dried to a constant weight at 60˚C. Prior to oven- drying, root samples were gently washed with deionized water, blotted dry with paper towels, stained with me- thylene blue in 10% ethanol, and stored at 4˚C until scanned (Epson Twain Pro, Seiko Epson Corp., Japan) for length, surface area, average diameter and number of root tips. Scanned images were analyzed using Win- RHIZO 5.0 (Regent Ltd., Canada). To determine physiological responses at N stress, shoot tissue concentrations of total N and sugars were quantified. Concentrations of glucose, fructose, and su- crose in leaf tissue were analyzed because these would indicate changes in carbohydrate metabolism in response to imposed nutrient stress. To measure total N concentra- tion, shoots from one plant per replication were oven- dried as described for biomass determination, and their dry weights recorded prior to grinding in a rice mill (3383 L-10, Thomas Scientific, USA). Ground shoot tissues were analyzed for total N by the Dumas combus- tion method at the Agriculture Diagnostic Laboratory of the University of Arkansas, Fayetteville. To determine concentration of total sugars, youngest fully expanded leaves from one plant per replication were freeze-dried to a constant weight at –70˚C in a ly- ophilizer (Freezemobile 25SL, Virtis, USA) before grinding. Three 100 mg samples of ground tissue from each plant sample were then extracted for total sugars following a modified procedure [38]. Sugar extracts (1 mL) were analyzed for fructose, glucose and sucrose concentrations ([Fruc], [Glu] and [Suc]) by high per- formance liquid chromatography (Alliance 2690 Separa- tion Module, Waters, USA) using acetonitrile: 2-propa- nol:water (825:35:140) as solvent and passed through 250 mm × 2.0 mm columns (Phenosphere 5 μ NH2 col- umns, Phenomenex, CA 90501, USA) at a flow rate of 0.6 ml min–1 at 40˚C. Sugar concentrations were calcu- lated using the Formula (b) where 500 = factor for a 1 mL extraction volume. Data were subjected to analysis of variance using SAS® (v8.2, SAS Institute, Inc., Cary, NC, USA). When F-tests were significant, means were sepa- rated using Fisher’s protected LSD at a significance level of 0.05. 3. Results and Discussion 3.1. Developmental Differences between Rice Types The two rice types reached R0 within 2 d of each other. There was no difference in Year 1, but the time lag ex- tended to 2 d in Year 2. This year difference may be at- tributed to greenhouse temperatures, as experiments were established at different periods of the year. In general, indica varieties require higher minimum temperatures than japonica varieties [39-41]; red rice is an indica, while Wells is a japonica. Optimum germination of ja- ponica rice seeds is at a 20˚C day temperature, and at 30˚C - 35˚C day temperatures for an indica [42]. The optimum temperature range for photosynthesis in indica rice varieties was reported to be 25˚C - 35˚C, higher than that of japonica (18˚C - 33˚C) [43]. During vegetative growth, indica varieties were more sensitive to lower temperatures than japonica varieties when partial regres- sion of days to heading on mean temperatures was done [44-46]. Air temperature was the most important factor which affected yields of indica varieties, followed by day length [47]. Red rice ecotypes also differ in maturation period [32]. 3.2. Overview of Data Analysis Results There were significant differences in plant responses to N treatments between years, thus data were analyzed separately (Table 1). In Year 1, only shoot tissue [N] showed significant interaction effect of rice type and N levels. In Year 2, shoot tissue [N] and [Suc] as well as root length and surface area showed a strong evidence of rice type and N level interaction (Table 1). 3.3.Morphological Differences Aboveground traits. In both years, Stf-3 grew taller and produced more tillers than Wells under full N supply (Table 2). Rice type effect on shoot biomass production was evident only in Year 2, with Stf-3 producing more than Wells (Table 3). Aboveground morphological dif- ferences in the greenhouse reflected those in field condi- tions, where Stf-3 can grow up to 130 cm at flowering [4] hile Wells can be as tall as 100 cm at maturity [33]. w 1Total amount in a 2 μl injection500, μg Sugar concentration (μgg )Total weight of sample, g (b) Copyright © 2011 SciRes. AJPS 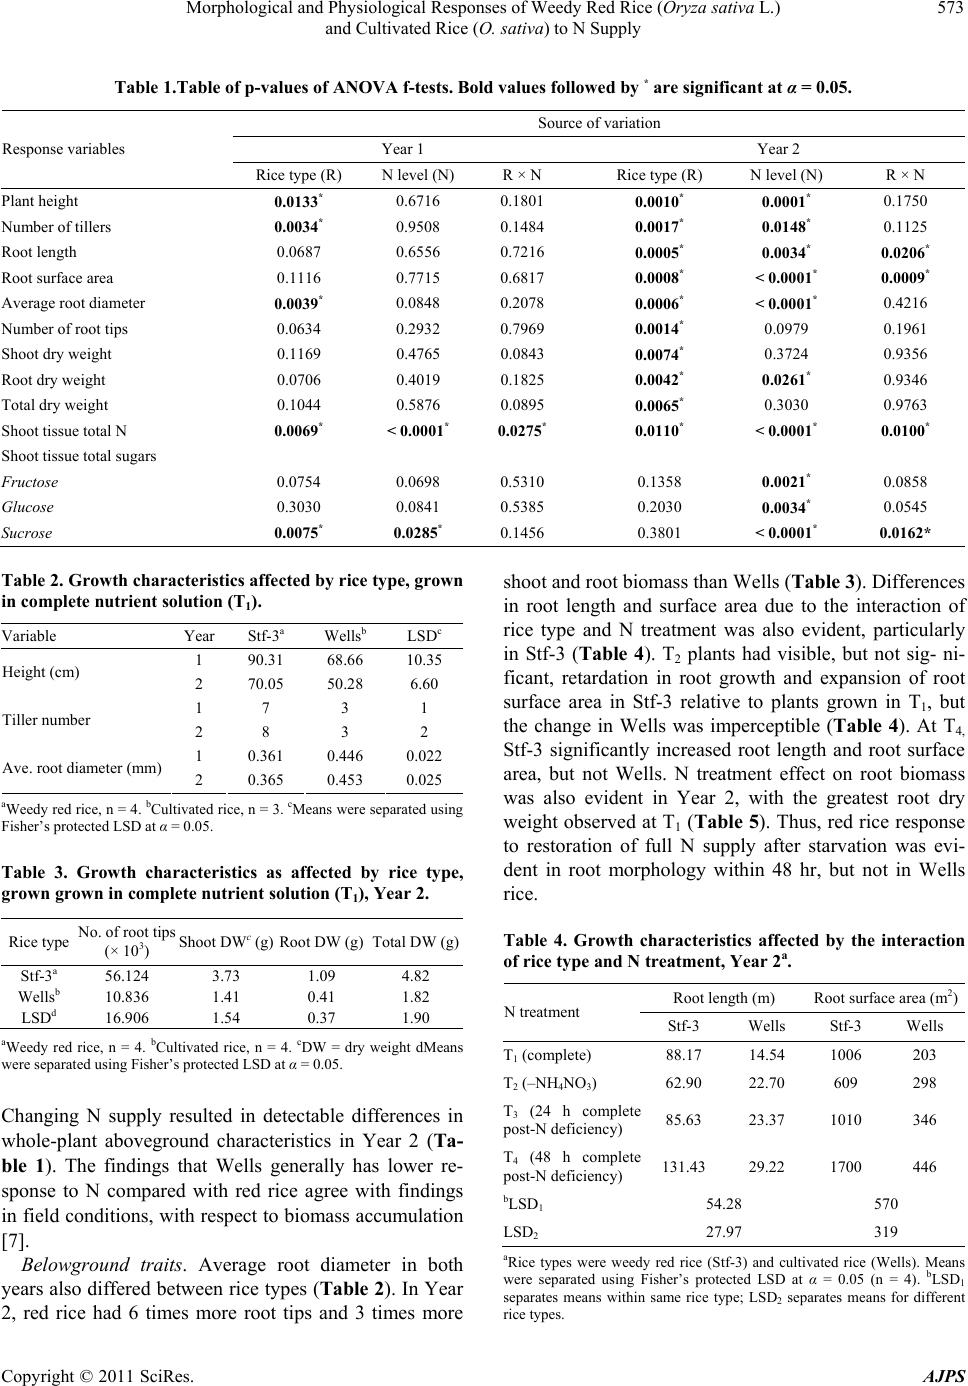 Morphological and Physiological Responses of Weedy Red Rice (Oryza sativa L.) and Cultivated Rice (O. sativa) to N Supply Copyright © 2011 SciRes. AJPS 573 Table 1.Table of p-values of ANOVA f-tests. Bold values followed by * are significant at α = 0.05. Source of variation Year 1 Year 2 Response variables Rice type (R) N level (N) R × N Rice type (R) N level (N) R × N Plant height 0.0133* 0.6716 0.1801 0.0010* 0.0001* 0.1750 Number of tillers 0.0034* 0.9508 0.1484 0.0017* 0.0148* 0.1125 Root length 0.0687 0.6556 0.7216 0.0005* 0.0034* 0.0206* Root surface area 0.1116 0.7715 0.6817 0.0008* < 0.0001* 0.0009* Average root diameter 0.0039* 0.0848 0.2078 0.0006* < 0.0001* 0.4216 Number of root tips 0.0634 0.2932 0.7969 0.0014* 0.0979 0.1961 Shoot dry weight 0.1169 0.4765 0.0843 0.0074* 0.3724 0.9356 Root dry weight 0.0706 0.4019 0.1825 0.0042* 0.0261* 0.9346 Total dry weight 0.1044 0.5876 0.0895 0.0065* 0.3030 0.9763 Shoot tissue total N 0.0069* < 0.0001* 0.0275* 0.0110* < 0.0001* 0.0100* Shoot tissue total sugars Fructose 0.0754 0.0698 0.5310 0.1358 0.0021* 0.0858 Glucose 0.3030 0.0841 0.5385 0.2030 0.0034* 0.0545 Sucrose 0.0075* 0.0285* 0.1456 0.3801 < 0.0001* 0.0162* Table 2. Growth characteristics affected by rice type, grown in complete nutrient solution (T1). Variable Year Stf-3a Wellsb LSDc 1 90.31 68.66 10.35 Height (cm) 2 70.05 50.28 6.60 1 7 3 1 Tiller number 2 8 3 2 1 0.361 0.446 0.022 Ave. root diameter (mm) 2 0.365 0.453 0.025 aWeedy red rice, n = 4. bCultivated rice, n = 3. cMeans were separated using Fisher’s protected LSD at α = 0.05. Table 3. Growth characteristics as affected by rice type, grown grown in complete nutrient solution (T1), Year 2. Rice type No. of root tips (× 103) Shoot DWc (g) Root DW (g) Total DW (g) Stf-3a 56.124 3.73 1.09 4.82 Wellsb 10.836 1.41 0.41 1.82 LSDd 16.906 1.54 0.37 1.90 aWeedy red rice, n = 4. bCultivated rice, n = 4. cDW = dry weight dMeans were separated using Fisher’s protected LSD at α = 0.05. Changing N supply resulted in detectable differences in whole-plant aboveground characteristics in Year 2 (Ta- ble 1). The findings that Wells generally has lower re- sponse to N compared with red rice agree with findings in field conditions, with respect to biomass accumulation [7]. Belowground traits. Average root diameter in both years also differed between rice types (Table 2). In Year 2, red rice had 6 times more root tips and 3 times more shoot and root biomass than Wells (Table 3). Differences in root length and surface area due to the interaction of rice type and N treatment was also evident, particularly in Stf-3 (Table 4). T2 plants had visible, but not sig- ni- ficant, retardation in root growth and expansion of root surface area in Stf-3 relative to plants grown in T1, but the change in Wells was imperceptible (Table 4). At T4, Stf-3 significantly increased root length and root surface area, but not Wells. N treatment effect on root biomass was also evident in Year 2, with the greatest root dry weight observed at T1 (Table 5). Thus, red rice response to restoration of full N supply after starvation was evi- dent in root morphology within 48 hr, but not in Wells rice. Table 4. Growth characteristics affected by the interaction of rice type and N treatme nt, Year 2a. Root length (m) Root surface area (m2) N treatment Stf-3 Wells Stf-3 Wells T1 (complete) 88.17 14.54 1006 203 T2 (–NH4NO3) 62.90 22.70 609 298 T3 (24 h complete post-N deficiency) 85.63 23.37 1010 346 T4 (48 h complete post-N deficiency) 131.43 29.22 1700 446 bLSD1 54.28 570 LSD2 27.97 319 aRice types were weedy red rice (Stf-3) and cultivated rice (Wells). Means were separated using Fisher’s protected LSD at α = 0.05 (n = 4). bLSD1 separates means within same rice type; LSD2 separates means for different rice types.  Morphological and Physiological Responses of Weedy Red Rice (Oryza sativa L.) 574 and Cultivated Rice (O. sativa) to N Supply Table 5. Growth characteristics and shoot nutrient concen- trations affected by N treatment, averaged over rice types, Year 2a. N treatment Root DW (g) Fructose (µg·g–1) Glucose (µg·g–1) T1 (complete) 0.52 38.61 62.73 T2 (–NH4NO3) 0.89 51.43 87.63 T3 (24 h complete post-N deficiency) 0.78 32.90 61.71 T4 (48 h complete post-N deficiency) 0.81 29.98 58.34 LSDb 0.24 10.39 15.56 aRice types were weedy red rice (Stf-3) and cultivated rice (Wells), n = 8. bMeans were separated using Fisher’s protected LSD at α = 0.05. Root characteristics are correlated with nutrient access to and uptake from the rhizosphere and are significant factors in underground competition. Changes in root architecture are typical responses in plants during nutrient stress as an adaptive mechanism to increase nutrient access [8]. The effect of N supply on root growth of Stf-3 observed in Year 2 confirmed similar findings in cultivated rice [49] which showed that 3 stimulates root elongation and growth of root hairs. On the other hand, N supply effect on root morphology was not evident in other studies [50] as was observed with Wells in this current research. Since differences in root morphology between Stf-3 and Wells had been consistent regardless of N supply, genotypic effect was strongly evident. Stf-3 responded more to N supplementation than Wells, producing longer roots and greater root surface area after some recovery period, which equate to greater N uptake capacity than that of Wells. While Stf-3 had visibly longer and finer root hairs, Wells had consistently thicker roots compared with Stf-3. Larger roots offer stronger plant support, but have smaller surface areas and fewer root tips for nutrient absorption. The number of root tips is indicative of the ability of plants to absorb nutrients [51]. Therefore, more root tips and greater root surface area in Stf-3 than in Wells must have contributed to greater leaf tissue [N] in Stf-3 than in Wells. Root characteristics of Stf-3 indicate that, at the whole-plant level, an extensive root system and a faster root growth response to N supplementation contribute greatly to the nutrient uptake advantage of weedy rice over cultivated rice. NO 3.4. Physiological Differences Shoot tissue [N]. Differences in shoot tissue [N] as af- fected by the interaction of N treatment and rice type were significant in both years (Ta bl e 6). Stf-3 had higher [N] in its shoot tissue than Wells when grown under Table 6. Shoot tissue N concentrations (mg·kg–1) affected by the interaction of rice type and N treatment. Year 1 Year 2 N treatment Stf-3a Wellsb Stf-3 Wells T1 (complete) 42.15 31.63 53.90 46.28 T2 (–NH4NO3) 28.48 22.20 33.20 29.05 T3 (24 h complete post-N deficiency)32.53 26.47 43.28 36.90 T4 (48 h complete post-N deficiency)36.30 26.43 46.50 50.33 cLSD1 5.02 9.81 LSD2 3.10 4.77 aWeedy red rice, n = 4. bCultivated rice, n = 3. cMeans were separated using Fisher's protected LSD at α = 0.05. LSD1 separates means within same rice type; LSD2 separates means for different rice types. complete nutrient solution. The [N] in Stf-3 and Wells declined by 32% and 30%, respectively, in Year 1 and 38% and 37%, respectively in Year 2 at NSI < 95% (T2), relative to plants grown in T1. At T4, Stf-3 showed a sig- nificant increase in shoot tissue [N] in Year 1. This was observed even earlier (T3) in Year 2. Although Wells did not show a significant increase in [N] even at T4 in Year 1, it showed full recovery of shoot tissue [N] under the same N conditions in Year 2. Within 48 h of post-N defi- ciency (T4), both rice types had lesser shoot tissue [N] than plants grown in T1 in Year 1, but in Year 2 both rice types recovered faster from N stress than in Year 1, showing similar shoot tissue [N] as those grown in T1. Differences in shoot tissue [N] as affected by interaction of N treatment and rice type confirmed that exogenously applied N at varying levels was absorbed at different amounts by Wells and Stf-3, and that accumula- tion in shoot tissue also varied according to N supply. Generally, shoot tissue [N] was greater in Stf-3 than in Wells at control and treated conditions, except in Year 2 when both plants had similar concentrations at T2 and T4 (Table 6). This corroborated reports of higher N uptake capacity of Stf-3 as indicated by its inherently more extensive root system and its apparent root growth response to added N compared to Wells. There is evidence, therefore, supporting our hypothesis that red rice is able to accumulate N better than cultivated rice, considering its biomass production and shoot [N]. Both plants attained [N] similar to unstressed plants (T1) after 48 h of N supply post-N deficiency (T4). Total sugars. [Fruc] and [Glu] were affected by N treatments in Year 2 (Table 5), where the greatest concentration was observed at T2. Differences were most detectable in [Suc], considering that in higher plants, sucrose is the major sugar for transport throughout the Copyright © 2011 SciRes. AJPS  Morphological and Physiological Responses of Weedy Red Rice (Oryza sativa L.) 575 and Cultivated Rice (O. sativa) to N Supply plant. Sucrose concentrations differed by rice type (LSD0.05 = 0.036), with Stf-3 having greater [Suc] (0.194 mg· g–1) than Wells (0.114 mg·g–1). The effect of N treatment on [Suc] was also evident in Year 1, when the lowest [Suc] was observed at T1, averaged over rice type (Table 7). In Year 2, the interaction effect of rice type and N treatment on [Suc] was evident, when [Suc] in Stf- 3 was greatest at T2 and declined with duration of N supply post-N deficiency (Table 8). A similar trend was observed in Wells, except that the change in [Suc] from one treatment to another was not significant. Varying shoot tissue [Suc] indicate that Stf-3 res- ponded to N treatments to a greater extent than Wells in Year 2, since Wells [Suc] at optimum N concentrations was not different from that at 0 N (Table 8). Moreover, [Suc] in Stf-3 declined quickly with time of recovery, approaching its baseline level at full N, whereas [Suc] in Wells hardly changed regardless of N treatment. In- creased [Suc] in red rice under N deficiency corroborates evidence for the involvement of soluble sugars in stress response and their role as nutrient and metabolite signaling molecules [52]. Thus, under N deficiency, increased [Suc] in both Stf-3 and Wells, albeit compara- tively lower in the latter, may be a stress signaling mechanism for the plant to stimulate N uptake [53-55]. In this case, the signaling mechanism of Stf-3 may be more efficient than that of Wells. For example, plants are Table 7. Shoot sucrose concentrations as affected by N treatment, averaged over rice types, Year 1a. N treatment Sucrose (mg·g–1) T1 (complete) 0.079 T2 (–NH4NO3) 0.198 T3 (24 h complete post-N deficiency)0.163 T4 (48 h complete post-N deficiency)0.200 LSDb 0.041 an = 7. bMeans were separated using Fisher’s protected LSD at α = 0.05. Table 8. Shoot sucrose concentrations affected by the inter- action of rice type and N treatment, Year 2a. Sucrose (mg·g–1) N treatment Stf-3 Wells T1 (complete) 0.292 0.386 T2 (–NH4NO3) 0.626 0.432 T3 (24 h complete post-N deficiency)0.443 0.274 T4 (48 h complete post-N deficiency)0.181 0.237 bLSD1 0.304 LSD2 0.242 aRice types were weedy red rice (Stf-3) and cultivated rice (Wells). Means were separated using Fisher’s protected LSD at α = 0.05 (n = 4). bLSD1 separates means within the same rice type; LSD2 separates means for dif- ferent rice types. able to adapt to cold stress by accumulating sugars [56]. However, much remains to be done in characterizing the many signaling pathways of sugar-induced responses to stress, considering that most investigations have been limited to sugar-induced stress responses in relation tohormones and growth regulators [57]. 4. Implications and Recommendations Our findings corroborate earlier reports on red rice ac- cumulating more N than cultivated rice. Differences in response to N treatments between Stf-3 and Wells rice suggest different adaptive mechanisms within the N me- tabolic pathway, as well as the role of sucrose as a stress signaling molecule. For instance, the stimulatory effect of N supply, particularly 3, on root elongation, has been demonstrated to regulate the transcription of many genes in rice, including those involved in signal trans- duction, transcription regulation, auxin transport and ethylene synthesis. Genomic analysis to identify genes involved in these pathways in response to N stress condi- tions would help answer these questions. NO REFERENCES [1] N. Childs and J. Livezey, “Rice Backgrounder,” 2008. www.ers.usda.gov [2] J. C. Delouche, N. R. Burgos, D. R. Gealy, G. Z. De San Martin, R. Labrada, M. Larinde and C. Rosell, “Weedy Rices: Origin, Biology, Ecology and Control,” FAO Plant Production and Protection Paper 188, FAO-UN, Rome, 2007. [3] N. R. Burgos, J. K. Norsworthy, R. C. Scott and K. L. Smith, “Red Rice (Oryza sativa) Status after Five Years of Imidazolinone-Resistant Rice Technology in Arkan- sas,” Weed Technology, Vol. 22, No. 1, 2008, pp. 200-208. doi:10.1614/WT-07-075.1 [4] V. K. Shivrain, “Molecular Characterization of the Ace- tolactate Synthase (ALS) Gene and Phenotypic Diversity in Red Rice (Oryza sativa L.),” M.S. Thesis, University of Arkansas, Fayetteville, 2004. [5] R. J. Smith, “Weed Thresholds in Southern U.S. Rice (Oryza sativa),” Weed Technology, Vol. 2, 1988, pp. 232- 241. [6] R. J. Norman, C. E. Wilson Jr. and N. A. Slaton, “Soil Fertilization and Rice Nutrition in Mechanized Rice Cul- ture”, In: C. W. Smith and R. H. Dilday, Eds., Rice: Ori- gin, History, Technology and Production, Wiley Sci- ences, New York, 2003, pp. 331-411. [7] N. R. Burgos, R. J. Norman, D. R. Gealy and H. Black, “Comparative N Uptake between Rice and Weedy Rice,” Field Crops Research, Vol. 99, No. 2-3, 2006, pp. 96-105. doi:10.1016/j.fcr.2006.03.009 [8] H. Marschner, “Mineral Nutrition of Higher Plants,” Academic Press, San Diego, 1995. Copyright © 2011 SciRes. AJPS  Morphological and Physiological Responses of Weedy Red Rice (Oryza sativa L.) 576 and Cultivated Rice (O. sativa) to N Supply [9] N. M. Crawford, “Nitrate: Nutrient and Signal for Plant Growth,” Plant Cell, Vol. 7, 1995, pp. 859-868. [10] M. Stitt and A. Krapp, “The Molecular Physiological Basis for the Interaction between Elevated Carbon Diox- ide and Nutrients,” Plant, Cell and Environment, Vol. 22, No. 6, 1999, pp. 583-622. doi:10.1046/j.1365-3040.1999.00386.x [11] J. L. Havlin, J. D. Beaton, S. L. Tisdale and W. L. Nelson, “Soil Fertility and Fertilizers: An Introduction to Nutrient Management,” Prentice-Hall, Upper Saddle River, New Jersey, 2005. [12] W. G. Hopkins and P. A. Huner, “Introduction to Plant Physiology,” John Wiley and Sons, Inc., Hoboken, New Jersey, 2004. [13] K. Hikosaka, “Interspecific Difference in the Photosyn- thesis―Nitrogen Relationship: Patterns, Physiological causes and Ecological Importance,” Journal of Plant Re- search, Vol. 117, 2004, pp. 481-494. [14] M. J. Paul and T. K. Pellny, “Carbon Metabolite Feed- back Regulation of Leaf Photosynthesis and Develop- ment,” Journal of Experimental Botany, Vol. 54, No. 132, 2003, pp. 539-547. doi:10.1093/jxb/erg052 [15] M. J. Paul and C. H. Foyer, “Sink Regulation of Photo- synthesis,” Journal of Experimental Botany, Vol. 52, 2001, pp. 1383-1400. doi:10.1093/jexbot/52.360.1383 [16] B. Arnhold-Schmitt, “Stress-Induced Cell Reprogram- ming. A Role for Global Genome Regulation,” Plant Physiology, Vol. 136, No. 1, 2004, pp. 2579-2586. doi:10.1104/pp.104.042531 [17] M. Bagayoko, S. Alvey, G. Neumann and A. Buerkert, “Root-Induced Increases in Soil pH and Nutrient Avail- ability to Field-Grown Cereals and Legumes on Acid Sandy Soils of Sudano-Sahelian West Africa,” Plant and Soil, Vol. 225, No. 1-2, 2000, pp. 117-127. doi:10.1023/A:1026570406777 [18] Z. Rengel and P. Marschner, “Nutrient Availability and Management in the Rhizosphere: Exploiting Genotypic Differences,” New Phytologist, Vol. 168, 2005, pp. 305-3 12. [19] N. von Wirén, S. Gazzarrini and W. B. Frommer, “Regu- lation of Mineral Nitrogen Uptake in Plants,” Plant and Soil, Vol. 196, No. 2, 1997, pp.191-199. doi:10.1023/A:1004241722172 [20] R. Tischner, “Nitrate Uptake and Reduction in Higher and Lower Plants,” Plant, Cell and Environment, Vol. 23, No. 10, 2000, pp. 1005-1024. doi:10.1046/j.1365-3040.2000.00595.x [21] S. Gazzarrini, L. Lejay, A. Gojon, O. Ninnemann, W. B. Frommer and N. von Wirén, “Three Functional Trans- porters for Constitutive, Diurnally Regulated, and Starva- tion-Induced Uptake of Ammonium into Arabidopsis Roots,” Plant Cell, Vol. 11, 1999, pp. 937-948. [22] S. U. Aubert, E. Gout, R. Bligny, D. Marty-Mazars, F. Barrieu, J. Alabouvette, F. Marty and R. Douce, “Ultra- structural and Biochemical Characterization of Auto- phagy in Higher Plant Cells Subjected to Carbon Depri- vation: Control by the Supply of Mitochondria with Res- piratory Substrates,” Journal of Cell Biology, Vol. 133, 1996, pp. 1251-1263. doi:10.1083/jcb.133.6.1251 [23] T. W. Rufty, S. C. Huber and R. J. Volk, “Alterations in Leaf Carbohydrate Metabolism in Response to Nitrogen Stress,” PlantPhysiology, Vol. 88, No. 3, 1988, pp. 725-730. doi:10.1104/pp.88.3.725 [24] E. A. Schmelz, H. T. Alborn, J. Engelberth and J. H. Tumlinson, “Nitrogen Deficiency Increases Volicitin- Induced Volatile Emission, Jasmonic Acid Accumulation, and Ethylene Sensitivity in Maize,” Plant Physiology, Vol. 133, No. 1, 2003, pp. 295-306. doi:10.1104/pp.103.024174 [25] R. Brouquisse, F. James, P. Raymond and A. Pradet, “Study of Glucose Starvation in Excised Maize Root Tips,” Plant Physiology, Vol. 96, No. 2, 1991, pp. 619-626. doi:10.1104/pp.96.2.619 [26] R. Brouquisse, J. P. Gaudillere and P. Raymond, “Induc- tion of Carbon-Starvation-Related Proteolysis in Whole Maize Plants Submitted to Light/Dark Cycles and to Ex- tended Darkness,” Plant Physiology, Vol. 117, No. 4, 1998, pp. 1281-1291. doi:10.1104/pp.117.4.1281 [27] M. H. Chen, L. F. Liu, Y. R. Chen, H. K. Wu and S. M. Yu, “Expression of α-Amylases, Carbohydrate Metabo- lism, and Autophagy in Cultured Rice Cells is Coordi- nately Regulated by Sugar Nutrient,” Plant Journal, Vol. 6, No. 5, 1994, pp. 625-636. doi:10.1046/j.1365-313X.1994.6050625.x [28] T. Inamura, S. Miyagawa, O. Singvilay, N. Sipaseauth and Y. Kono, “Competition between Weeds and Wet Season Transplanted Paddy Rice for N Use, Growth and Yield in the Central and Northern Regions of Laos,” Weed Biology and Management, Vol. 3, No. 4, 2003, pp. 213- 221. doi:10.1046/j.1444-6162.2003.00106.x [29] S. R. Radosevich, “Methods of Interactions among Crops and Weeds,” Weed Technology, Vol. 1, 1987, pp. 190- 198. [30] L. E. Estorninos Jr., D. R.Gealy and R. E. Talbert, “Growth Response of Rice (Oryza sativa) and Rice (O. sativa) in a Replacement Series Study”, Weed Technology, Vol. 16, No. 2, 2002, pp. 401-106. doi:10.1614/0890-037X(2002)016[0401:GROROS]2.0.C O;2 [31] L. E. Estorninos Jr., D. R. Gealy, R. E. Talbert and M. R. McClelland, “Rice and Red Rice Interference II: Rice Response to Population Densities of Three Red Rice (Oryza sativa) Ecotypes,” Weed Science, Vol. 53, No. 5, 2005, pp. 683-689. doi:10.1614/WS-04-040R1.1 [32] V. K. Shivrain, N. R. Burgos, R. C. Scott, E. E. Gbur Jr., L. E. Estorninos Jr. and M. R. McClelland, “Diversity of Weedy Red Rice (Oryza sativa L.) in Arkansas, U.S.A. in Relation to Weed Management,” Crop Protection, Vol. 29, 2010, pp. 721-730. doi:10.1016/j.cropro.2010.02.010 [33] K. A. K. Moldenhauer, F. N. Lee, J. L. Bernhardt, R. J. Norman, N. A. Slaton, C. E. Wilson, M. M. Anders, R. D. Cartwright and M. M. Blocker, “Registration of ‘Wells’ Copyright © 2011 SciRes. AJPS  Morphological and Physiological Responses of Weedy Red Rice (Oryza sativa L.) and Cultivated Rice (O. sativa) to N Supply Copyright © 2011 SciRes. AJPS 577 Rice,” Crop Science, Vol. 47, 2007, pp. 442-443. doi:10.2135/cropsci2006.06.0419 [34] C. E. Wilson Jr. and J. W. Branson, “Trends in Arkansas Rice Production,” In: R. J. Norman, J. F. Meullenet and K. A. K. Moldenhauer, eds., B. R. Wells Rice Research Studies, Agricultural Experiment Station Research Series 550, Fayetteville, 2006, pp. 13-22. [35] S. Yoshida, D. A. Forno, J. H. Cock and K. A. Gomez, “Laboratory Manual for Physiological Studies of Rice,” 3rd edition, International Rice Research Institute, Laguna, 1979. [36] P. A. Counce, T. C. Keisling and A. J. Mitchell, “A Uni- form, Objective, and Adaptive System for Expressing Rice Development,” Crop Science, Vol. 40, No. 2, 2000, pp. 436-443. doi:10.2135/cropsci2000.402436x [37] T. A. Peterson, T. M. Blackner, D. D. Francis and J. S. Schepers, “Using a Chlorophyll Meter to Improve N Management,” University of Nebraska Cooperative Ex- tension, Lincoln, 1996. [38] F. E. Groves, “Biology and Control of Yellow Nutsedge (Cyperusesculentus) in Cotton (Gossypium hirsutum),” M. S. Thesis, University of Arkansas, Fayetteville, 2004. [39] K. Matsuda, “On the Germination of Seeds of Rice Varie- ties at Low Temperature (preliminary) [in Japanese],” Proceedings of the Crop Science Society of Japan, Vol. 2, 1930, pp. 263-268. doi:10.1626/jcs.2.263 [40] C. L. Pan, “A Preliminary Report of Varietal Differences in Rapidity of Germination in Rice,” Journal of the American Society for Agriculture, Vol. 28, 1936, pp. 985- 989. doi:10.2134/agronj1936.00021962002800120004x [41] K. Wada, “Effect of Lower Temperature on Germination of Rice Seed Originating in Different Localities [in Japa- nese, English Summary],” Proceedings of the Crop- Science Society of Japan, Vol. 18, 1949, pp. 38-39. [42] K. Sato, “The Development of Rice Grains under Con- trolled Environment. III. Germinability of Seeds Ripened under Different Environmental Conditions,” Tohoku Journal of Agricultural Research, Vol. 24, 1973, pp. 14- 21. [43] A. Osada, “Studies on the Photosynthesis of Indica Rice,” Japanese Journal of Crop Science, Vol. 33, No. 1, 1964, pp. 69-76. doi:10.1626/jcs.33.69 [44] H. Oka, “Tillering and Elongation Rates, Culm Length and Other Characters in Rice Varieties in Response to Temperature [in Japanese, English Summary],” Japan Journal of Breeding, Vol. 4, No. 4, 1955, pp. 213-221. [45] H. Oka, “Intervarietal Variation and Classification of Cultivated Rice,” Indian Journal of Genetics and Plant Breeding, Vol. 18, 1958, pp. 79-89. [46] H. Oka H, “Variations in Temperature Responses among Cultivated Rice Varieties,” Phyton, Vol. 12, 1959, pp. 1- 11. [47] M. L. Shen and I. T. Wey, “Studies on the Local Adapta- bility of Paddy Rice Varieties Using Multi-variate Linear Regression Analysis [in Chinese, English summary],” Journal of the Agricultural Association of China, Vol. 71, 1970, pp.1-13. [48] N. Slaton, K. Moldenhauer, C. Wilson Jr., R. Cartwright, J. Gibbons, B. Koen, J. Bernhardt, F. Lee and J. Robinson, “Wells: A Summary of Research and Management Rec- ommendations,” Rice Information 44, University of Ar- kansas Cooperative Extension Service, Fayetteville, 2000, pp. 1-8. [49] X. B. Wang, P. Wu, M. Xia, Z. Wu, Q. Chen and F. Liu, “Identification of Genes Enriched in Rice Roots of the Local Nitrate Treatment and Their Expression Patterns in Split-Root Treatment,” Gene, Vol. 297, 2002, pp. 93-102. doi:10.1016/S0378-1119(02)00870-3 [50] X. B. Wang, P. Wu, B. Hu and Q. S. Chen, “Effects of Nitrate on Rice Lateral Root Morphology and Nitrogen Absorption in Rice (Oryza sativa L.),” Acta Botanica Sinica, Vol. 44, 2002, pp. 678-683. [51] S. Gilroy and D. L. Jones, “Through Form to Function: Root Hair Development and Nutrient Uptake,” Trends in Plant Science, Vol. 5, 2000, pp.56-60. doi:10.1016/S1360-1385(99)01551-4 [52] I. Couee, C. Sulmon,G. Gouesbet and A.El Amrani, “In- volvement of Soluble Sugars in Reactive Oxygen Species Balance and Responses to Oxidative Stress in Plants,” Journal of Experimental Botany, Vol. 57, No. 3, 2006, pp. 449- 459. doi:10.1093/jxb/erj027 [53] C. V. Givan, “Metabolic Detoxification of Ammonia in Tissues of Higher Plants,” Phytochemistry, Vol. 18, 1979, pp. 375-382. doi:10.1016/S0031-9422(00)81870-1 [54] C. P. Vance and G. H. Heichel, “Carbon in N2 Fixation: Limitation or Exquisite Adaptation,” Annual Review of Plant Physiology and Plant Molecular Biology, Vol. 42, 1991, pp. 373-392. doi:10.1146/annurev.pp.42.060191.002105 [55] J. K. Schjoerring, S. Husted, G. Mack and M. Mattsson, “The Regulation of Ammonium Translocation in Plants,” Journal of Experimental Botany, Vol. 53, No. 370, 2002, pp. 883- 890. doi:10.1093/jexbot/53.370.883 [56] I. Ciereszko, H. Johansson and L. A. Kleczkowski, “Su- crose and Light Regulation of a Cold-Inducible UDP- glucose Pyrophosphorylase Gene via a Hexokinase-In- dependent and Abscisic Acid-Insensitive Pathway in Arabidopsis,” Biochemistry Journal, Vol. 354, No. 67-72, 2001, pp. 67-72. doi:10.1042/0264-6021:3540067 [57] T. J. Chiou and D. R. Bush, “Sucrose is a Signal Mole- cule in Assimilate Partitioning,” Proceedings of the Na- tional Academy of Sciences USA, Vol. 95, 1998, pp. 4784-4788.
|