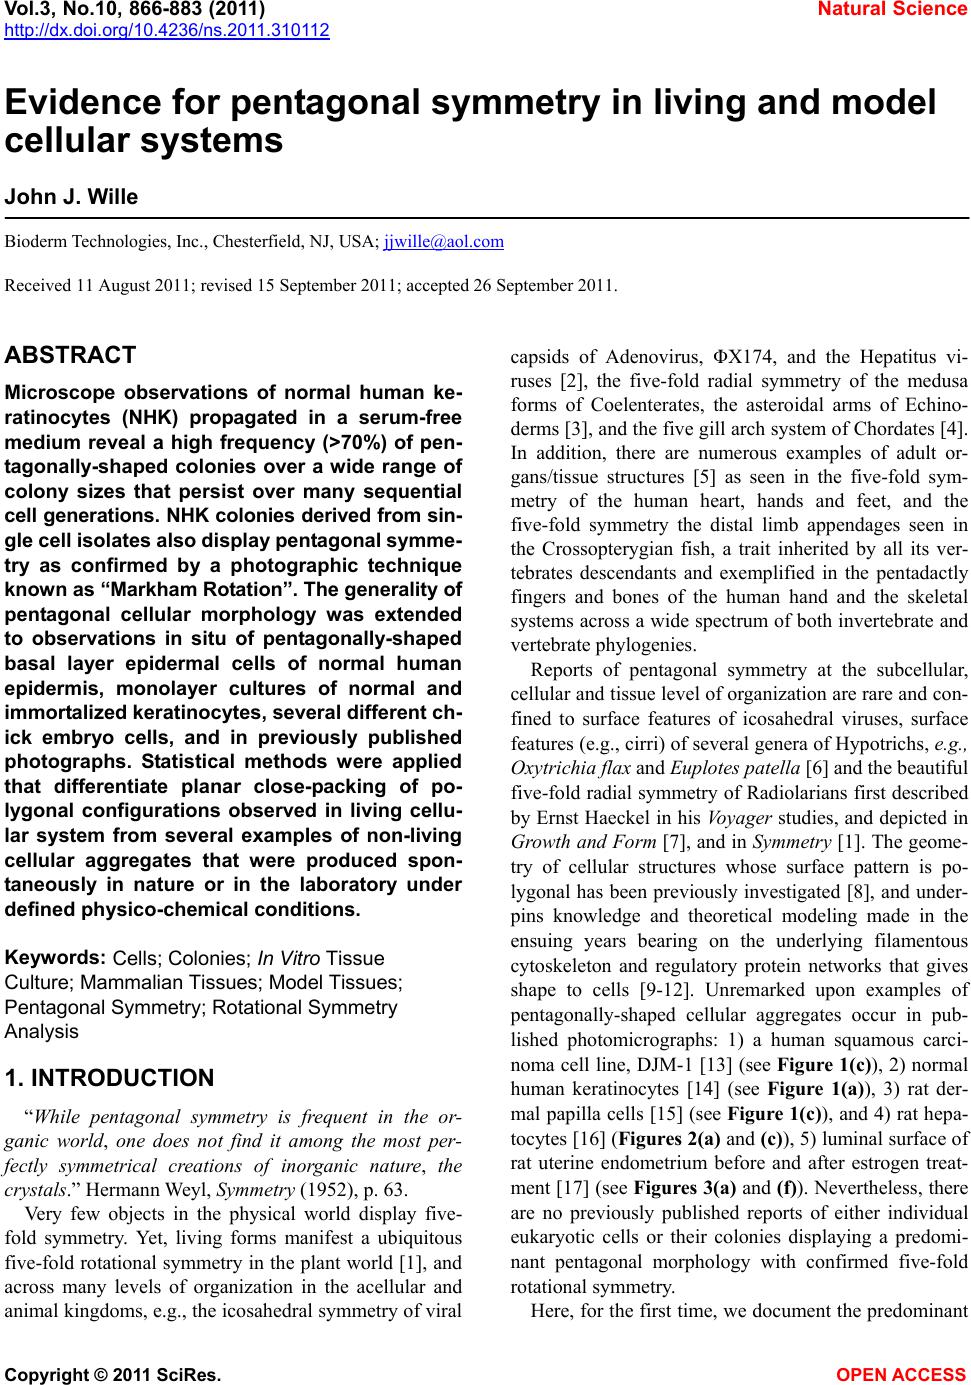
 Vol.3, No.10, 866-883 (2011) Natural Science http://dx.doi.org/10.4236/ns.2011.310112 Copyright © 2011 SciRes. OPEN ACCESS Evidence for pentagonal symmetry in living and model cellular systems John J. Wille Bioderm Technologies, Inc., Chesterfield, NJ, USA; jjwille@aol.com Received 11 August 2011; revised 15 September 2011; accepted 26 September 2011. ABSTRACT Microscope observations of normal human ke- ratinocytes (NHK) propagated in a serum-free medium reveal a high frequency (>70%) of pen- tagonally-shaped colonies over a wide range of colony sizes that persist over many sequential cell generations. NHK colonies derived from sin- gle cell isolates also display pentagonal symme- try as confirmed by a photographic technique known as “Markham Rotation”. The generality of pentagonal cellular morphology was extended to observations in situ of pentagonally-shaped basal layer epidermal cells of normal human epidermis, monolayer cultures of normal and immortalized keratinocytes, several different ch- ick embryo cells, and in previously published photographs. Statistical methods were applied that differentiate planar close-packing of po- lygonal configurations observed in living cellu- lar system from several examples of non-living cellular aggregates that were produced spon- taneously in nature or in the laboratory under defined physico-chemical conditions. Keywords: Cells; Colonies; In Vitro Tissue Culture; Mammalian Tissues; Model Tissues; Pentagonal Symmetry; Rotational Symmetry Analysis 1. INTRODUCTION “While pentagonal symmetry is frequent in the or- ganic world, one does not find it among the most per- fectly symmetrical creations of inorganic nature, the crystals.” Hermann Weyl, Symmetry (1952), p. 63. Very few objects in the physical world display five- fold symmetry. Yet, living forms manifest a ubiquitous five-fold rotational symmetry in the plant world [1], and across many levels of organization in the acellular and animal kingdoms, e.g., the icosahedral symmetry of viral capsids of Adenovirus, ΦX174, and the Hepatitus vi- ruses [2], the five-fold radial symmetry of the medusa forms of Coelenterates, the asteroidal arms of Echino- derms [3], and the five gill arch system of Chordates [4]. In addition, there are numerous examples of adult or- gans/tissue structures [5] as seen in the five-fold sym- metry of the human heart, hands and feet, and the five-fold symmetry the distal limb appendages seen in the Crossopterygian fish, a trait inherited by all its ver- tebrates descendants and exemplified in the pentadactly fingers and bones of the human hand and the skeletal systems across a wide spectrum of both invertebrate and vertebrate phylogenies. Reports of pentagonal symmetry at the subcellular, cellular and tissue level of organization are rare and con- fined to surface features of icosahedral viruses, surface features (e.g., cirri) of several genera of Hypotrichs, e.g., Oxytrichia flax and Euplotes patella [6] and the beautiful five-fold radial symmetry of Radiolarians first described by Ernst Haeckel in his Vo y ag e r studies, and depicted in Growth and Form [7], and in Symmetry [1]. The geome- try of cellular structures whose surface pattern is po- lygonal has been previously investigated [8], and under- pins knowledge and theoretical modeling made in the ensuing years bearing on the underlying filamentous cytoskeleton and regulatory protein networks that gives shape to cells [9-12]. Unremarked upon examples of pentagonally-shaped cellular aggregates occur in pub- lished photomicrographs: 1) a human squamous carci- noma cell line, DJM-1 [13] (see Figure 1(c)), 2) normal human keratinocytes [14] (see Figure 1(a)), 3) rat der- mal papilla cells [15] (see Figure 1(c)), and 4) rat hepa- tocytes [16] (Figures 2(a) and (c)), 5) luminal surface of rat uterine endometrium before and after estrogen treat- ment [17] (see Figures 3(a) and (f)). Nevertheless, there are no previously published reports of either individual eukaryotic cells or their colonies displaying a predomi- nant pentagonal morphology with confirmed five-fold rotational symmetry. Here, for the first time, we document the predominant 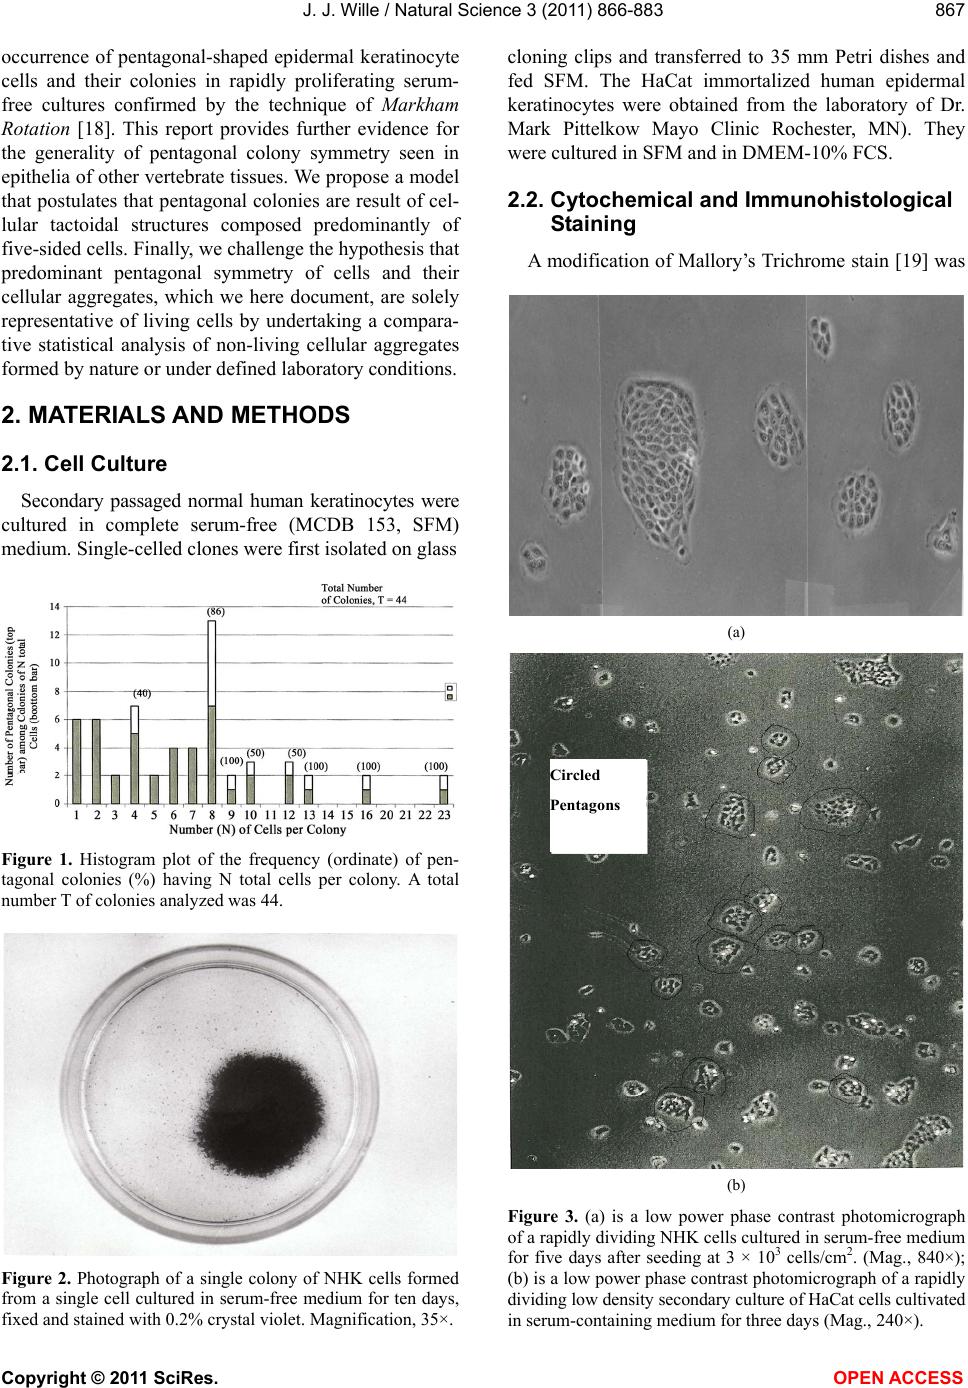 J. J. Wille / Natural Science 3 (2011) 866-883 Copyright © 2011 SciRes. OPEN ACCESS 867 867 occurrence of pentagonal-shaped epidermal keratinocyte cells and their colonies in rapidly proliferating serum- free cultures confirmed by the technique of Markham Rotation [18]. This report provides further evidence for the generality of pentagonal colony symmetry seen in epithelia of other vertebrate tissues. We propose a model that postulates that pentagonal colonies are result of cel- lular tactoidal structures composed predominantly of five-sided cells. Finally, we challenge the hypothesis that predominant pentagonal symmetry of cells and their cellular aggregates, which we here document, are solely representative of living cells by undertaking a compara- tive statistical analysis of non-living cellular aggregates formed by nature or under defined laboratory conditions. 2. MATERIALS AND METHODS 2.1. Cell Culture Secondary passaged normal human keratinocytes were cultured in complete serum-free (MCDB 153, SFM) medium. Single-celled clones were first isolated on glass Figure 1. Histogram plot of the frequency (ordinate) of pen- tagonal colonies (%) having N total cells per colony. A total number T of colonies analyzed was 44. Figure 2. Photograph of a single colony of NHK cells formed from a single cell cultured in serum-free medium for ten days, fixed and stained with 0.2% crystal violet. Magnification, 35×. cloning clips and transferred to 35 mm Petri dishes and fed SFM. The HaCat immortalized human epidermal keratinocytes were obtained from the laboratory of Dr. Mark Pittelkow Mayo Clinic Rochester, MN). They were cultured in SFM and in DMEM-10% FCS. 2.2. Cytochemical and Immunohistological Staining A modification of Mallory’s Trichrome stain [19] was (a) Circled Pentagons (b) Figure 3. (a) is a low power phase contrast photomicrograph of a rapidly dividing NHK cells cultured in serum-free medium for five days after seeding at 3 × 10³ cells/cm2. (Mag., 840×); (b) is a low power phase contrast photomicrograph of a rapidly dividing low density secondary culture of HaCat cells cultivated in serum-containing medium for three days (Mag., 240×). 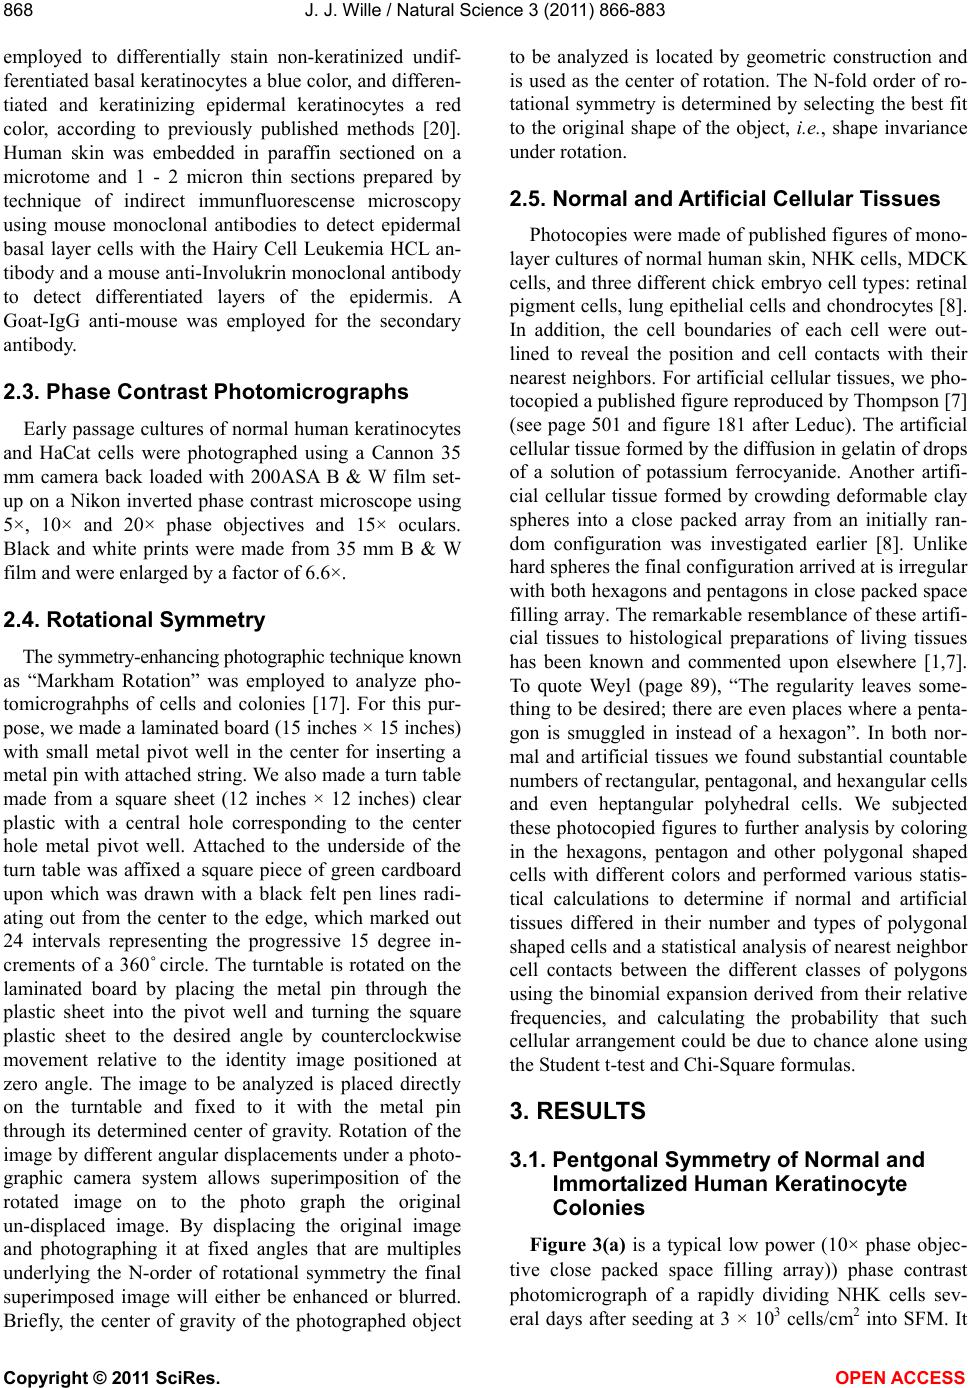 J. J. Wille / Natural Science 3 (2011) 866-883 Copyright © 2011 SciRes. OPEN ACCESS 868 employed to differentially stain non-keratinized undif- ferentiated basal keratinocytes a blue color, and differen- tiated and keratinizing epidermal keratinocytes a red color, according to previously published methods [20]. Human skin was embedded in paraffin sectioned on a microtome and 1 - 2 micron thin sections prepared by technique of indirect immunfluorescense microscopy using mouse monoclonal antibodies to detect epidermal basal layer cells with the Hairy Cell Leukemia HCL an- tibody and a mouse anti-Involukrin monoclonal antibody to detect differentiated layers of the epidermis. A Goat-IgG anti-mouse was employed for the secondary antibody. 2.3. Phase Contrast Photomicrographs Early passage cultures of normal human keratinocytes and HaCat cells were photographed using a Cannon 35 mm camera back loaded with 200ASA B & W film set- up on a Nikon inverted phase contrast microscope using 5×, 10× and 20× phase objectives and 15× oculars. Black and white prints were made from 35 mm B & W film and were enlarged by a factor of 6.6×. 2.4. Rotational Symmetry The symmetry-enhancing photographic technique known as “Markham Rotation” was employed to analyze pho- tomicrograhphs of cells and colonies [17]. For this pur- pose, we made a laminated board (15 inches × 15 inches) with small metal pivot well in the center for inserting a metal pin with attached string. We also made a turn table made from a square sheet (12 inches × 12 inches) clear plastic with a central hole corresponding to the center hole metal pivot well. Attached to the underside of the turn table was affixed a square piece of green cardboard upon which was drawn with a black felt pen lines radi- ating out from the center to the edge, which marked out 24 intervals representing the progressive 15 degree in- crements of a 360˚ circle. The turntable is rotated on the laminated board by placing the metal pin through the plastic sheet into the pivot well and turning the square plastic sheet to the desired angle by counterclockwise movement relative to the identity image positioned at zero angle. The image to be analyzed is placed directly on the turntable and fixed to it with the metal pin through its determined center of gravity. Rotation of the image by different angular displacements under a photo- graphic camera system allows superimposition of the rotated image on to the photo graph the original un-displaced image. By displacing the original image and photographing it at fixed angles that are multiples underlying the N-order of rotational symmetry the final superimposed image will either be enhanced or blurred. Briefly, the center of gravity of the photographed object to be analyzed is located by geometric construction and is used as the center of rotation. The N-fold order of ro- tational symmetry is determined by selecting the best fit to the original shape of the object, i.e., shape invariance under rotation. 2.5. Normal and Artificial Cellular Tissues Photocopies were made of published figures of mono- layer cultures of normal human skin, NHK cells, MDCK cells, and three different chick embryo cell types: retinal pigment cells, lung epithelial cells and chondrocytes [8]. In addition, the cell boundaries of each cell were out- lined to reveal the position and cell contacts with their nearest neighbors. For artificial cellular tissues, we pho- tocopied a published figure reproduced by Thompson [7] (see page 501 and figure 181 after Leduc). The artificial cellular tissue formed by the diffusion in gelatin of drops of a solution of potassium ferrocyanide. Another artifi- cial cellular tissue formed by crowding deformable clay spheres into a close packed array from an initially ran- dom configuration was investigated earlier [8]. Unlike hard spheres the final configuration arrived at is irregular with both hexagons and pentagons in close packed space filling array. The remarkable resemblance of these artifi- cial tissues to histological preparations of living tissues has been known and commented upon elsewhere [1,7]. To quote Weyl (page 89), “The regularity leaves some- thing to be desired; there are even places where a penta- gon is smuggled in instead of a hexagon”. In both nor- mal and artificial tissues we found substantial countable numbers of rectangular, pentagonal, and hexangular cells and even heptangular polyhedral cells. We subjected these photocopied figures to further analysis by coloring in the hexagons, pentagon and other polygonal shaped cells with different colors and performed various statis- tical calculations to determine if normal and artificial tissues differed in their number and types of polygonal shaped cells and a statistical analysis of nearest neighbor cell contacts between the different classes of polygons using the binomial expansion derived from their relative frequencies, and calculating the probability that such cellular arrangement could be due to chance alone using the Student t-test and Chi-Square formulas. 3. RESULTS 3.1. Pentgonal Symmetry of Normal and Immortalized Human Keratinocyte Colonies Figure 3(a) is a typical low power (10× phase objec- tive close packed space filling array)) phase contrast photomicrograph of a rapidly dividing NHK cells sev- eral days after seeding at 3 × 10³ cells/cm2 into SFM. It 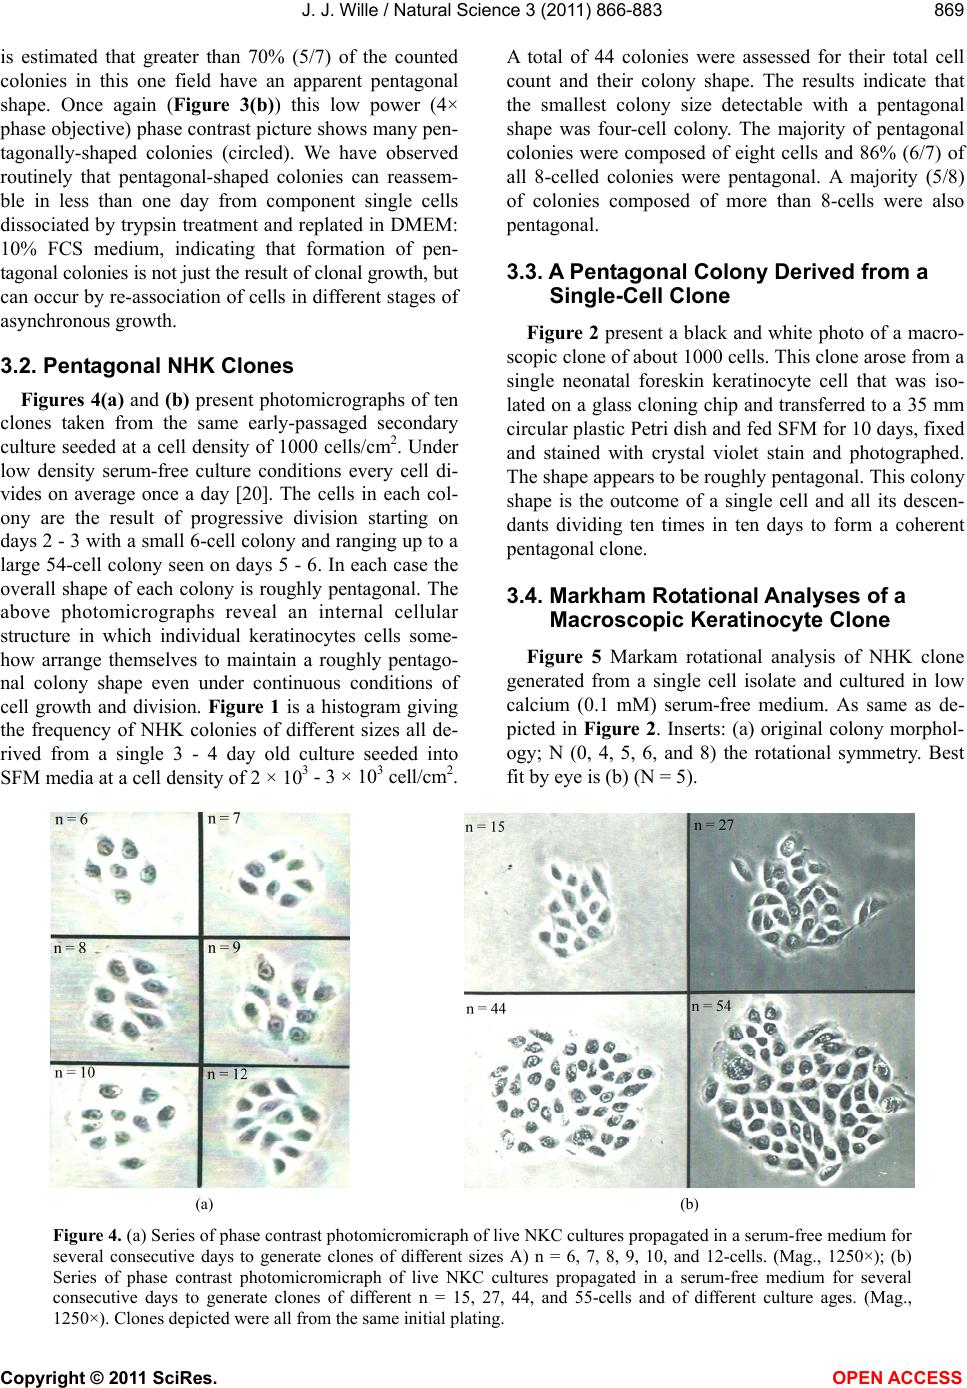 J. J. Wille / Natural Science 3 (2011) 866-883 Copyright © 2011 SciRes. OPEN ACCESS 869 869 is estimated that greater than 70% (5/7) of the counted colonies in this one field have an apparent pentagonal shape. Once again (Figure 3(b)) this low power (4× phase objective) phase contrast picture shows many pen- tagonally-shaped colonies (circled). We have observed routinely that pentagonal-shaped colonies can reassem- ble in less than one day from component single cells dissociated by trypsin treatment and replated in DMEM: 10% FCS medium, indicating that formation of pen- tagonal colonies is not just the result of clonal growth, but can occur by re-association of cells in different stages of asynchronous growth. 3.2. Pentagonal NHK Clones Figures 4(a) and (b) present photomicrographs of ten clones taken from the same early-passaged secondary culture seeded at a cell density of 1000 cells/cm2. Under low density serum-free culture conditions every cell di- vides on average once a day [20]. The cells in each col- ony are the result of progressive division starting on days 2 - 3 with a small 6-cell colony and ranging up to a large 54-cell colony seen on days 5 - 6. In each case the overall shape of each colony is roughly pentagonal. The above photomicrographs reveal an internal cellular structure in which individual keratinocytes cells some- how arrange themselves to maintain a roughly pentago- nal colony shape even under continuous conditions of cell growth and division. Figure 1 is a histogram giving the frequency of NHK colonies of different sizes all de- rived from a single 3 - 4 day old culture seeded into SFM media at a cell density of 2 × 10³ - 3 × 10³ cell/cm2. A total of 44 colonies were assessed for their total cell count and their colony shape. The results indicate that the smallest colony size detectable with a pentagonal shape was four-cell colony. The majority of pentagonal colonies were composed of eight cells and 86% (6/7) of all 8-celled colonies were pentagonal. A majority (5/8) of colonies composed of more than 8-cells were also pentagonal. 3.3. A Pentagonal Colony Derived from a Single-Cell Clone Figure 2 present a black and white photo of a macro- scopic clone of about 1000 cells. This clone arose from a single neonatal foreskin keratinocyte cell that was iso- lated on a glass cloning chip and transferred to a 35 mm circular plastic Petri dish and fed SFM for 10 days, fixed and stained with crystal violet stain and photographed. The shape appears to be roughly pentagonal. This colony shape is the outcome of a single cell and all its descen- dants dividing ten times in ten days to form a coherent pentagonal clone. 3.4. Markham Rotational Analyses of a Macroscopic Keratinocyte Clone Figure 5 Markam rotational analysis of NHK clone generated from a single cell isolate and cultured in low calcium (0.1 mM) serum-free medium. As same as de- picted in Figure 2. Inserts: (a) original colony morphol- ogy; N (0, 4, 5, 6, and 8) the rotational symmetry. Best fit by eye is (b) (N = 5). (a) (b) Figure 4. (a) Series of phase contrast photomicromicraph of live NKC cultures propagated in a serum-free medium for several consecutive days to generate clones of different sizes A) n = 6, 7, 8, 9, 10, and 12-cells. (Mag., 1250×); (b) Series of phase contrast photomicromicraph of live NKC cultures propagated in a serum-free medium for several consecutive days to generate clones of different n = 15, 27, 44, and 55-cells and of different culture ages. (Mag., 1250×). Clones depicted were all from the same initial plating. 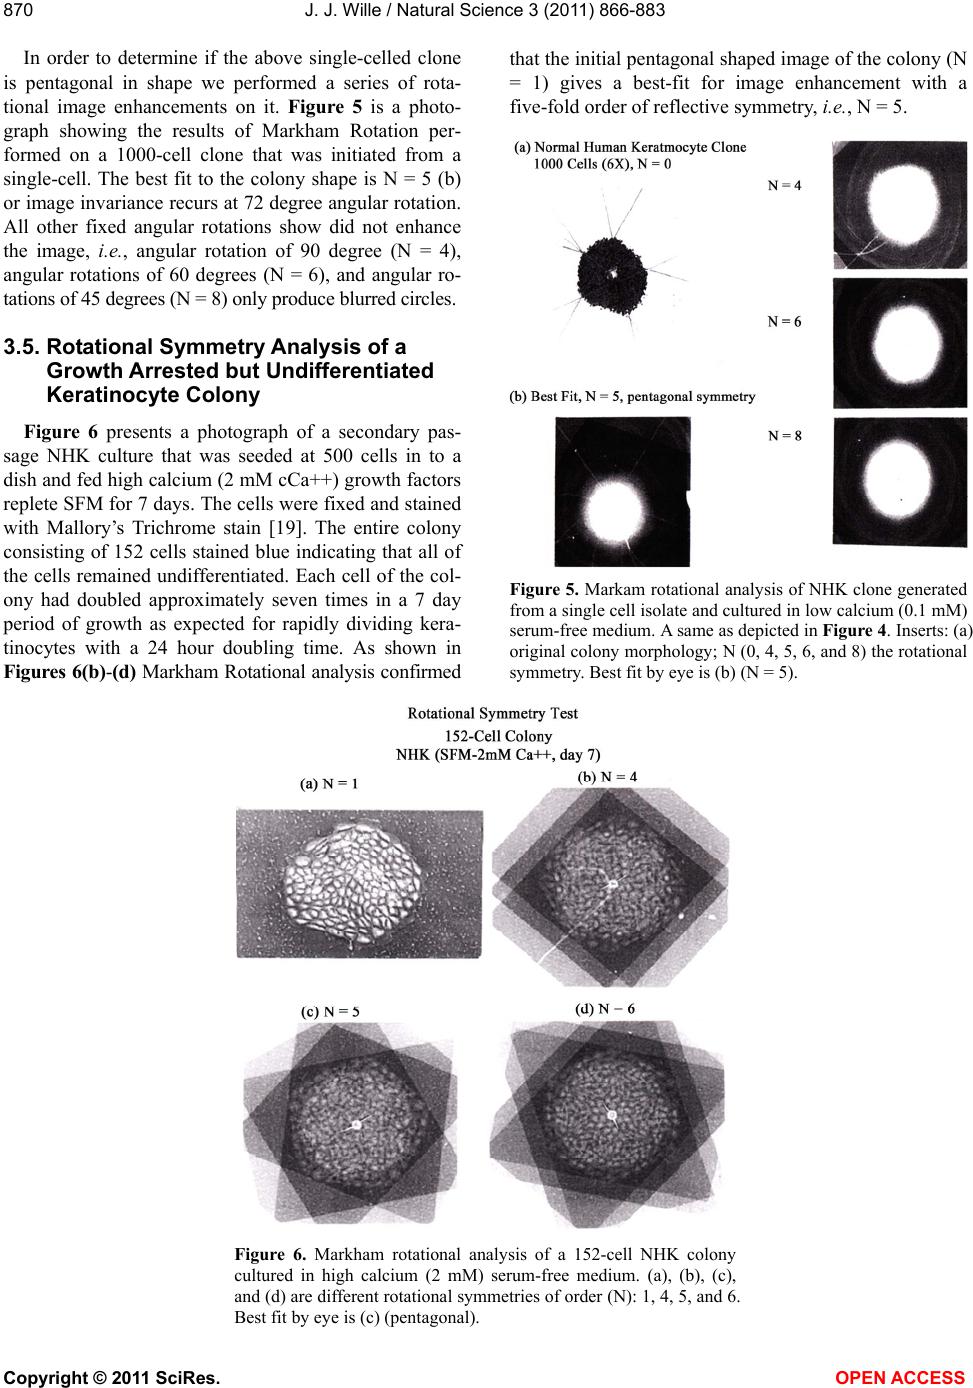 J. J. Wille / Natural Science 3 (2011) 866-883 Copyright © 2011 SciRes. OPEN ACCESS 870 In order to determine if the above single-celled clone is pentagonal in shape we performed a series of rota- tional image enhancements on it. Figure 5 is a photo- graph showing the results of Markham Rotation per- formed on a 1000-cell clone that was initiated from a single-cell. The best fit to the colony shape is N = 5 (b) or image invariance recurs at 72 degree angular rotation. All other fixed angular rotations show did not enhance the image, i.e., angular rotation of 90 degree (N = 4), angular rotations of 60 degrees (N = 6), and angular ro- tations of 45 degrees (N = 8) only produce blurred circles. 3.5. Rotational Symmetry Analysis of a Growth Arrested but Undifferentiated Keratinocyte Colony Figure 6 presents a photograph of a secondary pas- sage NHK culture that was seeded at 500 cells in to a dish and fed high calcium (2 mM cCa++) growth factors replete SFM for 7 days. The cells were fixed and stained with Mallory’s Trichrome stain [19]. The entire colony consisting of 152 cells stained blue indicating that all of the cells remained undifferentiated. Each cell of the col- ony had doubled approximately seven times in a 7 day period of growth as expected for rapidly dividing kera- tinocytes with a 24 hour doubling time. As shown in Figures 6(b)-(d) Markham Rotational analysis confirmed that the initial pentagonal shaped image of the colony (N = 1) gives a best-fit for image enhancement with a five-fold order of reflective symmetry, i.e., N = 5. Figure 5. Markam rotational analysis of NHK clone generated from a single cell isolate and cultured in low calcium (0.1 mM) serum-free medium. A same as depicted in Figure 4. Inserts: (a) original colony morphology; N (0, 4, 5, 6, and 8) the rotational symmetry. Best fit by eye is (b) (N = 5). Figure 6. Markham rotational analysis of a 152-cell NHK colony cultured in high calcium (2 mM) serum-free medium. (a), (b), (c), and (d) are different rotational symmetries of order (N): 1, 4, 5, and 6. Best fit by eye is (c) (pentagonal). 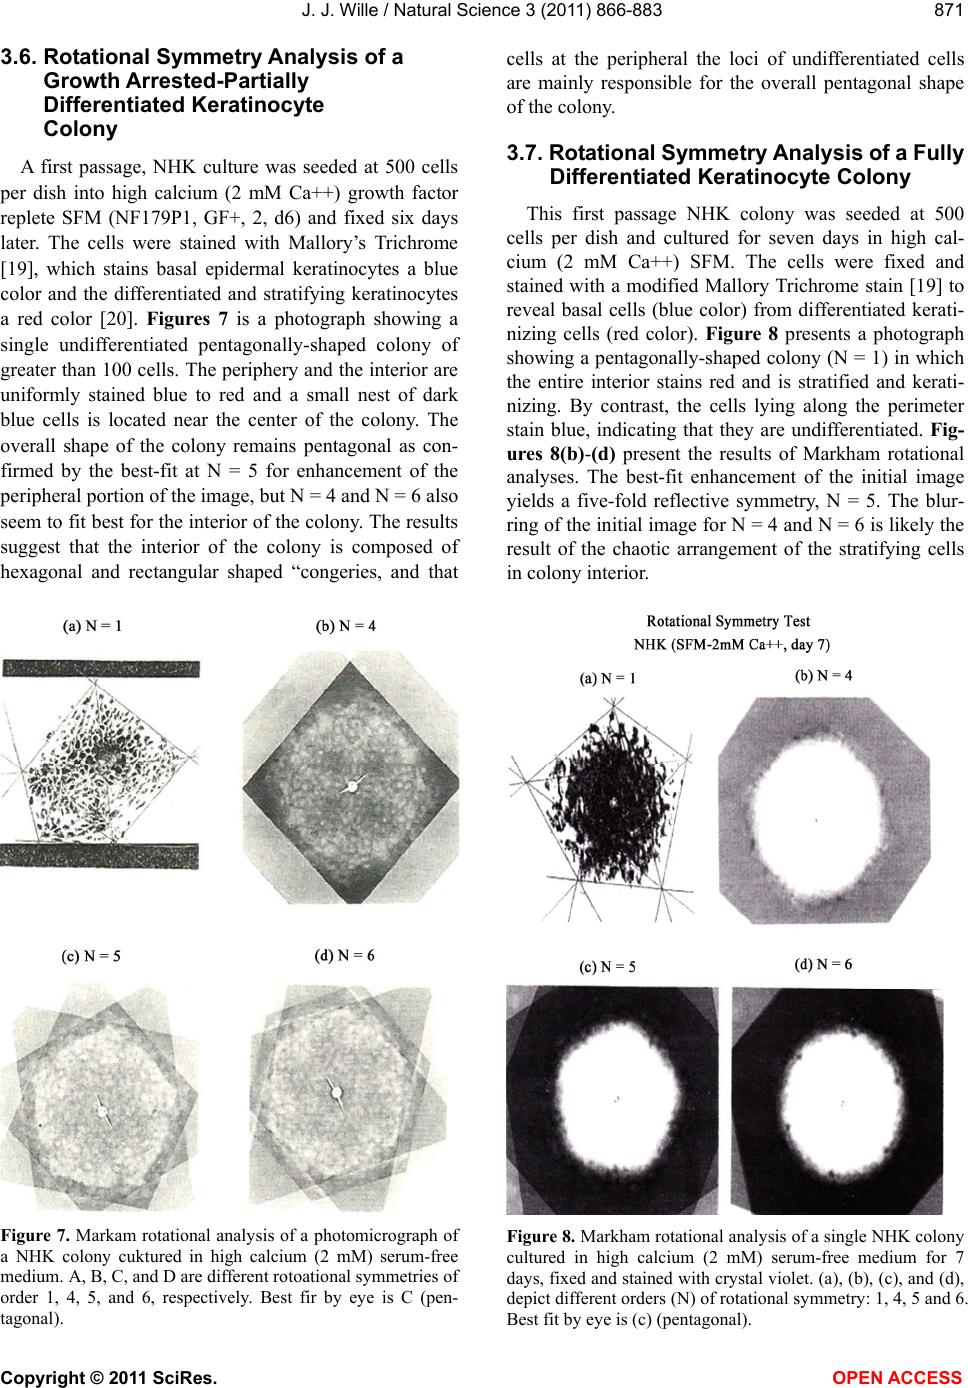 J. J. Wille / Natural Science 3 (2011) 866-883 Copyright © 2011 SciRes. OPEN ACCESS 871 871 3.6. Rotational Symmetry Analysis of a Growth Arrested-Partially Differentiated Keratinocyte Colony A first passage, NHK culture was seeded at 500 cells per dish into high calcium (2 mM Ca++) growth factor replete SFM (NF179P1, GF+, 2, d6) and fixed six days later. The cells were stained with Mallory’s Trichrome [19], which stains basal epidermal keratinocytes a blue color and the differentiated and stratifying keratinocytes a red color [20]. Figures 7 is a photograph showing a single undifferentiated pentagonally-shaped colony of greater than 100 cells. The periphery and the interior are uniformly stained blue to red and a small nest of dark blue cells is located near the center of the colony. The overall shape of the colony remains pentagonal as con- firmed by the best-fit at N = 5 for enhancement of the peripheral portion of the image, but N = 4 and N = 6 also seem to fit best for the interior of the colony. The results suggest that the interior of the colony is composed of hexagonal and rectangular shaped “congeries, and that cells at the peripheral the loci of undifferentiated cells are mainly responsible for the overall pentagonal shape of the colony. 3.7. Rotational Symmetry Analysis of a Fully Differentiated Keratinocyte Colony This first passage NHK colony was seeded at 500 cells per dish and cultured for seven days in high cal- cium (2 mM Ca++) SFM. The cells were fixed and stained with a modified Mallory Trichrome stain [19] to reveal basal cells (blue color) from differentiated kerati- nizing cells (red color). Figure 8 presents a photograph showing a pentagonally-shaped colony (N = 1) in which the entire interior stains red and is stratified and kerati- nizing. By contrast, the cells lying along the perimeter stain blue, indicating that they are undifferentiated. Fig- ures 8(b)-(d) present the results of Markham rotational analyses. The best-fit enhancement of the initial image yields a five-fold reflective symmetry, N = 5. The blur- ring of the initial image for N = 4 and N = 6 is likely the result of the chaotic arrangement of the stratifying cells in colony interior. Figure 7. Markam rotational analysis of a photomicrograph of a NHK colony cuktured in high calcium (2 mM) serum-free medium. A, B, C, and D are different rotoational symmetries of order 1, 4, 5, and 6, respectively. Best fir by eye is C (pen- tagonal). Figure 8. Markham rotational analysis of a single NHK colony cultured in high calcium (2 mM) serum-free medium for 7 days, fixed and stained with crystal violet. (a), (b), (c), and (d), depict different orders (N) of rotational symmetry: 1, 4, 5 and 6. Best fit by eye is (c) (pentagonal). 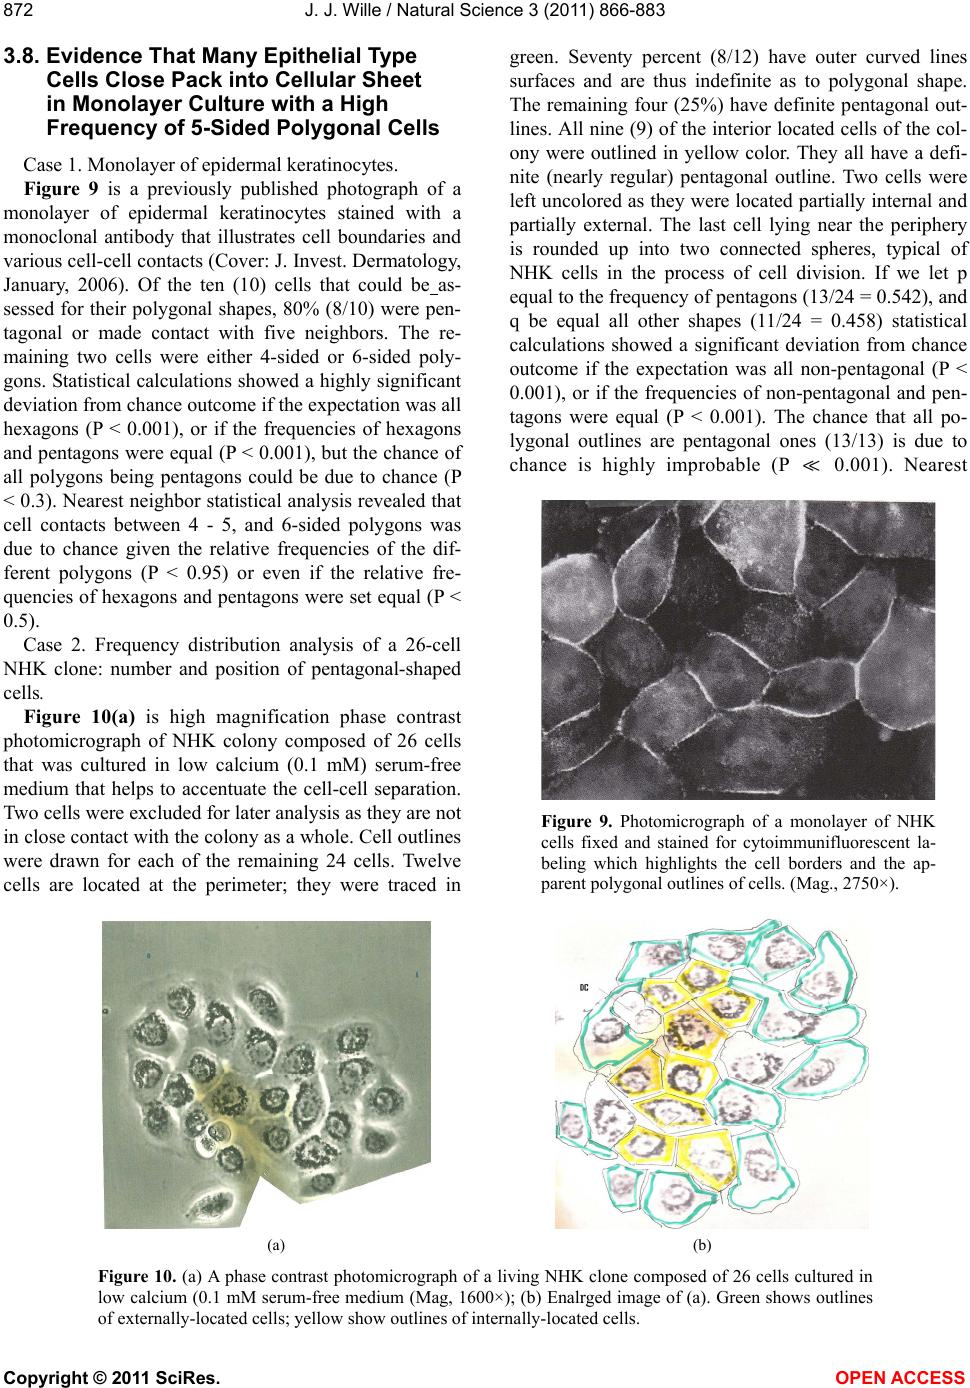 J. J. Wille / Natural Science 3 (2011) 866-883 Copyright © 2011 SciRes. OPEN ACCESS 872 3.8. Evidence That Many Epithelial Type Cells Close Pack into Cellular Sheet in Monolayer Culture with a High Frequency of 5-Sided Polygonal Cells Case 1. Monolayer of epidermal keratinocytes. Figure 9 is a previously published photograph of a monolayer of epidermal keratinocytes stained with a monoclonal antibody that illustrates cell boundaries and various cell-cell contacts (Cover: J. Invest. Dermatology, January, 2006). Of the ten (10) cells that could be as- sessed for their polygonal shapes, 80% (8/10) were pen- tagonal or made contact with five neighbors. The re- maining two cells were either 4-sided or 6-sided poly- gons. Statistical calculations showed a highly significant deviation from chance outcome if the expectation was all hexagons (P < 0.001), or if the frequencies of hexagons and pentagons were equal (P < 0.001), but the chance of all polygons being pentagons could be due to chance (P < 0.3). Nearest neighbor statistical analysis revealed that cell contacts between 4 - 5, and 6-sided polygons was due to chance given the relative frequencies of the dif- ferent polygons (P < 0.95) or even if the relative fre- quencies of hexagons and pentagons were set equal (P < 0.5). Case 2. Frequency distribution analysis of a 26-cell NHK clone: number and position of pentagonal-shaped cells. Figure 10(a) is high magnification phase contrast photomicrograph of NHK colony composed of 26 cells that was cultured in low calcium (0.1 mM) serum-free medium that helps to accentuate the cell-cell separation. Two cells were excluded for later analysis as they are not in close contact with the colony as a whole. Cell outlines were drawn for each of the remaining 24 cells. Twelve cells are located at the perimeter; they were traced in green. Seventy percent (8/12) have outer curved lines surfaces and are thus indefinite as to polygonal shape. The remaining four (25%) have definite pentagonal out- lines. All nine (9) of the interior located cells of the col- ony were outlined in yellow color. They all have a defi- nite (nearly regular) pentagonal outline. Two cells were left uncolored as they were located partially internal and partially external. The last cell lying near the periphery is rounded up into two connected spheres, typical of NHK cells in the process of cell division. If we let p equal to the frequency of pentagons (13/24 = 0.542), and q be equal all other shapes (11/24 = 0.458) statistical calculations showed a significant deviation from chance outcome if the expectation was all non-pentagonal (P < 0.001), or if the frequencies of non-pentagonal and pen- tagons were equal (P < 0.001). The chance that all po- lygonal outlines are pentagonal ones (13/13) is due to chance is highly improbable (P 0.001). Nearest Figure 9. Photomicrograph of a monolayer of NHK cells fixed and stained for cytoimmunifluorescent la- beling which highlights the cell borders and the ap- parent polygonal outlines of cells. (Mag., 2750×). (a) (b) Figure 10. (a) A phase contrast photomicrograph of a living NHK clone composed of 26 cells cultured in low calcium (0.1 mM serum-free medium (Mag, 1600×); (b) Enalrged image of (a). Green shows outlines of externally-located cells; yellow show outlines of internally-located cells. 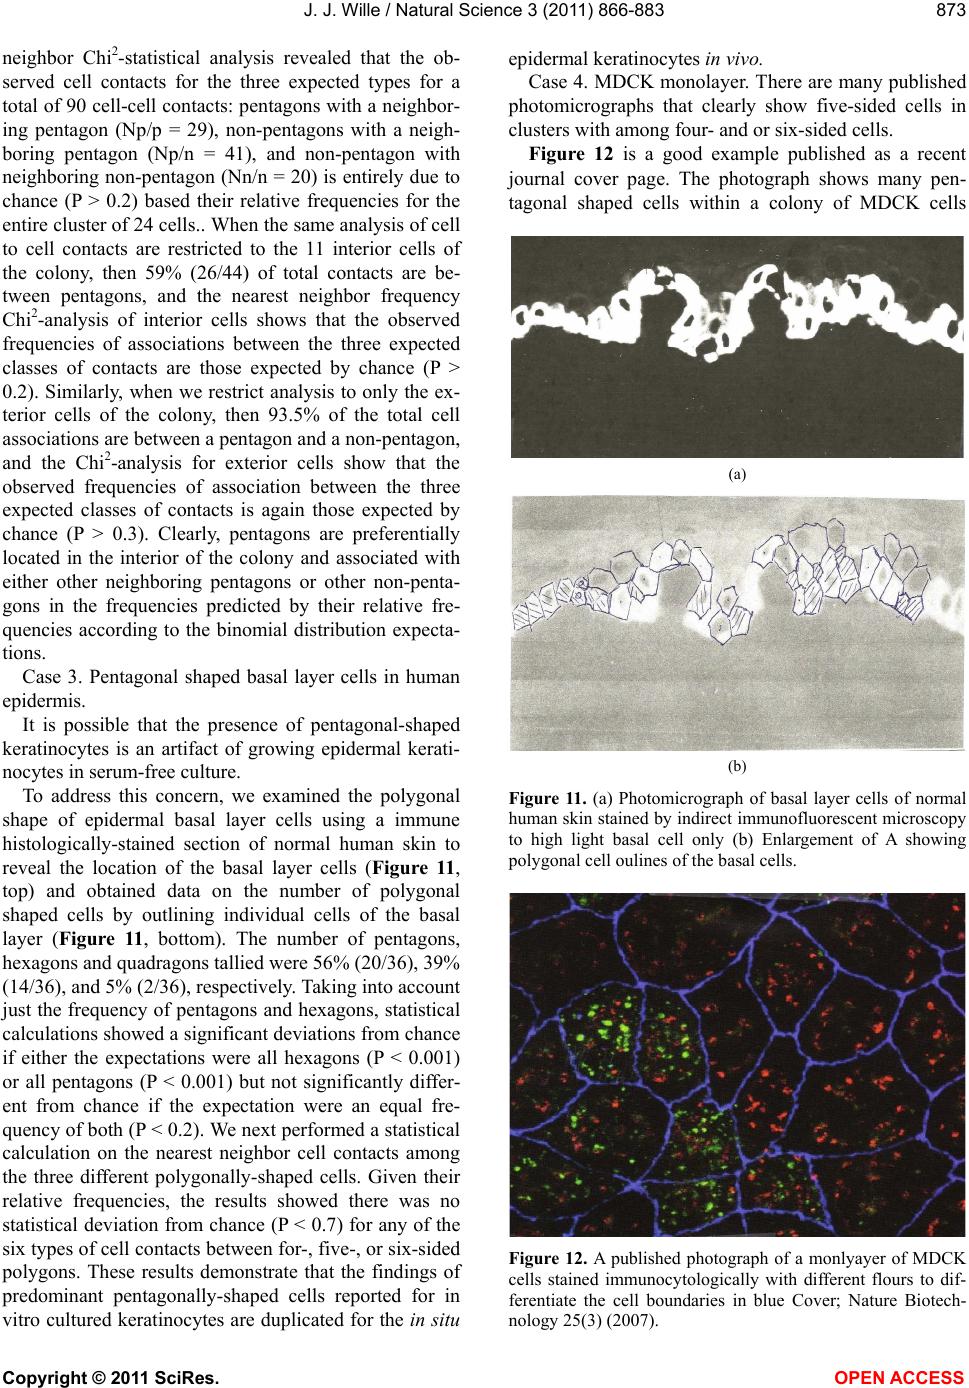 J. J. Wille / Natural Science 3 (2011) 866-883 Copyright © 2011 SciRes. OPEN ACCESS 873 873 neighbor Chi2-statistical analysis revealed that the ob- served cell contacts for the three expected types for a total of 90 cell-cell contacts: pentagons with a neighbor- ing pentagon (Np/p = 29), non-pentagons with a neigh- boring pentagon (Np/n = 41), and non-pentagon with neighboring non-pentagon (Nn/n = 20) is entirely due to chance (P > 0.2) based their relative frequencies for the entire cluster of 24 cells.. When the same analysis of cell to cell contacts are restricted to the 11 interior cells of the colony, then 59% (26/44) of total contacts are be- tween pentagons, and the nearest neighbor frequency Chi2-analysis of interior cells shows that the observed frequencies of associations between the three expected classes of contacts are those expected by chance (P > 0.2). Similarly, when we restrict analysis to only the ex- terior cells of the colony, then 93.5% of the total cell associations are between a pentagon and a non-pentagon, and the Chi2-analysis for exterior cells show that the observed frequencies of association between the three expected classes of contacts is again those expected by chance (P > 0.3). Clearly, pentagons are preferentially located in the interior of the colony and associated with either other neighboring pentagons or other non-penta- gons in the frequencies predicted by their relative fre- quencies according to the binomial distribution expecta- tions. Case 3. Pentagonal shaped basal layer cells in human epidermis. It is possible that the presence of pentagonal-shaped keratinocytes is an artifact of growing epidermal kerati- nocytes in serum-free culture. To address this concern, we examined the polygonal shape of epidermal basal layer cells using a immune histologically-stained section of normal human skin to reveal the location of the basal layer cells (Figure 11, top) and obtained data on the number of polygonal shaped cells by outlining individual cells of the basal layer (Figure 11, bottom). The number of pentagons, hexagons and quadragons tallied were 56% (20/36), 39% (14/36), and 5% (2/36), respectively. Taking into account just the frequency of pentagons and hexagons, statistical calculations showed a significant deviations from chance if either the expectations were all hexagons (P < 0.001) or all pentagons (P < 0.001) but not significantly differ- ent from chance if the expectation were an equal fre- quency of both (P < 0.2). We next performed a statistical calculation on the nearest neighbor cell contacts among the three different polygonally-shaped cells. Given their relative frequencies, the results showed there was no statistical deviation from chance (P < 0.7) for any of the six types of cell contacts between for-, five-, or six-sided polygons. These results demonstrate that the findings of predominant pentagonally-shaped cells reported for in vitro cultured keratinocytes are duplicated for the in situ epidermal keratinocytes in vivo. Case 4. MDCK monolayer. There are many published photomicrographs that clearly show five-sided cells in clusters with among four- and or six-sided cells. Figure 12 is a good example published as a recent journal cover page. The photograph shows many pen- tagonal shaped cells within a colony of MDCK cells (a) (b) Figure 11. (a) Photomicrograph of basal layer cells of normal human skin stained by indirect immunofluorescent microscopy to high light basal cell only (b) Enlargement of A showing polygonal cell oulines of the basal cells. Figure 12. A published photograph of a monlyayer of MDCK cells stained immunocytologically with different flours to dif- ferentiate the cell boundaries in blue Cover; Nature Biotech- nology 25(3) (2007). 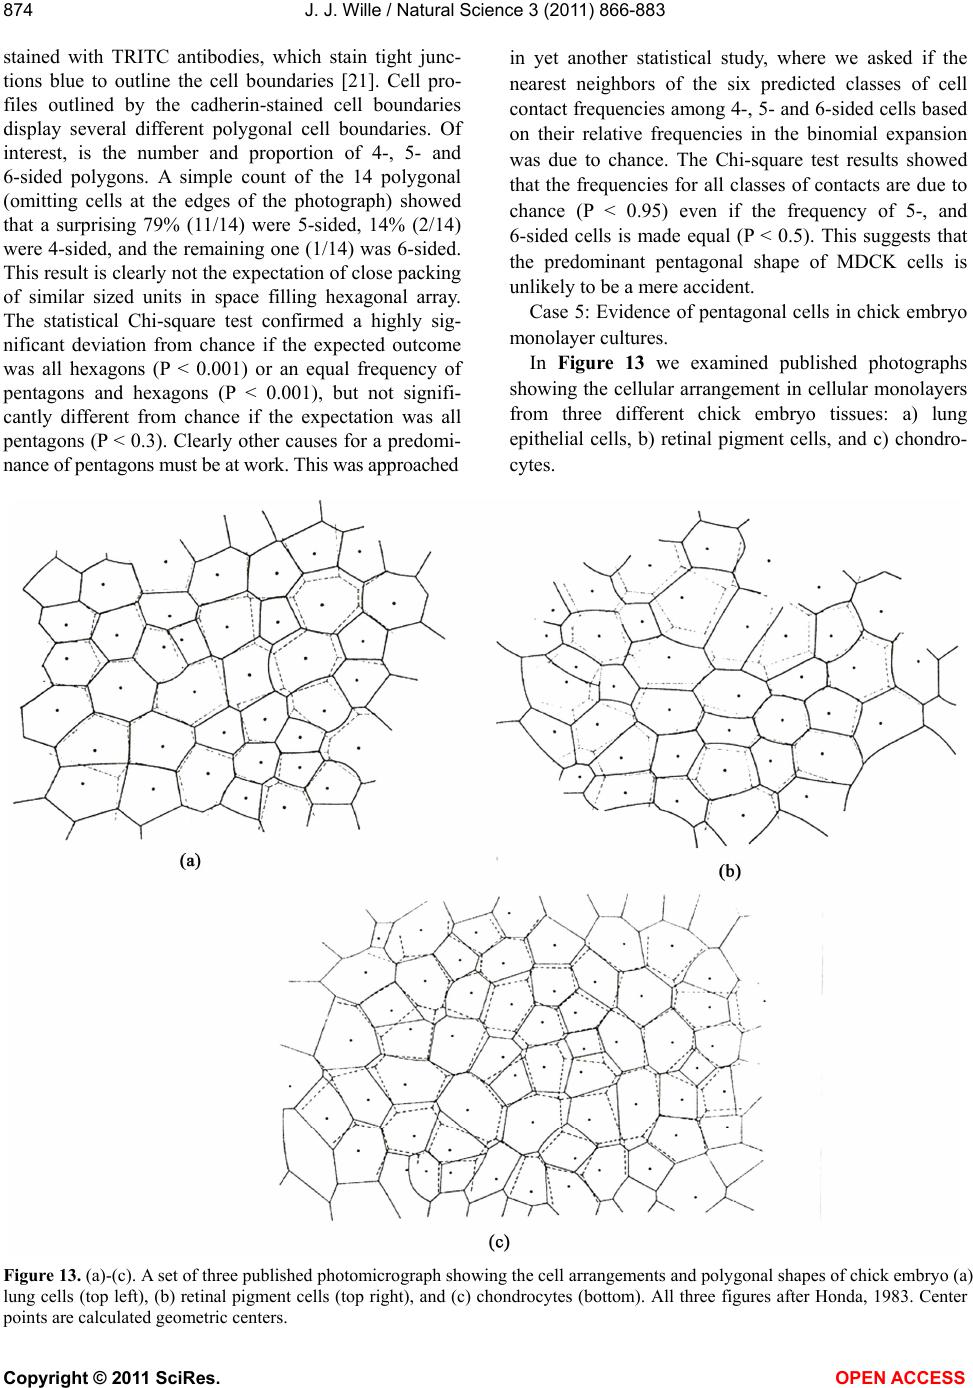 J. J. Wille / Natural Science 3 (2011) 866-883 Copyright © 2011 SciRes. OPEN ACCESS 874 stained with TRITC antibodies, which stain tight junc- tions blue to outline the cell boundaries [21]. Cell pro- files outlined by the cadherin-stained cell boundaries display several different polygonal cell boundaries. Of interest, is the number and proportion of 4-, 5- and 6-sided polygons. A simple count of the 14 polygonal (omitting cells at the edges of the photograph) showed that a surprising 79% (11/14) were 5-sided, 14% (2/14) were 4-sided, and the remaining one (1/14) was 6-sided. This result is clearly not the expectation of close packing of similar sized units in space filling hexagonal array. The statistical Chi-square test confirmed a highly sig- nificant deviation from chance if the expected outcome was all hexagons (P < 0.001) or an equal frequency of pentagons and hexagons (P < 0.001), but not signifi- cantly different from chance if the expectation was all pentagons (P < 0.3). Clearly other causes for a predomi- nance of pentagons must be at work. This was approached in yet another statistical study, where we asked if the nearest neighbors of the six predicted classes of cell contact frequencies among 4-, 5- and 6-sided cells based on their relative frequencies in the binomial expansion was due to chance. The Chi-square test results showed that the frequencies for all classes of contacts are due to chance (P < 0.95) even if the frequency of 5-, and 6-sided cells is made equal (P < 0.5). This suggests that the predominant pentagonal shape of MDCK cells is unlikely to be a mere accident. Case 5: Evidence of pentagonal cells in chick embryo monolayer cultures. In Figure 13 we examined published photographs showing the cellular arrangement in cellular monolayers from three different chick embryo tissues: a) lung epithelial cells, b) retinal pigment cells, and c) chondro- cytes. Figure 13. (a)-(c). A set of three published photomicrograph showing the cell arrangements and polygonal shapes of chick embryo (a) lung cells (top left), (b) retinal pigment cells (top right), and (c) chondrocytes (bottom). All three figures after Honda, 1983. Center points are calculated geometric centers. 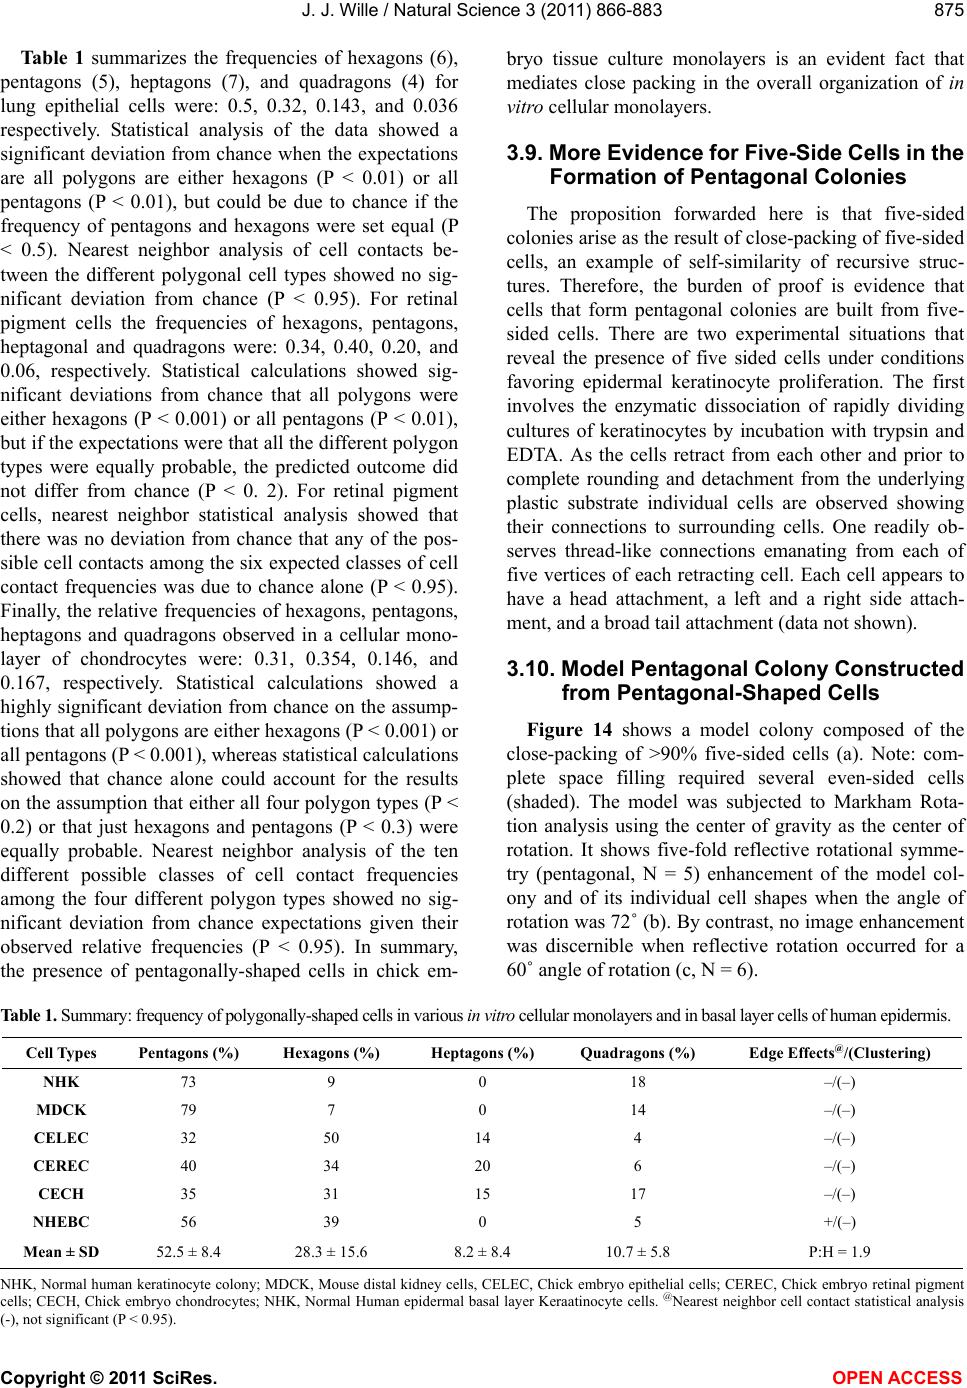 J. J. Wille / Natural Science 3 (2011) 866-883 Copyright © 2011 SciRes. OPEN ACCESS 875 875 Table 1 summarizes the frequencies of hexagons (6), pentagons (5), heptagons (7), and quadragons (4) for lung epithelial cells were: 0.5, 0.32, 0.143, and 0.036 respectively. Statistical analysis of the data showed a significant deviation from chance when the expectations are all polygons are either hexagons (P < 0.01) or all pentagons (P < 0.01), but could be due to chance if the frequency of pentagons and hexagons were set equal (P < 0.5). Nearest neighbor analysis of cell contacts be- tween the different polygonal cell types showed no sig- nificant deviation from chance (P < 0.95). For retinal pigment cells the frequencies of hexagons, pentagons, heptagonal and quadragons were: 0.34, 0.40, 0.20, and 0.06, respectively. Statistical calculations showed sig- nificant deviations from chance that all polygons were either hexagons (P < 0.001) or all pentagons (P < 0.01), but if the expectations were that all the different polygon types were equally probable, the predicted outcome did not differ from chance (P < 0. 2). For retinal pigment cells, nearest neighbor statistical analysis showed that there was no deviation from chance that any of the pos- sible cell contacts among the six expected classes of cell contact frequencies was due to chance alone (P < 0.95). Finally, the relative frequencies of hexagons, pentagons, heptagons and quadragons observed in a cellular mono- layer of chondrocytes were: 0.31, 0.354, 0.146, and 0.167, respectively. Statistical calculations showed a highly significant deviation from chance on the assump- tions that all polygons are either hexagons (P < 0.001) or all pentagons (P < 0.001), whereas statistical calculations showed that chance alone could account for the results on the assumption that either all four polygon types (P < 0.2) or that just hexagons and pentagons (P < 0.3) were equally probable. Nearest neighbor analysis of the ten different possible classes of cell contact frequencies among the four different polygon types showed no sig- nificant deviation from chance expectations given their observed relative frequencies (P < 0.95). In summary, the presence of pentagonally-shaped cells in chick em- bryo tissue culture monolayers is an evident fact that mediates close packing in the overall organization of in vitro cellular monolayers. 3.9. More Evidence for Five-Side Cells in the Formation of Pentagonal Colonies The proposition forwarded here is that five-sided colonies arise as the result of close-packing of five-sided cells, an example of self-similarity of recursive struc- tures. Therefore, the burden of proof is evidence that cells that form pentagonal colonies are built from five- sided cells. There are two experimental situations that reveal the presence of five sided cells under conditions favoring epidermal keratinocyte proliferation. The first involves the enzymatic dissociation of rapidly dividing cultures of keratinocytes by incubation with trypsin and EDTA. As the cells retract from each other and prior to complete rounding and detachment from the underlying plastic substrate individual cells are observed showing their connections to surrounding cells. One readily ob- serves thread-like connections emanating from each of five vertices of each retracting cell. Each cell appears to have a head attachment, a left and a right side attach- ment, and a broad tail attachment (data not shown). 3.10. Model Pentagonal Colony Constructed from Pentagonal-Shaped Cells Figure 14 shows a model colony composed of the close-packing of >90% five-sided cells (a). Note: com- plete space filling required several even-sided cells (shaded). The model was subjected to Markham Rota- tion analysis using the center of gravity as the center of rotation. It shows five-fold reflective rotational symme- try (pentagonal, N = 5) enhancement of the model col- ony and of its individual cell shapes when the angle of rotation was 72˚ (b). By contrast, no image enhancement was discernible when reflective rotation occurred for a 60˚ angle of rotation (c, N = 6). Table 1. Summary: frequency of polygonally-shaped cells in various in vitro cellular monolayers and in basal layer cells of human epidermis. Cell Types Pentagons (%) Hexagons (%) Heptagons (%) Quadragons (%) Edge Effects@/(Clustering) NHK 73 9 0 18 –/(–) MDCK 79 7 0 14 –/(–) CELEC 32 50 14 4 –/(–) CEREC 40 34 20 6 –/(–) CECH 35 31 15 17 –/(–) NHEBC 56 39 0 5 +/(–) Mean ± SD 52.5 ± 8.4 28.3 ± 15.6 8.2 ± 8.4 10.7 ± 5.8 P:H = 1.9 NHK, Normal human keratinocyte colony; MDCK, Mouse distal kidney cells, CELEC, Chick embryo epithelial cells; CEREC, Chick embryo retinal pigment cells; CECH, Chick embryo chondrocytes; NHK, Normal Human epidermal basal layer Keraatinocyte cells. @Nearest neighbor cell contact statistical analysis (-), not significant (P < 0.95). 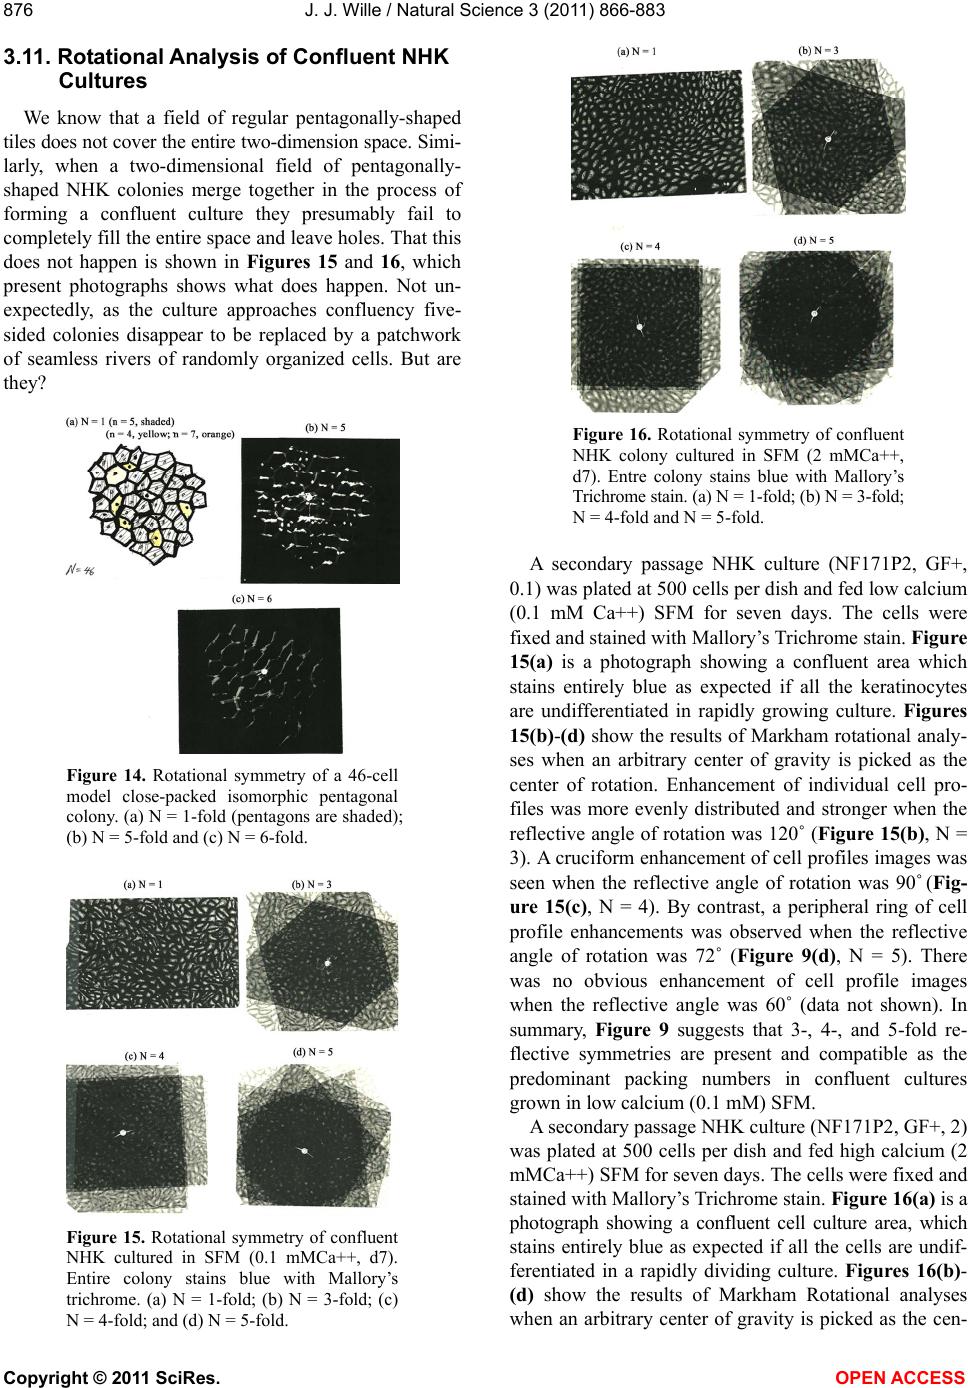 J. J. Wille / Natural Science 3 (2011) 866-883 Copyright © 2011 SciRes. OPEN ACCESS 876 3.11. Rotational Analysis of Confluent NHK Cultures We know that a field of regular pentagonally-shaped tiles does not cover the entire two-dimension space. Simi- larly, when a two-dimensional field of pentagonally- shaped NHK colonies merge together in the process of forming a confluent culture they presumably fail to completely fill the entire space and leave holes. That this does not happen is shown in Figures 15 and 16, which present photographs shows what does happen. Not un- expectedly, as the culture approaches confluency five- sided colonies disappear to be replaced by a patchwork of seamless rivers of randomly organized cells. But are they? Figure 14. Rotational symmetry of a 46-cell model close-packed isomorphic pentagonal colony. (a) N = 1-fold (pentagons are shaded); (b) N = 5-fold and (c) N = 6-fold. Figure 15. Rotational symmetry of confluent NHK cultured in SFM (0.1 mMCa++, d7). Entire colony stains blue with Mallory’s trichrome. (a) N = 1-fold; (b) N = 3-fold; (c) N = 4-fold; and (d) N = 5-fold. Figure 16. Rotational symmetry of confluent NHK colony cultured in SFM (2 mMCa++, d7). Entre colony stains blue with Mallory’s Trichrome stain. (a) N = 1-fold; (b) N = 3-fold; N = 4-fold and N = 5-fold. A secondary passage NHK culture (NF171P2, GF+, 0.1) was plated at 500 cells per dish and fed low calcium (0.1 mM Ca++) SFM for seven days. The cells were fixed and stained with Mallory’s Trichrome stain. Figure 15(a) is a photograph showing a confluent area which stains entirely blue as expected if all the keratinocytes are undifferentiated in rapidly growing culture. Figures 15(b)-(d) show the results of Markham rotational analy- ses when an arbitrary center of gravity is picked as the center of rotation. Enhancement of individual cell pro- files was more evenly distributed and stronger when the reflective angle of rotation was 120˚ (Figure 15(b), N = 3). A cruciform enhancement of cell profiles images was seen when the reflective angle of rotation was 90˚ (Fig- ure 15(c), N = 4). By contrast, a peripheral ring of cell profile enhancements was observed when the reflective angle of rotation was 72˚ (Figure 9(d), N = 5). There was no obvious enhancement of cell profile images when the reflective angle was 60˚ (data not shown). In summary, Figure 9 suggests that 3-, 4-, and 5-fold re- flective symmetries are present and compatible as the predominant packing numbers in confluent cultures grown in low calcium (0.1 mM) SFM. A secondary passage NHK culture (NF171P2, GF+, 2) was plated at 500 cells per dish and fed high calcium (2 mMCa++) SFM for seven days. The cells were fixed and stained with Mallory’s Trichrome stain. Figure 16(a) is a photograph showing a confluent cell culture area, which stains entirely blue as expected if all the cells are undif- ferentiated in a rapidly dividing culture. Figures 16(b)- (d) show the results of Markham Rotational analyses when an arbitrary center of gravity is picked as the cen- 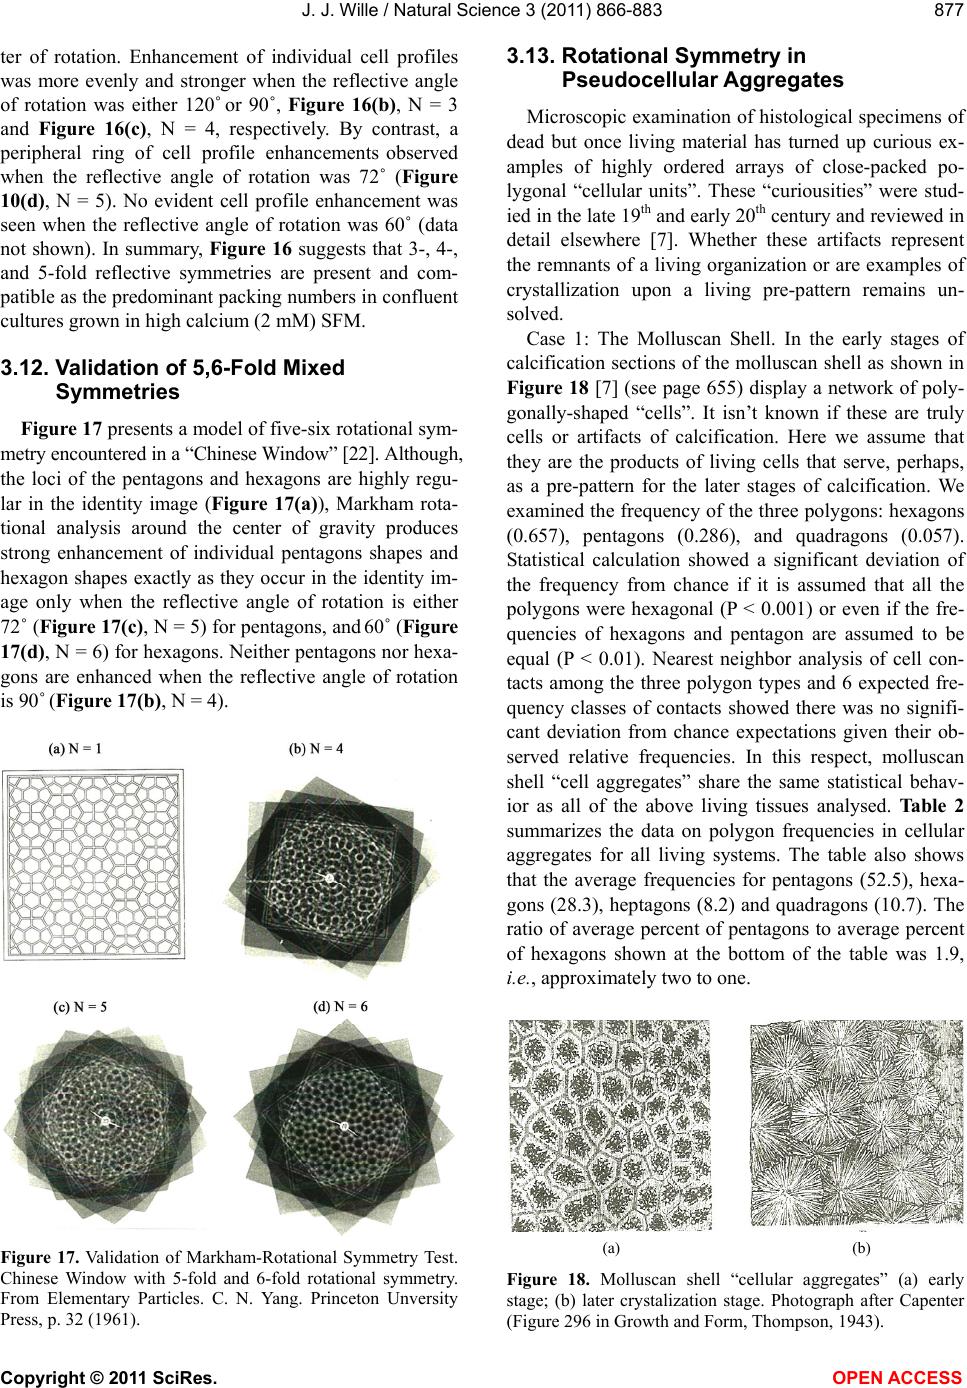 J. J. Wille / Natural Science 3 (2011) 866-883 Copyright © 2011 SciRes. OPEN ACCESS 877 877 ter of rotation. Enhancement of individual cell profiles was more evenly and stronger when the reflective angle of rotation was either 120˚ or 90˚, Figure 16(b), N = 3 and Figure 16(c), N = 4, respectively. By contrast, a peripheral ring of cell profile enhancements observed when the reflective angle of rotation was 72˚ (Figure 10(d), N = 5). No evident cell profile enhancement was seen when the reflective angle of rotation was 60˚ (data not shown). In summary, Figure 16 suggests that 3-, 4-, and 5-fold reflective symmetries are present and com- patible as the predominant packing numbers in confluent cultures grown in high calcium (2 mM) SFM. 3.12. Validation of 5,6-Fold Mixed Symmetries Figure 17 presents a model of five-six rotational sym- metry encountered in a “Chinese Window” [22]. Although, the loci of the pentagons and hexagons are highly regu- lar in the identity image (Figure 17(a)), Markham rota- tional analysis around the center of gravity produces strong enhancement of individual pentagons shapes and hexagon shapes exactly as they occur in the identity im- age only when the reflective angle of rotation is either 72˚ (Figure 17(c), N = 5) for pentagons, and 60˚ (Figure 17(d), N = 6) for hexagons. Neither pentagons nor hexa- gons are enhanced when the reflective angle of rotation is 90˚ (Figure 17(b), N = 4). Figure 17. Validation of Markham-Rotational Symmetry Test. Chinese Window with 5-fold and 6-fold rotational symmetry. From Elementary Particles. C. N. Yang. Princeton Unversity Press, p. 32 (1961). 3.13. Rotational Symmetry in Pseudocellular Aggregates Microscopic examination of histological specimens of dead but once living material has turned up curious ex- amples of highly ordered arrays of close-packed po- lygonal “cellular units”. These “curiousities” were stud- ied in the late 19th and early 20th century and reviewed in detail elsewhere [7]. Whether these artifacts represent the remnants of a living organization or are examples of crystallization upon a living pre-pattern remains un- solved. Case 1: The Molluscan Shell. In the early stages of calcification sections of the molluscan shell as shown in Figure 18 [7] (see page 655) display a network of poly- gonally-shaped “cells”. It isn’t known if these are truly cells or artifacts of calcification. Here we assume that they are the products of living cells that serve, perhaps, as a pre-pattern for the later stages of calcification. We examined the frequency of the three polygons: hexagons (0.657), pentagons (0.286), and quadragons (0.057). Statistical calculation showed a significant deviation of the frequency from chance if it is assumed that all the polygons were hexagonal (P < 0.001) or even if the fre- quencies of hexagons and pentagon are assumed to be equal (P < 0.01). Nearest neighbor analysis of cell con- tacts among the three polygon types and 6 expected fre- quency classes of contacts showed there was no signifi- cant deviation from chance expectations given their ob- served relative frequencies. In this respect, molluscan shell “cell aggregates” share the same statistical behav- ior as all of the above living tissues analysed. Table 2 summarizes the data on polygon frequencies in cellular aggregates for all living systems. The table also shows that the average frequencies for pentagons (52.5), hexa- gons (28.3), heptagons (8.2) and quadragons (10.7). The ratio of average percent of pentagons to average percent of hexagons shown at the bottom of the table was 1.9, i.e., approximately two to one. (a) (b) Figure 18. Molluscan shell “cellular aggregates” (a) early stage; (b) later crystalization stage. Photograph after Capenter (Figure 296 in Growth and Form, Thompson, 1943). 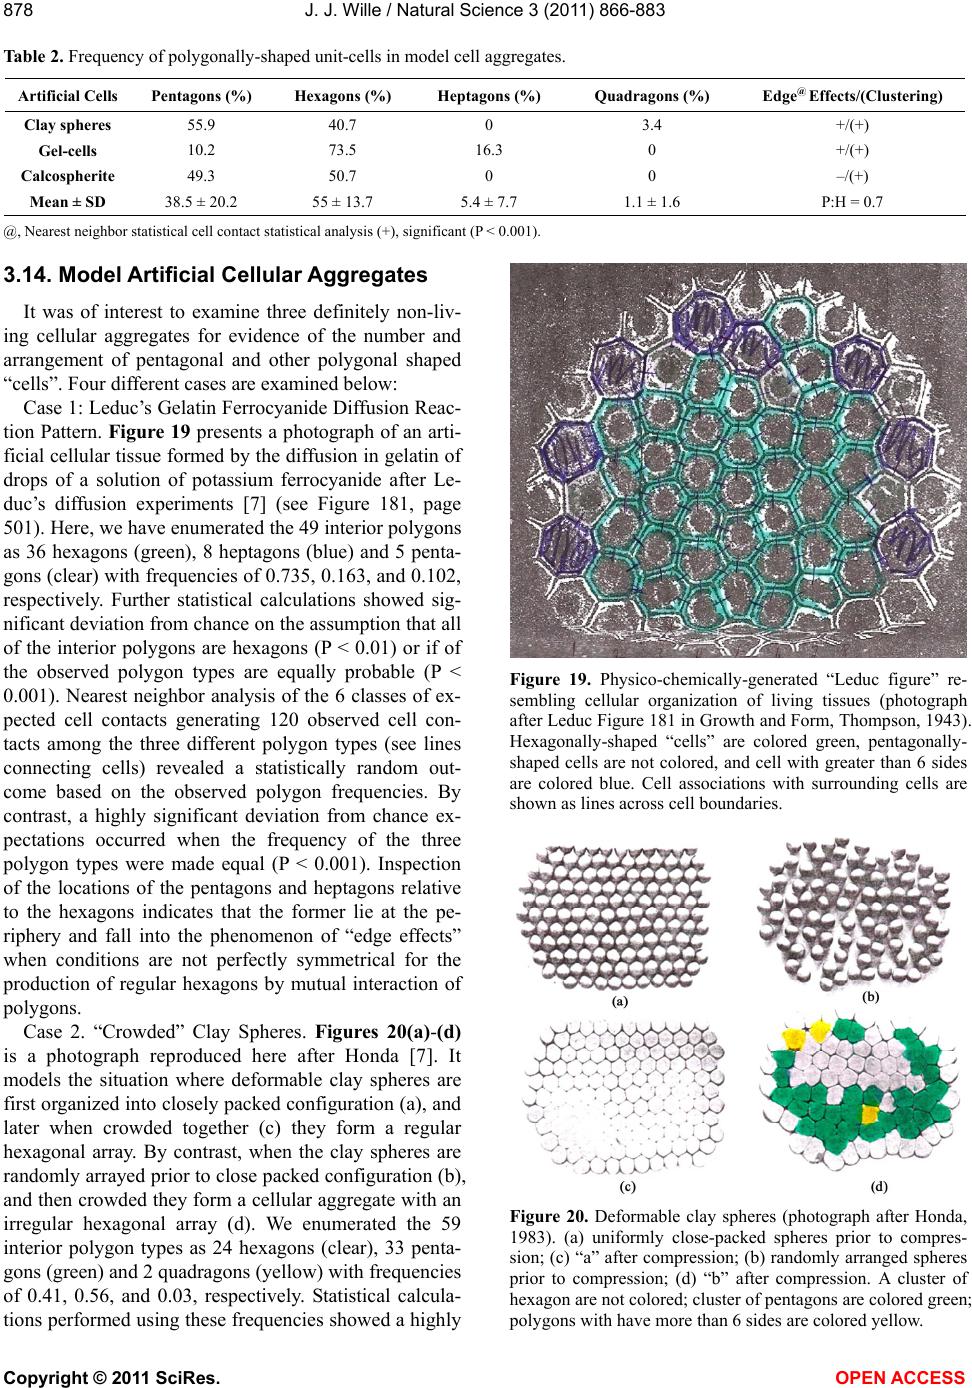 J. J. Wille / Natural Science 3 (2011) 866-883 Copyright © 2011 SciRes. OPEN ACCESS 878 Table 2. Frequency of polygonally-shaped unit-cells in model cell aggregates. Artificial Cells Pentagons (%) Hexagons (%) Heptagons (%) Quadragons (%) Edge@ Effects/(Clustering) Clay spheres 55.9 40.7 0 3.4 +/(+) Gel-cells 10.2 73.5 16.3 0 +/(+) Calcospherite 49.3 50.7 0 0 –/(+) Mean ± SD 38.5 ± 20.2 55 ± 13.7 5.4 ± 7.7 1.1 ± 1.6 P:H = 0.7 @, Nearest neighbor statistical cell contact statistical analysis (+), significant (P < 0.001). 3.14. Model Artificial Cellular Aggregates It was of interest to examine three definitely non-liv- ing cellular aggregates for evidence of the number and arrangement of pentagonal and other polygonal shaped “cells”. Four different cases are examined below: Case 1: Leduc’s Gelatin Ferrocyanide Diffusion Reac- tion Pattern. Figure 19 presents a photograph of an arti- ficial cellular tissue formed by the diffusion in gelatin of drops of a solution of potassium ferrocyanide after Le- duc’s diffusion experiments [7] (see Figure 181, page 501). Here, we have enumerated the 49 interior polygons as 36 hexagons (green), 8 heptagons (blue) and 5 penta- gons (clear) with frequencies of 0.735, 0.163, and 0.102, respectively. Further statistical calculations showed sig- nificant deviation from chance on the assumption that all of the interior polygons are hexagons (P < 0.01) or if of the observed polygon types are equally probable (P < 0.001). Nearest neighbor analysis of the 6 classes of ex- pected cell contacts generating 120 observed cell con- tacts among the three different polygon types (see lines connecting cells) revealed a statistically random out- come based on the observed polygon frequencies. By contrast, a highly significant deviation from chance ex- pectations occurred when the frequency of the three polygon types were made equal (P < 0.001). Inspection of the locations of the pentagons and heptagons relative to the hexagons indicates that the former lie at the pe- riphery and fall into the phenomenon of “edge effects” when conditions are not perfectly symmetrical for the production of regular hexagons by mutual interaction of polygons. Case 2. “Crowded” Clay Spheres. Figures 20(a)-(d) is a photograph reproduced here after Honda [7]. It models the situation where deformable clay spheres are first organized into closely packed configuration (a), and later when crowded together (c) they form a regular hexagonal array. By contrast, when the clay spheres are randomly arrayed prior to close packed configuration (b), and then crowded they form a cellular aggregate with an irregular hexagonal array (d). We enumerated the 59 interior polygon types as 24 hexagons (clear), 33 penta- gons (green) and 2 quadragons (yellow) with frequencies of 0.41, 0.56, and 0.03, respectively. Statistical calcula- tions performed using these frequencies showed a highly Figure 19. Physico-chemically-generated “Leduc figure” re- sembling cellular organization of living tissues (photograph after Leduc Figure 181 in Growth and Form, Thompson, 1943). Hexagonally-shaped “cells” are colored green, pentagonally- shaped cells are not colored, and cell with greater than 6 sides are colored blue. Cell associations with surrounding cells are shown as lines across cell boundaries. Figure 20. Deformable clay spheres (photograph after Honda, 1983). (a) uniformly close-packed spheres prior to compres- sion; (c) “a” after compression; (b) randomly arranged spheres prior to compression; (d) “b” after compression. A cluster of hexagon are not colored; cluster of pentagons are colored green; polygons with have more than 6 sides are colored yellow. 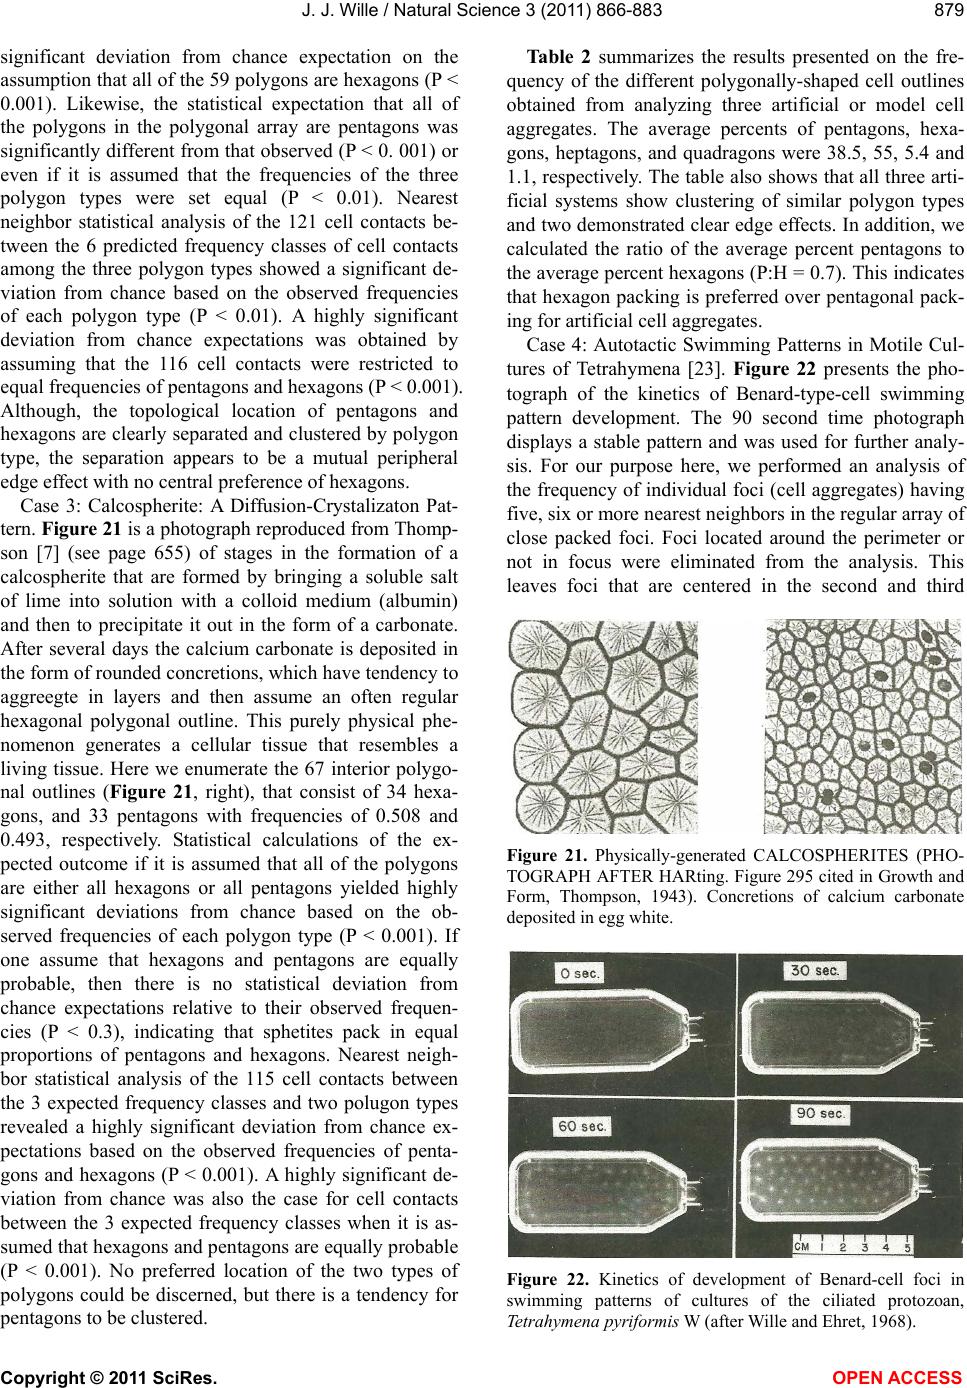 J. J. Wille / Natural Science 3 (2011) 866-883 Copyright © 2011 SciRes. OPEN ACCESS 879 879 significant deviation from chance expectation on the assumption that all of the 59 polygons are hexagons (P < 0.001). Likewise, the statistical expectation that all of the polygons in the polygonal array are pentagons was significantly different from that observed (P < 0. 001) or even if it is assumed that the frequencies of the three polygon types were set equal (P < 0.01). Nearest neighbor statistical analysis of the 121 cell contacts be- tween the 6 predicted frequency classes of cell contacts among the three polygon types showed a significant de- viation from chance based on the observed frequencies of each polygon type (P < 0.01). A highly significant deviation from chance expectations was obtained by assuming that the 116 cell contacts were restricted to equal frequencies of pentagons and hexagons (P < 0.001). Although, the topological location of pentagons and hexagons are clearly separated and clustered by polygon type, the separation appears to be a mutual peripheral edge effect with no central preference of hexagons. Case 3: Calcospherite: A Diffusion-Crystalizaton Pat- tern. Figure 21 is a photograph reproduced from Thomp- son [7] (see page 655) of stages in the formation of a calcospherite that are formed by bringing a soluble salt of lime into solution with a colloid medium (albumin) and then to precipitate it out in the form of a carbonate. After several days the calcium carbonate is deposited in the form of rounded concretions, which have tendency to aggreegte in layers and then assume an often regular hexagonal polygonal outline. This purely physical phe- nomenon generates a cellular tissue that resembles a living tissue. Here we enumerate the 67 interior polygo- nal outlines (Figure 21, right), that consist of 34 hexa- gons, and 33 pentagons with frequencies of 0.508 and 0.493, respectively. Statistical calculations of the ex- pected outcome if it is assumed that all of the polygons are either all hexagons or all pentagons yielded highly significant deviations from chance based on the ob- served frequencies of each polygon type (P < 0.001). If one assume that hexagons and pentagons are equally probable, then there is no statistical deviation from chance expectations relative to their observed frequen- cies (P < 0.3), indicating that sphetites pack in equal proportions of pentagons and hexagons. Nearest neigh- bor statistical analysis of the 115 cell contacts between the 3 expected frequency classes and two polugon types revealed a highly significant deviation from chance ex- pectations based on the observed frequencies of penta- gons and hexagons (P < 0.001). A highly significant de- viation from chance was also the case for cell contacts between the 3 expected frequency classes when it is as- sumed that hexagons and pentagons are equally probable (P < 0.001). No preferred location of the two types of polygons could be discerned, but there is a tendency for pentagons to be clustered. Table 2 summarizes the results presented on the fre- quency of the different polygonally-shaped cell outlines obtained from analyzing three artificial or model cell aggregates. The average percents of pentagons, hexa- gons, heptagons, and quadragons were 38.5, 55, 5.4 and 1.1, respectively. The table also shows that all three arti- ficial systems show clustering of similar polygon types and two demonstrated clear edge effects. In addition, we calculated the ratio of the average percent pentagons to the average percent hexagons (P:H = 0.7). This indicates that hexagon packing is preferred over pentagonal pack- ing for artificial cell aggregates. Case 4: Autotactic Swimming Patterns in Motile Cul- tures of Tetrahymena [23]. Figure 22 presents the pho- tograph of the kinetics of Benard-type-cell swimming pattern development. The 90 second time photograph displays a stable pattern and was used for further analy- sis. For our purpose here, we performed an analysis of the frequency of individual foci (cell aggregates) having five, six or more nearest neighbors in the regular array of close packed foci. Foci located around the perimeter or not in focus were eliminated from the analysis. This leaves foci that are centered in the second and third Figure 21. Physically-generated CALCOSPHERITES (PHO- TOGRAPH AFTER HARting. Figure 295 cited in Growth and Form, Thompson, 1943). Concretions of calcium carbonate deposited in egg white. Figure 22. Kinetics of development of Benard-cell foci in swimming patterns of cultures of the ciliated protozoan, Tetrahymena pyriformis W (after Wille and Ehret, 1968). 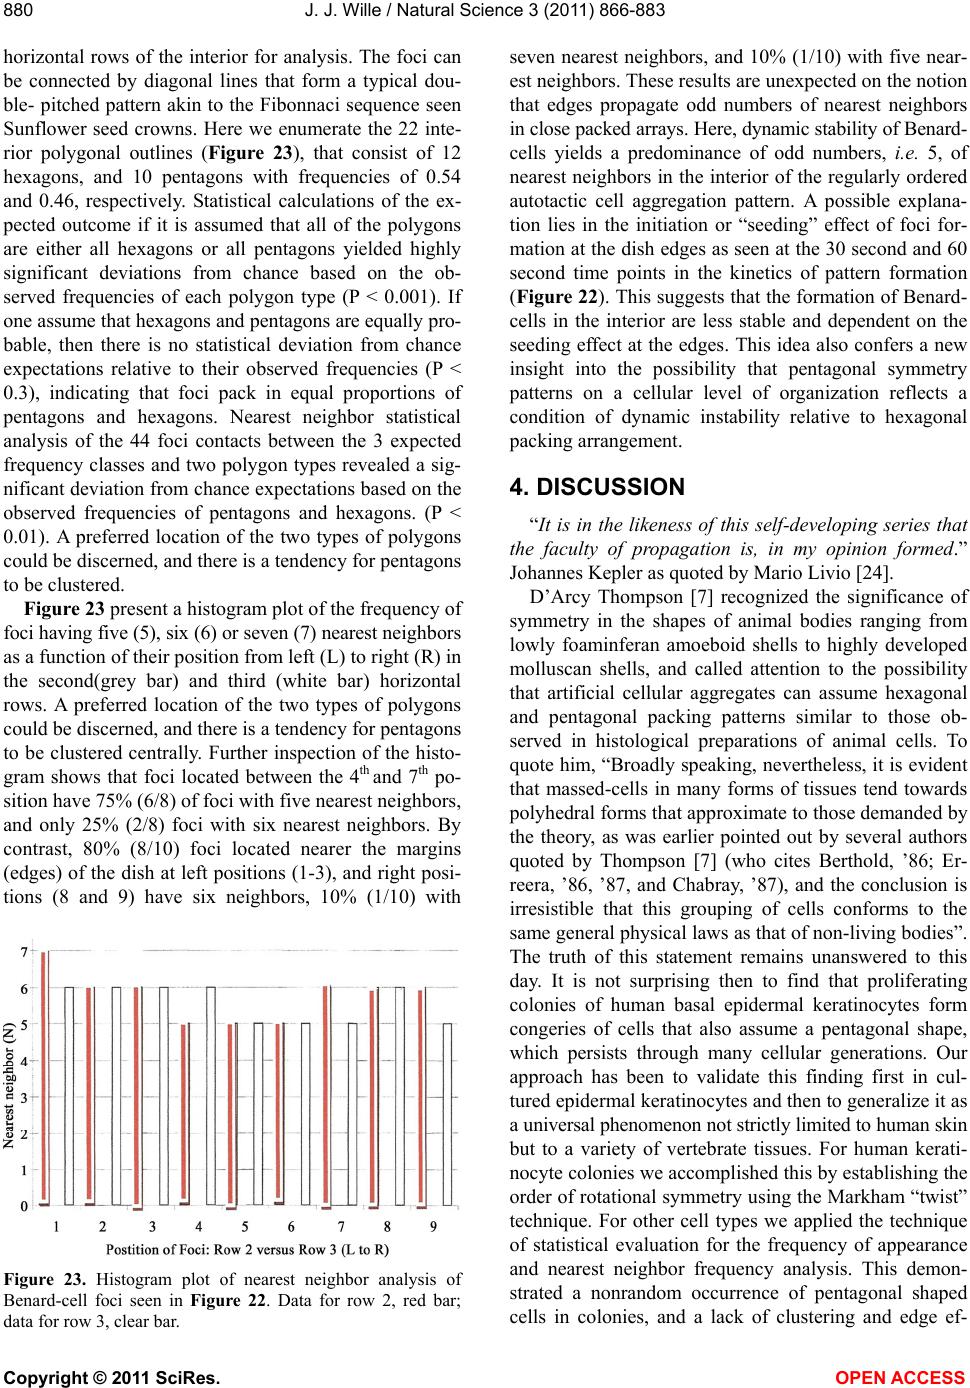 J. J. Wille / Natural Science 3 (2011) 866-883 Copyright © 2011 SciRes. OPEN ACCESS 880 horizontal rows of the interior for analysis. The foci can be connected by diagonal lines that form a typical dou- ble- pitched pattern akin to the Fibonnaci sequence seen Sunflower seed crowns. Here we enumerate the 22 inte- rior polygonal outlines (Figure 23), that consist of 12 hexagons, and 10 pentagons with frequencies of 0.54 and 0.46, respectively. Statistical calculations of the ex- pected outcome if it is assumed that all of the polygons are either all hexagons or all pentagons yielded highly significant deviations from chance based on the ob- served frequencies of each polygon type (P < 0.001). If one assume that hexagons and pentagons are equally pro- bable, then there is no statistical deviation from chance expectations relative to their observed frequencies (P < 0.3), indicating that foci pack in equal proportions of pentagons and hexagons. Nearest neighbor statistical analysis of the 44 foci contacts between the 3 expected frequency classes and two polygon types revealed a sig- nificant deviation from chance expectations based on the observed frequencies of pentagons and hexagons. (P < 0.01). A preferred location of the two types of polygons could be discerned, and there is a tendency for pentagons to be clustered. Figure 23 present a histogram plot of the frequency of foci having five (5), six (6) or seven (7) nearest neighbors as a function of their position from left (L) to right (R) in the second(grey bar) and third (white bar) horizontal rows. A preferred location of the two types of polygons could be discerned, and there is a tendency for pentagons to be clustered centrally. Further inspection of the histo- gram shows that foci located between the 4th and 7th po- sition have 75% (6/8) of foci with five nearest neighbors, and only 25% (2/8) foci with six nearest neighbors. By contrast, 80% (8/10) foci located nearer the margins (edges) of the dish at left positions (1-3), and right posi- tions (8 and 9) have six neighbors, 10% (1/10) with Figure 23. Histogram plot of nearest neighbor analysis of Benard-cell foci seen in Figure 22. Data for row 2, red bar; data for row 3, clear bar. seven nearest neighbors, and 10% (1/10) with five near- est neighbors. These results are unexpected on the notion that edges propagate odd numbers of nearest neighbors in close packed arrays. Here, dynamic stability of Benard- cells yields a predominance of odd numbers, i.e. 5, of nearest neighbors in the interior of the regularly ordered autotactic cell aggregation pattern. A possible explana- tion lies in the initiation or “seeding” effect of foci for- mation at the dish edges as seen at the 30 second and 60 second time points in the kinetics of pattern formation (Figure 22). This suggests that the formation of Benard- cells in the interior are less stable and dependent on the seeding effect at the edges. This idea also confers a new insight into the possibility that pentagonal symmetry patterns on a cellular level of organization reflects a condition of dynamic instability relative to hexagonal packing arrangement. 4. DISCUSSION “It is in the likeness of this self-developing series that the faculty of propagation is, in my opinion formed.” Johannes Kepler as quoted by Mario Livio [24]. D’Arcy Thompson [7] recognized the significance of symmetry in the shapes of animal bodies ranging from lowly foaminferan amoeboid shells to highly developed molluscan shells, and called attention to the possibility that artificial cellular aggregates can assume hexagonal and pentagonal packing patterns similar to those ob- served in histological preparations of animal cells. To quote him, “Broadly speaking, nevertheless, it is evident that massed-cells in many forms of tissues tend towards polyhedral forms that approximate to those demanded by the theory, as was earlier pointed out by several authors quoted by Thompson [7] (who cites Berthold, ’86; Er- reera, ’86, ’87, and Chabray, ’87), and the conclusion is irresistible that this grouping of cells conforms to the same general physical laws as that of non-living bodies”. The truth of this statement remains unanswered to this day. It is not surprising then to find that proliferating colonies of human basal epidermal keratinocytes form congeries of cells that also assume a pentagonal shape, which persists through many cellular generations. Our approach has been to validate this finding first in cul- tured epidermal keratinocytes and then to generalize it as a universal phenomenon not strictly limited to human skin but to a variety of vertebrate tissues. For human kerati- nocyte colonies we accomplished this by establishing the order of rotational symmetry using the Markham “twist” technique. For other cell types we applied the technique of statistical evaluation for the frequency of appearance and nearest neighbor frequency analysis. This demon- strated a nonrandom occurrence of pentagonal shaped cells in colonies, and a lack of clustering and edge ef- 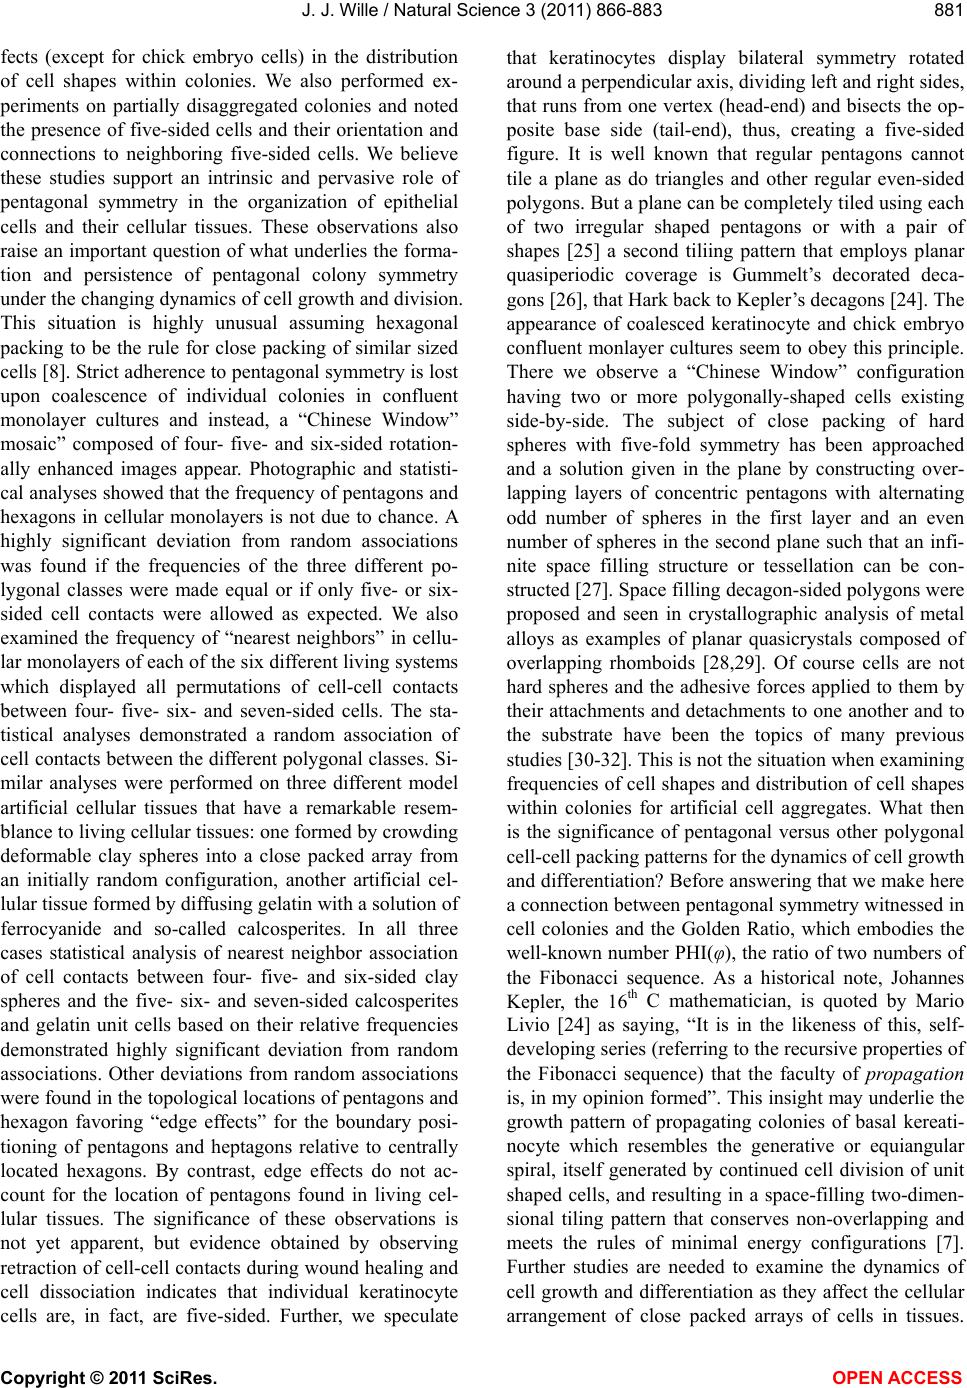 J. J. Wille / Natural Science 3 (2011) 866-883 Copyright © 2011 SciRes. OPEN ACCESS 881 881 fects (except for chick embryo cells) in the distribution of cell shapes within colonies. We also performed ex- periments on partially disaggregated colonies and noted the presence of five-sided cells and their orientation and connections to neighboring five-sided cells. We believe these studies support an intrinsic and pervasive role of pentagonal symmetry in the organization of epithelial cells and their cellular tissues. These observations also raise an important question of what underlies the forma- tion and persistence of pentagonal colony symmetry under the changing dynamics of cell growth and division. This situation is highly unusual assuming hexagonal packing to be the rule for close packing of similar sized cells [8]. Strict adherence to pentagonal symmetry is lost upon coalescence of individual colonies in confluent monolayer cultures and instead, a “Chinese Window” mosaic” composed of four- five- and six-sided rotation- ally enhanced images appear. Photographic and statisti- cal analyses showed that the frequency of pentagons and hexagons in cellular monolayers is not due to chance. A highly significant deviation from random associations was found if the frequencies of the three different po- lygonal classes were made equal or if only five- or six- sided cell contacts were allowed as expected. We also examined the frequency of “nearest neighbors” in cellu- lar monolayers of each of the six different living systems which displayed all permutations of cell-cell contacts between four- five- six- and seven-sided cells. The sta- tistical analyses demonstrated a random association of cell contacts between the different polygonal classes. Si- milar analyses were performed on three different model artificial cellular tissues that have a remarkable resem- blance to living cellular tissues: one formed by crowding deformable clay spheres into a close packed array from an initially random configuration, another artificial cel- lular tissue formed by diffusing gelatin with a solution of ferrocyanide and so-called calcosperites. In all three cases statistical analysis of nearest neighbor association of cell contacts between four- five- and six-sided clay spheres and the five- six- and seven-sided calcosperites and gelatin unit cells based on their relative frequencies demonstrated highly significant deviation from random associations. Other deviations from random associations were found in the topological locations of pentagons and hexagon favoring “edge effects” for the boundary posi- tioning of pentagons and heptagons relative to centrally located hexagons. By contrast, edge effects do not ac- count for the location of pentagons found in living cel- lular tissues. The significance of these observations is not yet apparent, but evidence obtained by observing retraction of cell-cell contacts during wound healing and cell dissociation indicates that individual keratinocyte cells are, in fact, are five-sided. Further, we speculate that keratinocytes display bilateral symmetry rotated around a perpendicular axis, dividing left and right sides, that runs from one vertex (head-end) and bisects the op- posite base side (tail-end), thus, creating a five-sided figure. It is well known that regular pentagons cannot tile a plane as do triangles and other regular even-sided polygons. But a plane can be completely tiled using each of two irregular shaped pentagons or with a pair of shapes [25] a second tiliing pattern that employs planar quasiperiodic coverage is Gummelt’s decorated deca- gons [26], that Hark back to Kepler’s decagons [24]. The appearance of coalesced keratinocyte and chick embryo confluent monlayer cultures seem to obey this principle. There we observe a “Chinese Window” configuration having two or more polygonally-shaped cells existing side-by-side. The subject of close packing of hard spheres with five-fold symmetry has been approached and a solution given in the plane by constructing over- lapping layers of concentric pentagons with alternating odd number of spheres in the first layer and an even number of spheres in the second plane such that an infi- nite space filling structure or tessellation can be con- structed [27]. Space filling decagon-sided polygons were proposed and seen in crystallographic analysis of metal alloys as examples of planar quasicrystals composed of overlapping rhomboids [28,29]. Of course cells are not hard spheres and the adhesive forces applied to them by their attachments and detachments to one another and to the substrate have been the topics of many previous studies [30-32]. This is not the situation when examining frequencies of cell shapes and distribution of cell shapes within colonies for artificial cell aggregates. What then is the significance of pentagonal versus other polygonal cell-cell packing patterns for the dynamics of cell growth and differentiation? Before answering that we make here a connection between pentagonal symmetry witnessed in cell colonies and the Golden Ratio, which embodies the well-known number PHI(φ), the ratio of two numbers of the Fibonacci sequence. As a historical note, Johannes Kepler, the 16th C mathematician, is quoted by Mario Livio [24] as saying, “It is in the likeness of this, self- developing series (referring to the recursive properties of the Fibonacci sequence) that the faculty of propagation is, in my opinion formed”. This insight may underlie the growth pattern of propagating colonies of basal kereati- nocyte which resembles the generative or equiangular spiral, itself generated by continued cell division of unit shaped cells, and resulting in a space-filling two-dimen- sional tiling pattern that conserves non-overlapping and meets the rules of minimal energy configurations [7]. Further studies are needed to examine the dynamics of cell growth and differentiation as they affect the cellular arrangement of close packed arrays of cells in tissues.  J. J. Wille / Natural Science 3 (2011) 866-883 Copyright © 2011 SciRes. OPEN ACCESS 882 Earlier theoretical modeling [33] of the development of pentagonal and radial symmetry, primarily in early em- bryology of Echinoderms, employed a two-variable re- action-diffusion mathematical scheme much like the original Turing model with special initial conditions and fixed diuffsuion coefficients for the diffusible chemical entities [34]. This model was confirmed by numerical calculations and waveform iterations that predicted the formation of a pentagonal “seed” within the embryo that lays the basis for perpetuation of overall radial and pen- tagonal symmetry of the adult. Much still needs to be done to understand the underlying molecular basis of these models. In this regard, the past decade has wit- nessed advances underlying symmetry breaking, which involve directional assembly of cytoskeletal polymers, molecular motors that drive cellular motion, and the regulatory action of GTPases, kinases and proteases that provide feedeback mechanisms for epithelial cell polar- ity [35]. REFERENCES [1] Weyl, H. (1952) Symmetry. Princeton University Press, Princeton. [2] Goddard, T., Huang, C. and Ferrin, T. (2004) New ap- proaches for visualizing virus capsids. Poster for NCRR Principle Investigator Meeting, 1-7. www.cgl.ucsf.edu. [3] Hickman, C.P.Sr., Hickman, C.P.Jr. and Hickman, F.M. (1974) Integrated principles of zoology. 5th Edition, The CV Mosby Company, St. Louis. [4] Romer, A.S. (1974) The vertebrate body: A shorter ver- sion of the second edition. W.B. Saunders Company, Philadelphia. [5] Breder, C.M.Jr. (1955) Observations on the occurrence and attributes of pentagonal symmetry. Bulletin of American Museum of Natural History, 106, 173-220. [6] Frankel, J. (1984) Pattern formation in ciliated protozoa. In: Malacinski, G.M. and Bryant, S.V., Eds., Pattern Formation: A Primer in Developmental Biology, Mac- millan Publishing Company, New York, 163-196. [7] Thompson, D.W. (1943) On growth and form. New Edi- tion, Cambridge University Press, The Macmillan Com- pany, Cambridge. [8] Honda H. (1983) Geometrical models for cells and tis- sues. International Review of Cytology, 83, 191-246. doi:10.1016/S0074-7696(08)62339-6 [9] Ehret, C.F. (1967) Paratene theory of the shapes of cells. Journal of Theoretical Biology, 15, 263-272. doi:10.1016/0022-5193(67)90207-X [10] Othmer. H.G. and Scriven, L.E. (1971) Instability and dynamic pattern in cellular networks. Journal of Theo- retical Biology, 32, 507-537. doi:10.1016/0022-5193(71)90154-8 [11] Chen, C.S. Mrksich, M., Huang, S., Whitesides. G.M. and Ingebar, D.E. (1997) Geometric control of cell life and death. Science , 276, 1425-1428. doi:10.1126/science.276.5317.1425 PMid:9162012 [12] Li, R. and Bowerman, B. (2010) Symmetry breaking in biology. In: Symmetry Breaking in Biology. Cold Spring Harbor Perspect Biology, Cold Spring Harbor Labora- tory Press, Cold Spring Harbor, 2, 1-6. [13] Aoyama, Y. and Kitajima, Y. (1999) Pemphigus vul- garis-IgG causes a rapid depletion of desmoglein 3 (Dsg 3) from the Triton-X-100 soluble pools, leading to the formation of Dsg 3-depleted desmosomes in a human squamous carcinoma cell line, DJM-1 cells. Journal of Investigative Dermatology, 112, 67-71. doi:10.1046/j.1523-1747.1999.00463.x PMid:9886266 [14] Penas, P.F., Gomez, M., Buezo, G.F., Rios, L., Yanez-Mo, M., Cabanas, C., Sanchez-Madrid, F. and Garcia-Diez, A. (1998) Differentiation expression of activation epitopes of beta-1 integrins in psoriasis and normal skin. Journal of Investigative Dermatology, 111, 19-24. doi:10.1046/j.1523-1747.1998.00232.x PMid:9665381 [15] Inamatsu, M., Matsizaki, T. Iwanari, H. and Yoshizatu, K. (1998) Establishment of rat dermal papilla cell lines that sustain the potency to induce hair follicles from afollicu- lar skin. Journal of Investigative Dermatology, 111, 767-775. doi:10.1046/j.1523-1747.1998.00382.x PMid:9804336 [16] Tateno, C. and Yoshizato, K. (1999) Growth potential and differentiation capacity of adult rat hepatocytes in vitro. Wound Repair and Regeneration, 7, 36-44. doi:10.1046/j.1524-475X.1999.00036.x PMid:10231504 [17] Rambo, C.C. and Szego, C.M. (1983) Estrogen action at endometrial membranes: Alterations in luminal surface detectable within seconds. Journal of Cell Biology, 97, 679-685. doi:10.1083/jcb.97.3.679 PMid:6885915 [18] Markham, R., Frey, S. and Hills, G.J. (1963) A photo- graphic image enhancement technique applied viral str- uctures. Virology, 20, 88. doi:10.1016/0042-6822(63)90143-0 [19] Ayoub, P. and Sklaar, G. (1983) A Modification of the Mallory connective tissue stain as a stain for keratin. Oral Surgery, 16, 80-581. [20] Wille, J., Pittelkow, M.R., Shipley, G.D. and Scott, R.E. (1984) Integrated control of growth and differentiation of normal human prokeratinocytes cultured in serum-free medium: Clonal analyses, growth kinetics and cell cycle studies. Journal of Cellular Physiology, 121, 31-44. doi:10.1002/jcp.1041210106 PMid:6207187 [21] Aroeti, B. (2007) Published image. Chroma Technology Corp, Institute for Life Science, Hebrew University, Je- rusalem. [22] Yang, C.N. (1962) Elementary particles. Princeton Uni- versity Press, Princeton, 51. [23] Wille, J.J. and Ehret, C.F. (1968) Circadian rhythm of pattern formation in populations of free-swimming or- ganism, Terahymena. Journal of Protozoology, 15, 789- 797. [24] Livio, M. (2002) The golden ratio. Broadway Book, New York, 110. [25] Penrose, R. (1999) The emperor’s new mind. Oxford University Press, Oxford, 172-173.  J. J. Wille / Natural Science 3 (2011) 866-883 Copyright © 2011 SciRes. OPEN ACCESS 883 883 [26] Urban, K.W. (1998) From tilings to coverings. Nature, 396, 14-15. doi:10.1038/23806 [27] Bagley, A. (1965) A dense packing of hard spheres with five-fold symmetry. Nature, 208, 674-675. doi:10.1038/208674a0 [28] Penrose, R. (1974) The role of aesthetics in pure and applird mathematical research. Bulletin of the Institute of Mathematics and Its Applications, 10, 266-271. [29] Steinhardt, P.J., Jeong, H.-C., Saitoh, K., Tanaka, E., Abe, E. and Tsai, A.P. (1998) Experimental verification of the quasi-unit cell model of quasicrystal structure. Nature, 396, 55-57. doi:10.1038/23902 [30] Steinberg, M. (1963) Reconstruction of tissues by disso- ciated cells. Some morphogenetic tissue movements and the sorting out of embryonic cells may have a common explanation. Science, 141, 401-408. doi:10.1126/science.141.3579.401 PMid:13983728 [31] Beysens, D.A., Forgacs, G. and Glazier, J.A. (2000) Cell sorting is analogous to phase ordering in fluids. Pro- ceedings of the National Academy of Sciences of the United States of America, 97, 9467-9471. doi:10.1073/pnas.97.17.9467 [32] Forgacs, G. and Foty, R.A. (2004) Biological implica- tions of tissue viscoelasticity. In: Deutsch, A., Folke, M., Howard, J. and Zimmermann, W., Eds., Function and Regulation of Cellular Systems: Experiments and Models. Biskhauser, Basel, 269-277. doi:10.1007/978-3-0348-7895-1_27 [33] Arago’n, J.L., Torres, M., Gil, D., Barrio, R.A. and P.K. Maini, P.K. (2000) Turing patterns with pentagonal symmetry. Physical Review E, 65, 051913, 1-9. [34] Turing, A.M. (1952) The chemical basis of morphogene- sis. Philosophical Transactions of the Royal Society B: Biological Sciences, 237, 37-72. doi:10.1098/rstb.1952.0012 [35] Li, R. and Bowerman, B. (2010) Symmetry breaking in biology. Cold Spring Harbor Laboratory Perspectives in Biology, 2a003475, 1-18.
|