Journal of Geographic Information System, 2011, 3, 290-297
doi:10.4236/jgis.2011.34025 Published Online October 2011 (http://www.SciRP.org/journal/jgis)
Copyright © 2011 SciRes. JGIS
Geo-Spatial Database Creation for Wazirabad Canal
Command Area
Chalumuri Ramesh Naidu*, M. V. S. S. Giridhar
Jawaharlal Nehru Technological University Hyderabad, Hyderabad, India
E-mail: *chrnaidu@rediffmail.com
Received April 17, 2011; revised May 29, 2011; acce pted June 17, 2011
Abstract
GIS assist in specific planning and decision-making processes in irrigation through the input, spatial analysis
and output of relevant information. The real strength of GIS is its ability to integrate information. This inte-
gration power makes the scope of GIS almost infinite. The unique integration capability of GIS allows dis-
parate data sets to be brought together to create a complete picture of a situation. GIS technology illustrates
relationships, patterns and connections that are not necessarily obvious in any one data set but are amazingly
apparent once the data sets are integrated. GIS also helps us to assess the performance of the irrigation com-
mand areas. GIS based system helps a canal to analyze the spatial information about its engineers and farm-
ers to improve planning, management and supply of water resources to its corresponding blocks. In order to
manage the water efficiently in the command area, it is needless to say that calculation and evaluation of
water demands in detail at block and minor level to be given overriding priority. Blocks and Chak bounda-
ries can be delineated from the Digital Elevation Model using GIS techniques. These boundaries will help to
plan and allocate the water resources to improve the water allocation strategies and in turn water use effi-
ciency and can make inter-canal comparisons. The delineated block boundaries can be refined exactly using
the drainage, topography and existing canal network in GIS platform.
Keywords: GIS, Command Area, Block, Chak
1. Introduction
Most of the major irrigation command areas [1] in India
suffer from problems of inadequate and unreliable water
supply having wide gaps between irrigation [2] potential
created and utilized. This study area is influencing lack
of regular evaluation of system performances [3,4] and
working knowledge about proper water management due
to lack of spatially related information about the com-
mand area and canal network system [5]. The available
hard copy maps are not to scale and there is no integra-
tion between the maps for evaluation. The water alloca-
tion in command area is defined by the blocks and chaks.
These blocks are controlled by Water Users Associations
[6]. To evaluate the water allocation and usage with re-
spect to actual or theoretical water demand, delineation
of block boundaries are essential. Geograph ical Informa-
tion System (GIS) [7] produces the terrain maps at his
location accuracy and containing detailed information of
the variables under study. GIS [7,8] are databases that
usually have a spatial component to the storage and
processing of the data. Hence, they have the potential to
both store and create map like products. They also offer
the potential for performing multiple analysis or evalua-
tion of scenarios in different a pp l ications.
Development of Geospatial database [9] and Decision
Support System [10,11] for Irrigation command areas is
important to achieve several objectives in planning the
land and water resources. Several studies were done for
large command areas in a regional scale using the GIS
technology and performance of the canal systems [12,13].
But hardly there are any attempts made in analyzing the
micro level command areas using GIS in assessing the
water demand and water use efficiency. This paper is a
part of PhD thesis and highlights the methodology of
mapping [13] canal block and chak boundaries for attain-
ing the main objective for efficient use of water in irri-
gating the crops.
2. Study Area
The selected Wazirabad Command Area (Figure 1) is in
C. R. NAIDU ET AL. 291
Figure 1. Study Are a.
Zone.I under block No.5 of Left Main Canal in Nagar-
junasagar Project (NSP). It is located between
16˚39'2.84" and 16˚56'40.81" N latitude and 79˚25' 16.01"
and 79˚40'52.90" E longitude. Mirialguda is the nearest
town connected b y ground road n etwork. The to tal ex tent
of command area is 26,700 hectares. The study area is
located flat and medium undulating terrain with maxi-
mum and minimum elevation ranging between 187 and
44 m above MSL. The area experiences semi-arid cli-
matic conditions and receives an average annual rainfall
about 750 mm. In general, the slope of the command
area is towards east. The maps available with the irriga-
tion department
3. Methodology
Canal Network is digitized and delin eated using the Sur-
vey of India (SOI) topo maps of scale 1:25,000.
Block and Chak boundaries were delineated from the
features resulted from surface modeling tools, topo map
and digitized canal network. The digitized canal network
data, Block and Chak boundaries were converted to GIS
Database to calculate the irrigated areas [14] for achiev-
ing the further scope of the thesis. DEM is generated
using the collected contour map from Irrigation Depart-
ment. The Methodolog y is represented in Figure 2
The following layers are ge nerated in GIS Platform:
Canal line;
Canal Node;
Contour and Digital Elevation Model;
Command Area Boundary including Block and Chak;
boundary;
The GIS Data incorporates the following information
on different layers which is illu strated in Tab le 1 and th e
list of softwares used for creation of database in Table 2.
The following layers are ge nerated in GIS Platform:
Canal line;
Canal Node;
Soil Map;
Contour and Digital Elevation Model;
Command Area Boundary including Block and chak;
boundary.
The methodology illustrates in the following sections.
3.1. Collection of Input
The data includes:
SOI topo maps are also collected from the Survey of
India for reference;
Existing Block maps and other collateral data con-
cerned command area;
Contour Map.
3.2. Scanning and Georeferencing of Topo Maps,
and Block Maps
The existing topo maps and block maps are scanned in
400 dpi and imported in Erdas Imagery in .img format.
Geo-referencing is done using Erdas software. Scanned
maps are imported in .img format and geo-referenced to
one or sub pixel accuracy with respect to the Ground
Control Points collected from both SOI map and Block
Maps. These Control points are locations that can be
accurately identified on the Block maps and in SOI Topo
Maps. These identifiable locations may be road and
stream intersections, building corners, bridges, the mouth
of a stream, rock outcrops etc. These control points are
used to build a po lynomial transformation that warps the
Block maps from one coordinate space to another.
All coordinates and residuals are reported in latitude,
longitude and height as per the following Projection Pa-
rameters:
Projection: Universal Transverse Mercator (UTM);
Horizontal Datum: World Geodetic System (WGS);
Zone 44.
3.3. Canal Network Database Creation
The irrigation water is originated from Nagarjunasagar
Dam and is distributed through left and right main canal.
For the study area water is diverted from the left main
canal (a point spatial feature) and flows through the
C
opyright © 2011 SciRes. JGIS
C. R. NAIDU ET AL.
292
Figure 2. Methodology.
Table 1. List of layers, scale and source of the data.
S. No Layer Attribute Data Theme Scale Source
1 Canal Line
Start node, Endnote,
XCOORD, YCOORD,
Length, type , ID,
Discharge
Line 1:25,000 SOI Topo map
2 Canal Node
Start node, Endnote,
XCOORD, YCOORD,
Length, ty pe, ID, Eleva-
tion, Discharge
Point 1:25,000 SOI Topo map
3 Contour ID, Elevation Polygon 1 m Block Maps from NSP
4 DEM 1m Raster 1 m From generated contour map
5 Aspect Map 1m Raster 1 m From generated DEM
6 Command Area Boundary
including Block and Chak
Boundary
Block ID, Chak ID,
Area, Canal ID Polygon 1:25,000
Topo map and Existing
Command area maps from
Irrigation Department, and
DEM
Table 2. List of software used.
S. NO Task Software
1 Scanning and Georeferencing of Topomaps
Mosaicing of Topo Maps
DEM and Aspect Erdas Imagine and GRASS GIS
2 Digitization and Updation of Base Features Auto CAD
3
Editing and Transformation of Digitized Data
GIS Database Creation and Linking
Map Composition
Reports
ArcGIS and ArcInfo
4 Non-Spatial Database MS Access, Excel
major and minor canal network (line spatial features) and
finally to the farms (polygon spatial features). The canal
network data structure is important to assess the spatial
distribution of the water demand and supply for the irri-
gation planning and management.
The data was prepared in a network module which
C
opyright © 2011 SciRes. JGIS
C. R. NAIDU ET AL.293
constitutes nodes and lines. The node data refers to
Sluice OT and line refers to canal. The flow direction
and continuity errors were taken care while digitization
and later checked for continuity in the ArcGIS Network
Module.
The canal ID is created with a unique multi digit
number constitutes a combination of alphabets and
numbers. All canal reaches have only one upstream reach
but have more than one downstream reaches. Only the
upstream reach ID is kept for each sections in the devel-
oped data system. The hierarchic relationship can be re-
trieved through th e use of Upper id.
3.4. Creation of Contour Map, Digital Elevation
Model (DEM) and Aspect Map
Digital representations of the terrain often form one of
the main elements of the mapping process. Digital Ele-
vation Model (DEM) [15] represents continuous varia-
tion of topography over space that helps in assessing
landscape characteristics and has a wide application in
surface hydrology modeling. These characteristics help
to determine slope, flow directions, areas, boundaries
and outlets of drainage basins and ultimately in delineat-
ing the Block and Chak boundaries for this study. Using
GRASS GIS the DEM is generated.
Contours are digitized from the Block maps collected
from the Irrigation Department. These contours used as
an elevation data for creating the Digital Elevation Mod-
el. The DEM is used as an input for creating the Aspect
Map.
3.5. Delineation of Command Area, Block and
Chak Boundaries
The delineation is based on surface modeling techniques
available in many GIS and Remote Sensing [16] Tech-
niques. GRASS Software is used for doing the surface
modeling. One of the most soph isticated GIS capabilities
which are very useful in hydrographic modeling is the
digital representation of the topography of the catch-
ments. Surface modeling is a general term which is used
to describe the process of representing a physical or ar-
tificially created surface by means of a mathematical
expression. Terrain modeling is one particular category
of surface modeling which deals with the specific prob-
lems of representing the surface of the earth. The tech-
niques of terrain modeling are of widespread use and
have been app1ied widely in the physical and earth sci-
ences.
The DEM [16] provides 3D [16] input data for calcu-
lating flow direction across terrain, which is subse-
quently used for creation of stream networks. Delinea-
tion of surface Hydrology Features from DEM data has
become standardized on the eight-direction pour point
model in which each cell is connected to one of its eight
neighbor cells (four on the principal axes, four on the
diagonals) according to the direction of steepest descent.
Given an elevation grid, a grid of flow directions is con-
structed, and from this is derived a grid of flow accumu-
lation, counting the number of cells upstream of a given
cell. Streams are identified as lines of cells whose flow
accumulation exceeds a specified number of cells and
thus a specified upstream drainage area. Extracted stream
lines obtained with this give us general information
about the characteristic of terrain.
The Chaks and Block Boundaries under each canal are
delineated reference to canal network, DEM, Aspect and
drainage network extracted from surface modeling and
SOI Topo maps. The Chaks are mapped as per the type
of canal and its flow direction. If the canal is a ridge ca-
nal Chaks are identified on both sides of it and if it is a
contour canal Chaks are on one side only. Spread of a
Chak is between the canal and the drainage line.
4. Results and Reports
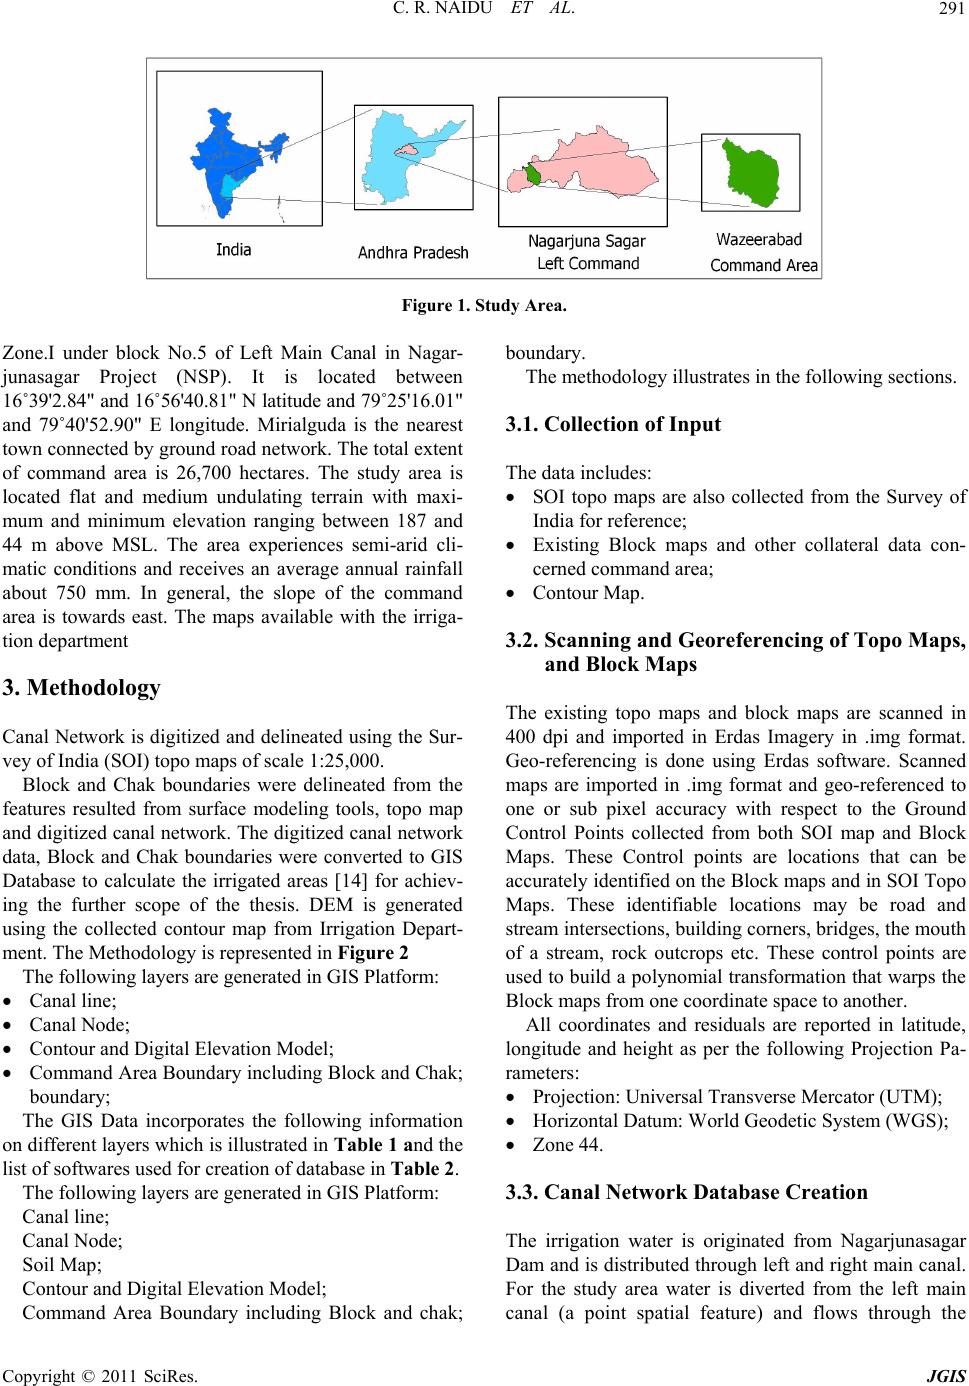
The canal network with line and nodes are represented in
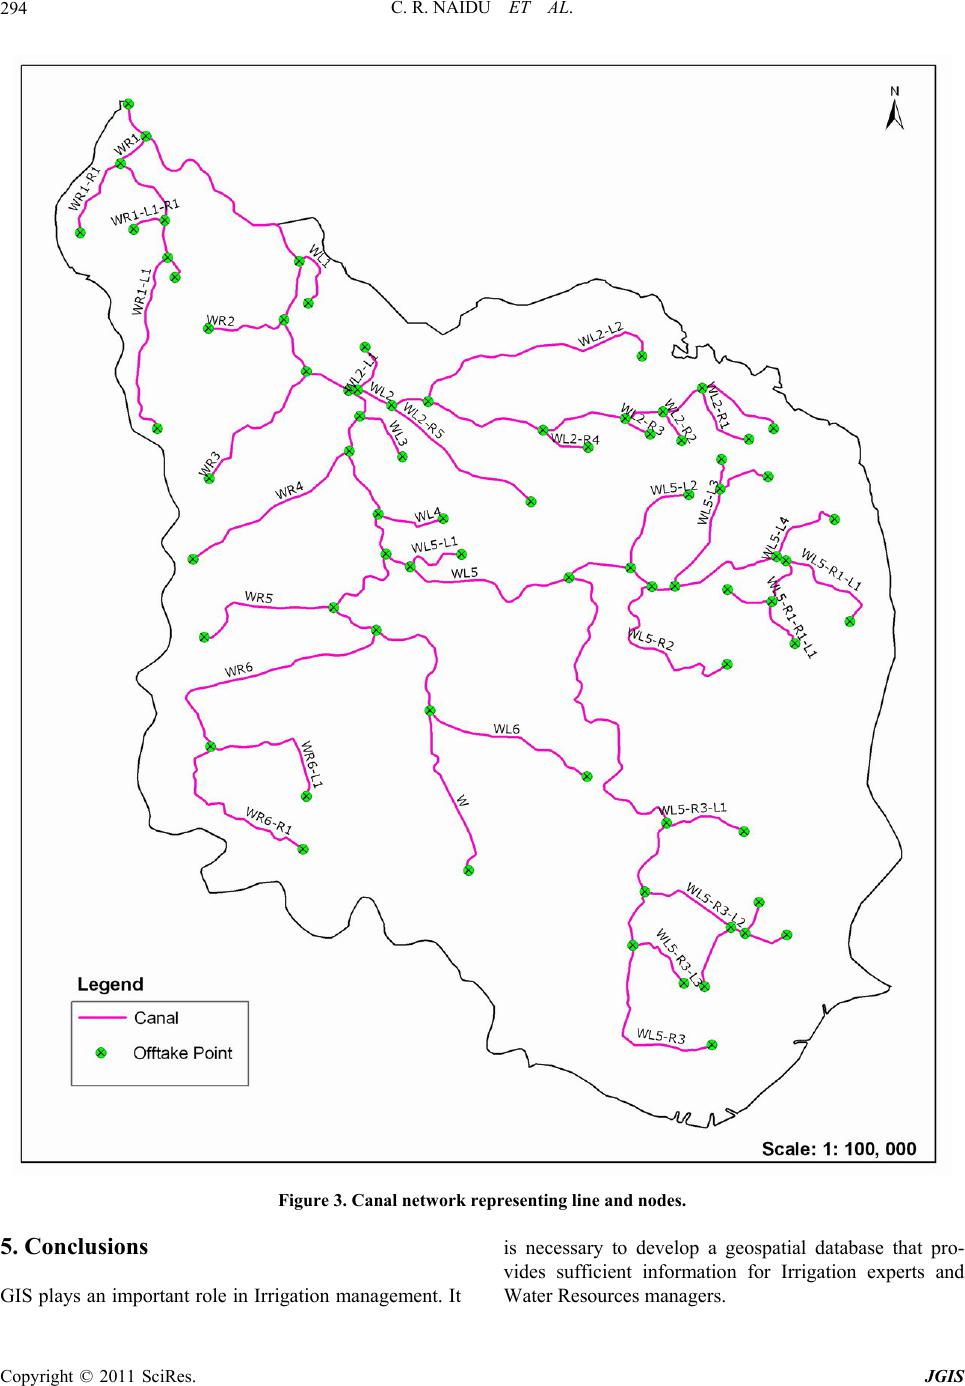
Figure 3. The canal network is overlaid on DEM and the
the streams and valleys are extracted from the hydraulic
model. The canals and streams are combined together to
form block and chak boundaries are shown in Figure 4.
There are 13 canals mapped in network model and in-
cluding major canal and under each canal the sub-blocks
and chaks are identified with reference to DEM and
identified topographic features. Canal and corresponding
sub-block are coded with same identification code.
Chaks under each sub-block are prefixed with canal and
the corresponding sub-block id.
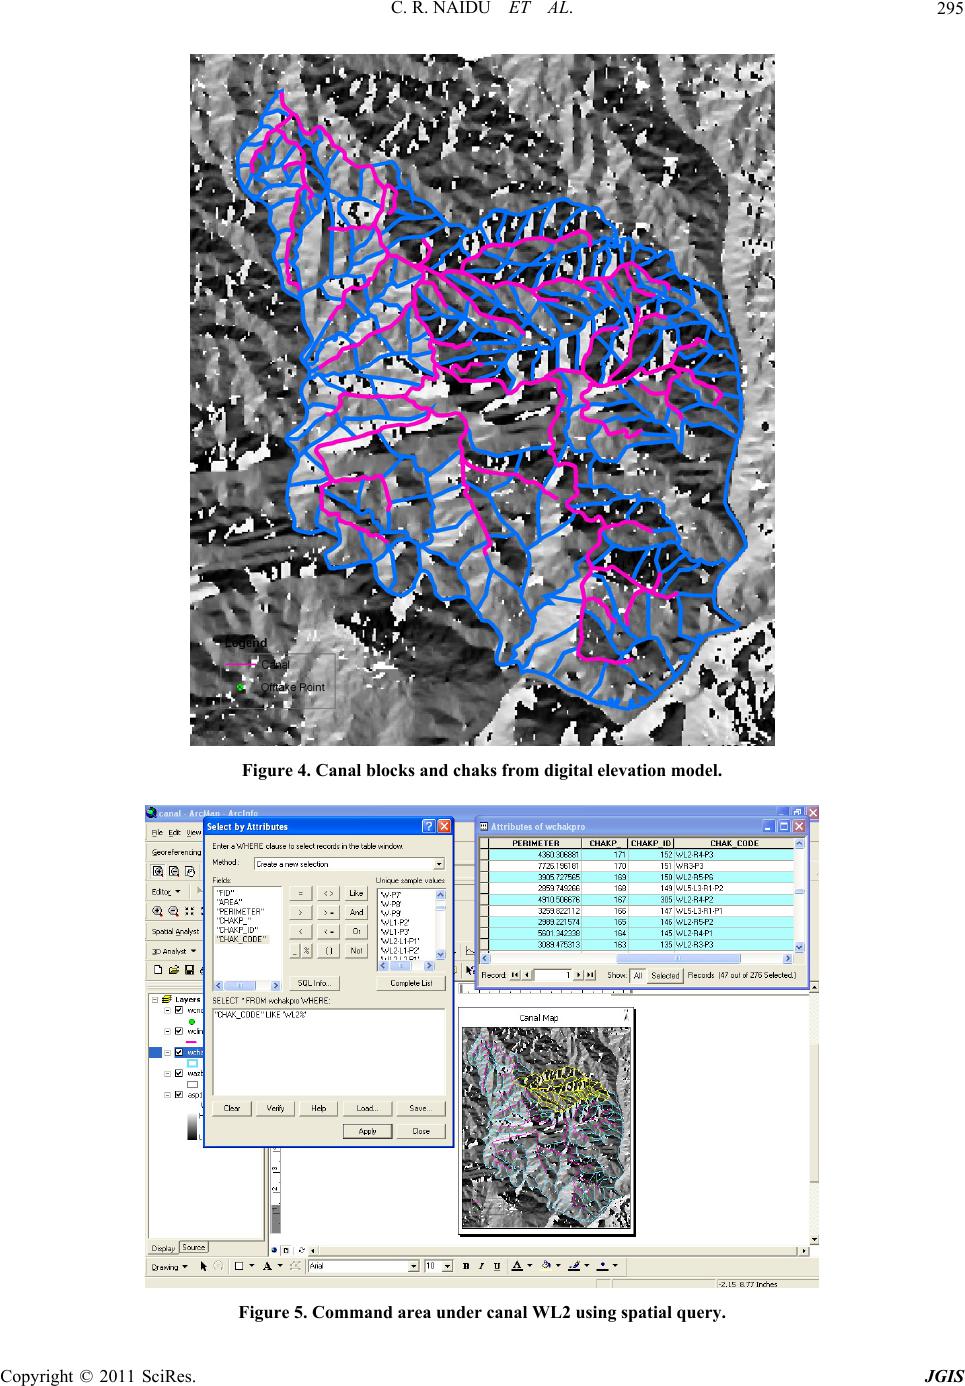
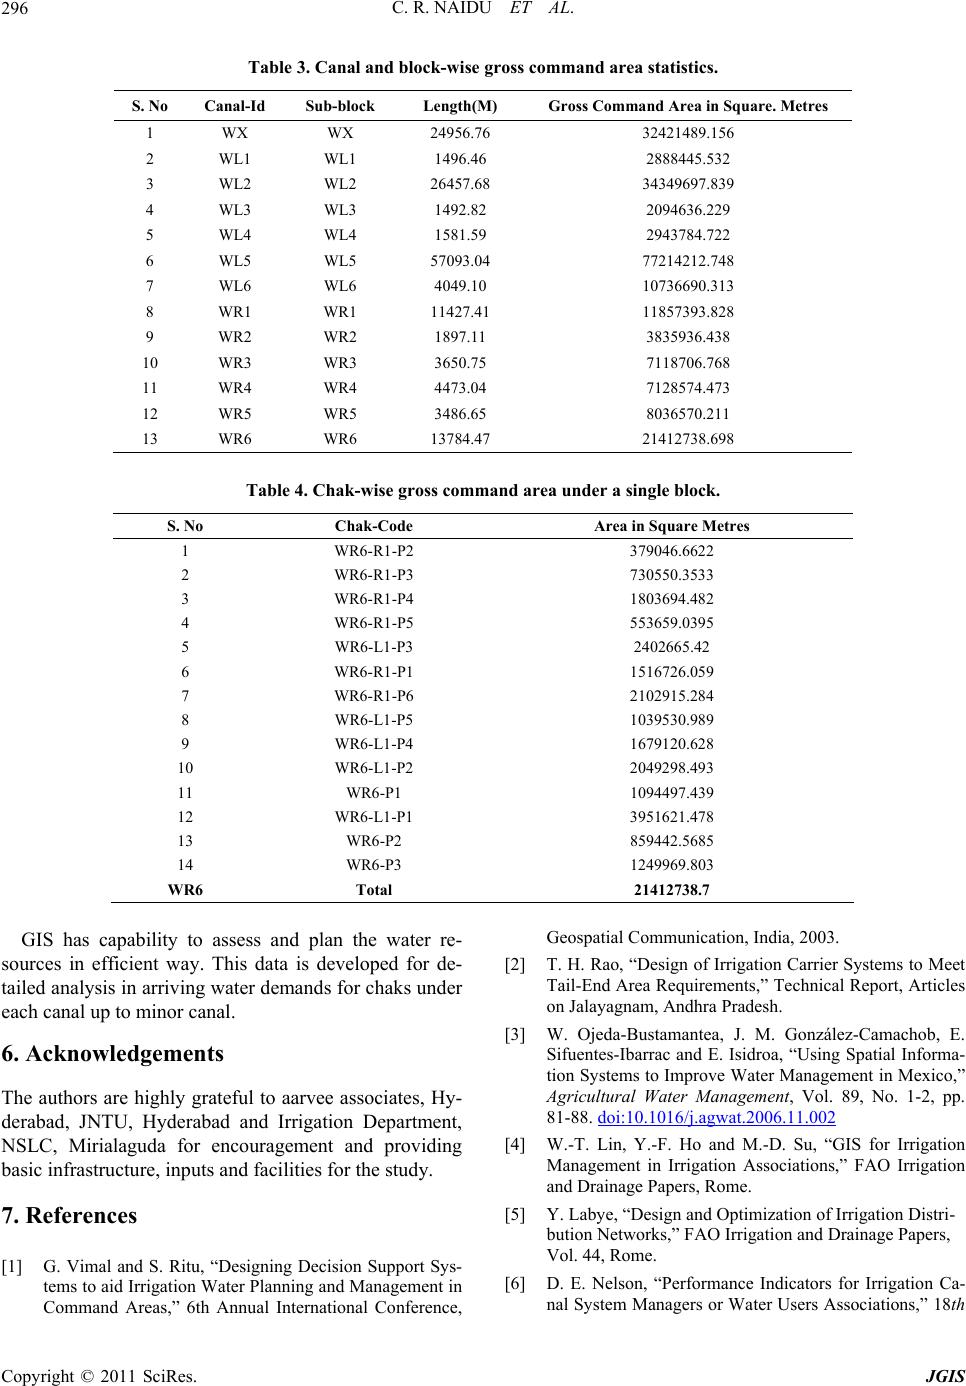
The gross comman d area under each block under each
canal and the lengths of the canals are given in Table 3.
The command area under WL2 Canal is shown in Figure
5 using spatial query.
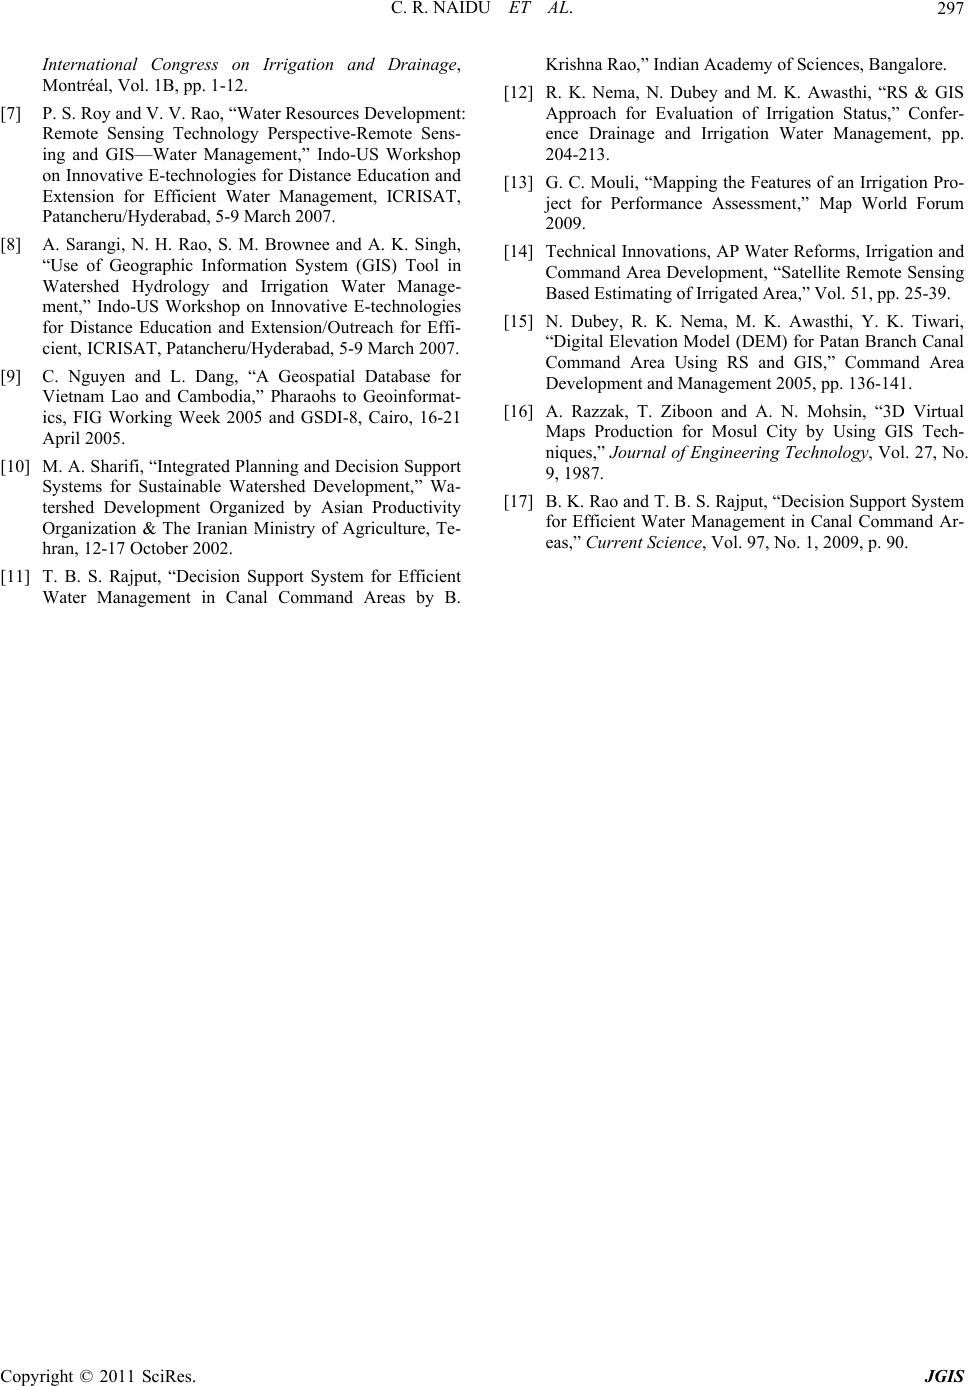
The gross command area of each chak under an indi-
vidual block i.e. WR6 is shown in Table 4.
The delineated block boundaries are compared with
the existing block maps. The measurements of block
areas and canal lengths in GIS are matching with the
statistics given by the irrigation department. The GIS
database found very usefu l in identification of canals and
corresponding block and chak boundaries. Due to the
hierarchy and the unique identity of block and chak un-
der each canal the spatial queries and retrieval of data
and results are more conven ient for decision making and
planning of water releases for effective water manage-
ment [17].
Copyright © 2011 SciRes. JGIS
C. R. NAIDU ET AL.
294
Figure 3. Canal netw ork representing line and nodes.
5. Conclusions
GIS plays an important role in Irrigation management. It
is necessary to develop a geospatial database that pro-
vides sufficient information for Irrigation experts and
Water Resources managers.
C
opyright © 2011 SciRes. JGIS
C. R. NAIDU ET AL. 295
Figure 4. Canal blocks and chaks from digital elevation model.
Figure 5. Command area under canal WL2 using spatial query.
C
opyright © 2011 SciRes. JGIS
C. R. NAIDU ET AL.
Copyright © 2011 SciRes. JGIS
296
Table 3. Canal and block-wise gross command area statistics.
S. No Canal-Id Sub-block Length(M) Gross Command Area in Square. Metres
1 WX WX 24956.76 32421489.156
2 WL1 WL1 1496.46 2888445.532
3 WL2 WL2 26457.68 34349697.839
4 WL3 WL3 1492.82 2094636.229
5 WL4 WL4 1581.59 2943784.722
6 WL5 WL5 57093.04 77214212.748
7 WL6 WL6 4049.10 10736690.313
8 WR1 WR1 11427.41 11857393.828
9 WR2 WR2 1897.11 3835936.438
10 WR3 WR3 3650.75 7118706.768
11 WR4 WR4 4473.04 7128574.473
12 WR5 WR5 3486.65 8036570.211
13 WR6 WR6 13784.47 21412738.698
Table 4. Chak-wise gross command area under a single block.
S. No Chak-Code Area in Square Metres
1 WR6-R1-P2 379046.6622
2 WR6-R1-P3 730550.3533
3 WR6-R1-P4 1803694.482
4 WR6-R1-P5 553659.0395
5 WR6-L1-P3 2402665.42
6 WR6-R1-P1 1516726.059
7 WR6-R1-P6 2102915.284
8 WR6-L1-P5 1039530.989
9 WR6-L1-P4 1679120.628
10 WR6-L1-P2 2049298.493
11 WR6-P1 1094497.439
12 WR6-L1-P1 3951621.478
13 WR6-P2 859442.5685
14 WR6-P3 1249969.803
WR6 Total 21412738.7
GIS has capability to assess and plan the water re-
sources in efficient way. This data is developed for de-
tailed analysis in arriving water demand s for chaks under
each canal up to minor canal.
6. Acknowledgements
The authors are highly grateful to aarvee associates, Hy-
derabad, JNTU, Hyderabad and Irrigation Department,
NSLC, Mirialaguda for encouragement and providing
basic infrastructure, inputs and facilities for the study.
7. References
[1] G. Vimal and S. Ritu, “Designing Decision Support Sys-
tems to aid Irrigation Water Planning and Management in
Command Areas,” 6th Annual International Conference,
Geospatial Communication, India, 2003.
[2] T. H. Rao, “Design of Irrigation Carrier Systems to Meet
Tail-End Area Requirements,” Technical Report, Articles
on Jalayagnam, Andhra Pradesh.
[3] W. Ojeda-Bustamantea, J. M. González-Camachob, E.
Sifuentes-Ibarrac and E. Isidroa, “Using Spatial Informa-
tion Systems to Improve Water Management in Mexico,”
Agricultural Water Management, Vol. 89, No. 1-2, pp.
81-88. doi:10.1016/j.agwat.2006.11.002
[4] W.-T. Lin, Y.-F. Ho and M.-D. Su, “GIS for Irrigation
Management in Irrigation Associations,” FAO Irrigation
and Drainage Papers, Rome.
[5] Y. Labye, “Design and Optimization of Irrigation Distri-
bution Networks,” FAO Irrigation and Drainage Papers,
Vol. 44, Rome.
[6] D. E. Nelson, “Performance Indicators for Irrigation Ca-
nal System Managers or Water Users Associa tions,” 18th
C. R. NAIDU ET AL.297
International Congress on Irrigation and Drainage,
Montréal, Vol. 1B, pp. 1-12.
[7] P. S. Roy and V. V. Rao, “Water Resources Development:
Remote Sensing Technology Perspective-Remote Sens-
ing and GIS—Water Management,” Indo-US Workshop
on Innovative E-technologies for Distance Education and
Extension for Efficient Water Management, ICRISAT,
Patancheru/Hyderabad, 5-9 March 2007.
[8] A. Sarangi, N. H. Rao, S. M. Brownee and A. K. Singh,
“Use of Geographic Information System (GIS) Tool in
Watershed Hydrology and Irrigation Water Manage-
ment,” Indo-US Workshop on Innovative E-technologies
for Distance Education and Extension/Outreach for Effi-
cient, ICRISAT, Patancheru/Hyderabad, 5-9 March 2007.
[9] C. Nguyen and L. Dang, “A Geospatial Database for
Vietnam Lao and Cambodia,” Pharaohs to Geoinformat-
ics, FIG Working Week 2005 and GSDI-8, Cairo, 16-21
April 2005.
[10] M. A. Sharifi, “Integrated Planning and Decision Support
Systems for Sustainable Watershed Development,” Wa-
tershed Development Organized by Asian Productivity
Organization & The Iranian Ministry of Agriculture, Te-
hran, 12-17 October 2002.
[11] T. B. S. Rajput, “Decision Support System for Efficient
Water Management in Canal Command Areas by B.
Krishna Rao,” Indian Academy of Sciences, Bangalore.
[12] R. K. Nema, N. Dubey and M. K. Awasthi, “RS & GIS
Approach for Evaluation of Irrigation Status,” Confer-
ence Drainage and Irrigation Water Management, pp.
204-213.
[13] G. C. Mouli, “Mapping the Features of an Irrigation Pro-
ject for Performance Assessment,” Map World Forum
2009.
[14] Technical Innovations, AP Water Reforms, Irrigation and
Command Area Development, “Satellite Remote Sensing
Based Estimating of Irrigated Area,” Vol. 51, pp. 25-39.
[15] N. Dubey, R. K. Nema, M. K. Awasthi, Y. K. Tiwari,
“Digital El evation Model (DEM) for Patan Branch Canal
Command Area Using RS and GIS,” Command Area
Development and Management 2005, pp. 136-141.
[16] A. Razzak, T. Ziboon and A. N. Mohsin, “3D Virtual
Maps Production for Mosul City by Using GIS Tech-
niques,” Journal of Engineering Technology, Vol. 27, No.
9, 1987.
[17] B. K. Rao and T. B. S. Rajput, “Decision Support System
for Efficient Water Management in Canal Command Ar-
eas,” Current Science, Vol. 97, No. 1, 2009, p. 90.
Copyright © 2011 SciRes. JGIS