Journal of Software Engineering and Applications
Vol. 5 No. 8 (2012) , Article ID: 21953 , 9 pages DOI:10.4236/jsea.2012.58068
Comparison of Radial Basis Function Neural Network and Response Surface Methodology for Predicting Performance of Biofilter Treating Toluene
![]()
1Environmental Biotechnology Division, National Environmental Engineering and Research Institute, Nagpur, India; 2Department of Aerospace Engineering, Indian Institute of Sciences, Bangalore, India; 3Solid Waste Management Division, National Environmental Engineering and Research Institute, Nagpur, India.
Email: sn_mudliar@neeri.res.in, *omkar@aero.iisc.ernet.in
Received May 8th, 2012; revised June 20th, 2012; accepted June 30th, 2012
Keywords: VOC; Toluene; Biofilter; Response Surface Methodology; Radial Basis Function Neural Network
ABSTRACT
Biofiltration is emerging as a promising cost effective technique for the Volatile Organic Compounds (VOCs) removal from industrial waste gases. In the present investigation a comparative modeling study has been carried out using Radial Basis Function Neural Network (RBFN) and Response Surface Methodology (RSM) to predict and optimize the performance of a biofilter system treating toluene (a model VOC). Experimental biofilter system performance data collected over a time period by daily measurement of inlet VOC concentration, retention time, pH, temperature and packing moisture content was used to develop the mathematical model. These independent variables acted as the inputs to the mathematical model developed using RSM and RBFN, while the VOC removal efficiency was the biofilter system performance parameter to be predicted. The data set was divided into two parts: 60% of data was used for training phase and remaining 40% of data was used for the testing phase. The average % error for RSM and RBFN were 7.76% and 3.03%, and R2 value obtained were 0.8826 and 0.9755 respectively. The results indicated the superiority of RBFN in the prediction capability due to its ability to approximate higher degree of non-linearity between the input and output variables. The optimization of biofilter parameters was also done using RSM to optimize the biofilter performance. RSM being structured in nature enabled the study of interaction effect between the independent variables on biofilter performance.
1. Introduction
Biofiltration is a promising cost effective technique for the treatment of waste gases containing VOCs, especially at low concentration and high flow rate [1,2]. The uncomplicated flexible design, low operational and maintenance costs along with high removal efficiency gives biofilter an edge over other physico-chemical techniques for the VOC removal. The biofilter system is operated over a time period and VOC removal efficiency is monitored as a function of operational parameters. After the system becomes stable, one of the most important stages in a biological process is modeling and optimization to increase the efficiency of the process.
There are two ways in which a biofilter model can be developed. It can be derived in deductive manner using laws of nature called mechanistic modeling or it can be built using set of data obtained during practical experimentation with the system called statistical modeling. Traditionally biofilter performance has been modeled using process based models that are based on reaction kinetics, mass balance principles and plug flow in air stream [2-4]. However, this depends on numerous model parameters and obligates information on specific growth rate of micro-organisms, biofilm thickness, half saturation constant, diffusion coefficient, partition coefficient, yield etc. The accurate estimation of some of these parameters requires elaborate technical facilities and expertise, the absence of which hinders the model’s precision and limits its application and reliability. Moreover in the experimental process optimization, one parameter is varied at a time and keeping the other constant. This technique is not only time-consuming but also does not depict the complete effects of the parameters in the process and ignores the combined interactions between the physicochemical parameters.
In present investigation, we have applied data driven approach in order to predict and optimize the removal efficiency of biofilter treating VOC using radial basis function neural network (RBFN) and response surface methodology (RSM). Response Surface Methodology is a collection of mathematical and statistical techniques that are useful for modeling and analysis of problems in which a response of interest is influenced by several variables and the objective is to optimize this response [5, 6]. Being structured in nature RSM is effective in studying the effect of the independent variables, alone or in combination, in the processes as well as sensitivity analysis of the system. Although RSM has many advantages it is hard to say that it is applicable to all optimization and modeling studies as it is applicable only to quadratic approximation and cannot approximate high degree of nonlinearity [7]. The last decade has seen a lot of biologically inspired computing techniques being developed [8-10]. Artificial Neural Networks (ANN) is an information processing system that is loosely modeled on the organization of the human brain, and which possesses highly interconnected processing elements. ANN is now the most widely used computing tool used in biotechnology with applications ranging from Recognizing Genes, Pattern Recognition to Biological Systems Analysis etc [11,12]. ANN is generic in structure and possesses the ability to learn from the past data. Compared to RSM it does not require to specify suitable fitting function as well as it has got universal approximation capability, i.e. it can approximate almost all kinds of non-linear functions including quadratic functions, which is not the case with RSM.
Toluene is a model VOC and listed as a priority pollutant by the US Environmental Protection Agency [13, 14]. In the present investigation, toluene was treated in biofilter system and experimental data was collected from the system during actual experiment with biofilter system. The input system parameters namely; toluene inlet concentration, retention time, temperature, moisture content of the biofilter bed, pH and output parametertoluene removal efficiency were monitored on daily basis. The prediction of toluene removal in biofilter using RBFN and RSM based models has been attempted and discussed in detail in this paper.
2. Materials and Methods
2.1. Biofilter Bench Scale Unit
The biofilter was fabricated with a cylindrical acrylic pipe of 94 cm in total height and 19.4 cm in internal diameter. The unit had three sampling ports, one each at the top, middle and bottom for taking the samples of bed medium for analysis. Gas sampling ports were also located at the bottom and top of the column. The total packed height was 42.5 cm corresponding to a filter media volume of 12.6 L. The biofilter was fed with toluene vapors generated by vaporization of liquid toluene with a small air stream in an impinger maintained at a constant temperature of 35˚C ± 2˚C.
2.2. Biofilter Media
Cow-dung compost having a maturity of five months and C/N ratio of 0.37 was obtained from a dairy plant in Nagpur, India. Woodchips (1 - 1.5 cm × 1 - 1.5 cm × 0.1 - 0.2 mm) collected from a local furniture shop were used as bulking agent with compost in equal volumetric proportion. The bottom portion 6 mm of the biofilter were packed with woodchips to minimize clogging of the inlet port and ensure proper air distribution. Above this, a mixture of compost and woodchips (1:1 v/v) was packed as the medium for biofiltration. The bed included a 2 cm layer of woodchips in the middle to allow for sampling at half-height. Initially, 100 ml mineral medium was added to the packing material, and the damp packing was placed into the biofilter. The mineral medium contained (in g·L−1 in distilled water) K2HPO4 0.615, KH2PO4 0.385, MgSO4·6H2O 0.25, NH4NO3 1, NaCl 1, CaCl2 0.026, the pH of the medium was adjusted to 7.0 ± 0.1 using dilute HCl (0.1 N). Subsequently, mineral medium (100 - 300 mL) was added weekly from the top of the biofilter ensured moisture content of packing medium in the range of 60% - 70% (wet basis) and provided nutrient to the process. As in most biofilters, nutrient could have been partially limiting pollutant removal, although this was not investigated. Ample nutrient supply has been linked to excess biomass growth and process instabilities. The initial porosity of packing material (determined by water logging of a known packing volume) was 60% [2].
2.3. Biofilter Operation and Analysis
The biofilter was started with an initial toluene loading of 10 gtoluene/ /h for acclimatization. After acclimatization period, the biofilter was operated continuously at various retention times in different phases of operation. The samples of waste gas from the inlet and outlet of the biofilter were collected by scrubbing in 20 ml methanol for 10 min. Inlet and Outlet gas concentration was measured using Gas Chromatograph (Perkin Elmer Clarus- 5000, USA) equipped with FID detector and 30 meter Equity-5 (Sigma-Aldrich) capillary column. A control dynamics model pH meter was used for monitoring the pH of different liquid samples. The biofilter packing bed sample was periodically withdrawn for analysis and was compensated by addition of additional packing media. The basic process parameters i.e. moisture content, pH, retention time, temperature and inlet concentration were kept in the range during biofilter operation as reported in Table 1.
3. Modeling Methodology
Response Surface methodology and Radial Basis Function based predictive models were developed having inputs as retention time, toluene inlet concentration, temperature, pH and moisture content measured on daily basis. The output of the model was toluene removal efficiency in biofilter system. The data generated from the biofilter system was collected over a period of time and was first feed to RSM model and a data set was generated yielding the maximum R2 value through RSM model and which was further used for training the RBFN network.
3.1. Response Surface Modeling
Response surface methodology is collection of statistical and mathematical techniques used for process optimization and drawing the empirical relationship between independent variables and the response of the system using the quantitative data collected from experiment [5,6]. In biological system like biofilter it is not possible to maintain the levels of independent variables at some pre-defined levels before startup and hence data collected from biofilter over a period of time was used to build model equation for predicting the effect of inlet concentration, retention time, temperature, moisture content and pH on biofilter toluene removal efficiency. Modeling was started with quadratic model including linear, squared and interaction terms. The relationship of independent variables and response was calculated using following secondorder polynomial equation
 (1)
(1)
where y is the predicted response; β0 a constant; βi the linear coefficient; βii the squared coefficient; and βij the product-coefficient, n is the number of factors [12]. The

Table 1. Range of parameters during biofilter operation.
significant terms were found by analysis of variance (ANOVA) for each response. The P values were used as tool to check the significance of each of the coefficients, which in turn are necessary to understand the pattern of mutual interactions between the test variables. The smalller the magnitude of P, more significant is the corresponding coefficient. The model adequacies were checked by R2 and predictive error sum of squares (PRESS). A model with large R2 and low PRESS values is considered to be a good model [6,15,16].
3.2. Artificial Neural Network Modeling
An Artificial Neural Network is an adaptive, most often nonlinear system that learns to perform a function from data. Neural networks as they are commonly referred are composed of simple elements operating in parallel. These elements are inspired by biological nervous systems. As in nature, the network function is determined largely by the connections between elements. We can train a neural network to perform a particular function by adjusting the values of the connections (weights) between elements. Commonly neural networks are adjusted, or trained, so that a particular input leads to a specific target output. After the training phase, the Artificial Neural Network parameters are fixed and the system are deployed to solve the problem at hand i.e. the testing phase [8,16].
The nonlinear nature of the neural network processing elements provides the system with lots of flexibility to achieve practically any desired response. The number of input neurons represents the independent variables of the system and the output neurons represent the response of the system.
To model the performance of biofilter, neural based simulations were carried using Radial Basis Function (RBF) Neural Network embedded into a two-layer feedforward neural network (Figure 1) [8]. The network is characterized by sets of inputs and outputs and in between them there is a layer of processing units called

Figure 1. Architecture of radial basis function neural network.
hidden units or nodes. The nodes within each layer are fully connected to the previous layer. The input variables of the system are connected to the input nodes, and are passed to the hidden layer without applying weights. The mechanism of RBF is similar to Gaussian density function which is defined by a “center” position and a “width” parameter. The Gaussian function gives highest response when the distance between incoming variable and centre position is least. It decreases monotonically as the distance increases. The width of RBF unit controls the rate of decrease. In order to determine the parameters of RBF unit three steps are carried out. Firstly, some sort of clustering algorithm is used to determine the unit centers. In the next step widths are determined by nearestneighbor method and finally multiple regression technique is used to calculate the weights connecting the RBF unit and the output units [8].
3.3. Software Used
Response surface modeling was carried using statistical software MINITAB 15; while MATLAB version 7.0 was used for RBF Neural Network based predictive modeling [8,17].
4. Results and Discussion
4.1. Experimental Biofilter Performance Data
The performance of biofilter for toluene removal was experimentally monitored over a period of time with varying process parameters. The biofilter performance results as a function of varying flow rate, temperature, pH, moisture content, inlet toluene concentration and removal efficiency is illustrated in Figure 2. The Pressure drop values were significantly low and did not cause any significant operational problems.
4.2. Radial Basis Function Neural Network Based Biofilter Performance Prediction
Radial basis function neural network (RBFN) is feed forward-type artificial neural network with universal approximation properties [8]. The network consists of three input layers, kernel layer and an output layer. The input layer is simply a fan-out layer and does not do processing. The kernel or hidden layer performs a nonlinear mapping from the input space into a usually higher dimensional space in which the patterns become linearly separable. The RBFN are local approximators as compared to other neural techniques which are global approximators. The output of ith kernel neuron for x input vector of dimension n is given by:

 (2)
(2)
where  is the center of the ith kernel neuron for the jth input variable, L is the number of kernel neurons and σi is the width of the ith kernel neuron. The output value of ith output neuron is equal to the summation of the weighted outputs of the kernel neurons and bias term of the output neurons, and is described mathematically as

 (3)
(3)
where wio is the bias value of the ith output neuron and O is the number of output neurons.
The inputs to the radial basis function network are the five independent parameters (variables) of the biofilter
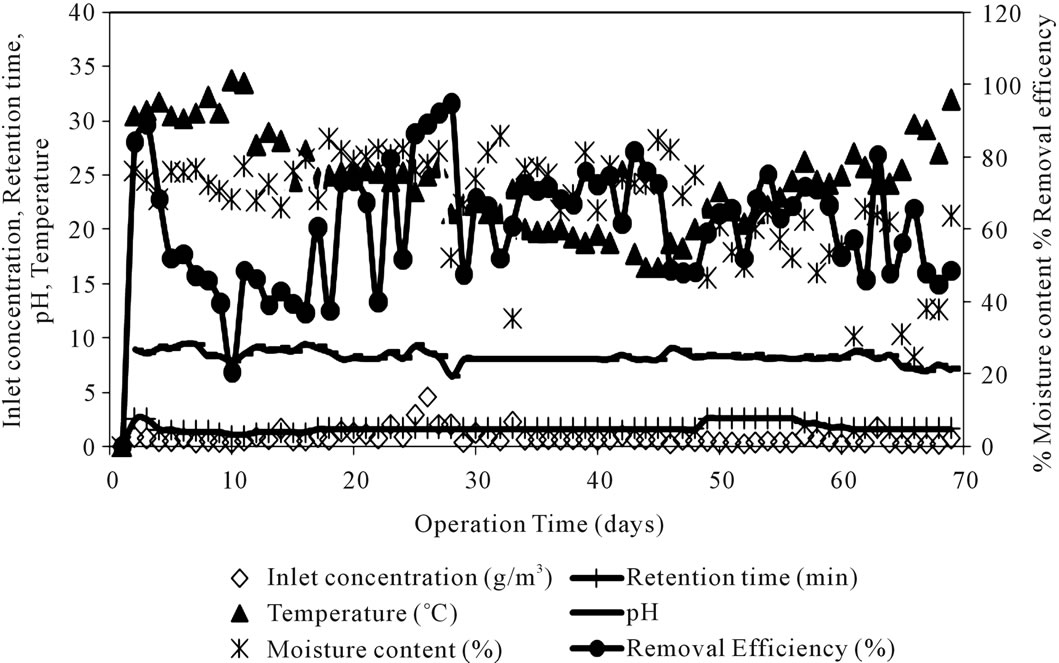
Figure 2. Time course profile of biofilter parameters and performance.
system namely inlet toluene concentration, retention time, pH, moisture content and temperature and the output of the network is the toluene removal efficiency of the biofilter.
A total 67 experimental data set were used, out of which 40 datasets i.e. 60% were used in the training phase and remaining 27 datasets i.e. 40% were used for testing phase (Table 2). All the samples were normalized in the range of 0 - 1. It was done using following equation [8].
 (4)
(4)
where yk, ymin, ymax are kth dataset, minimum of data set value and maximum of data set value respectively. The R2 value obtained was 0.9755; the network parameters used to train RBF neural network are as represented in Table 3.
4.3. Response Surface Methodology Based Biofilter Performance Prediction
Application of RSM implies the following empirical relationship (Equation (2)) between the toluene removal efficiency of the biofilter and independent studied variables:
 (5)
(5)
where A, B, C, D and E are inlet concentration of tolueneretention time, temperature, pH and moisture content respectively of biofilter system. The fit of the model was also expressed by coefficient of determination R2 = 0.8826, this implies that 88% of variations for the process efficiency are explained by independent variables and also means that model did not explain only about 12% of variations. This indicates that the model adequately represent the real relationships among the selected reaction factors [5]. Contour plots of responses were plotted in order to the study the optimal conditions. The coefficient estimates and the corresponding P values suggested that, among the parameters used in analysis C (temperature), second order interaction between A2 (inlet concentration) and C2 (temperature) were found to have significant effect. Similarly mutual interaction between A × D (inlet concentration and pH), A × E (inlet concentration and moisture) and C × D (temperature and pH) were also found to have significant effect on removal efficiency of biofilter. Other interactions were found to be insignificant. Contour plots of the RSM were drawn as a function of two factors at a time, holding all other factors at fixed levels. Those plots are helpful in understanding both the main and the interaction effects of these factors (Figure 3).
4.4. Comparison between RSM and RBFN Model for Biofilter Performance Prediction
RSM and RBFN predictive model were compared on the basis of their prediction accuracy of biofilter performance and insights of direct and interaction effects of the process parameters on the response of the system (toluene removal efficiency in biofilter). The predicted value of removal efficiency was compared with predicted value and the absolute percentage error was computed as:

Table 2. Input and output parameters for training and testing of RBFN
 (a)
(a) (b)
(b) (c)
(c) (d)
(d)
Figure 3. (a) Contour plot of biofilter efficiency as a function of inlet concentration and temperature; (b) Contour plot of biofilter efficiency as a function of inlet concentration and moisture content (%); (c) Contour plot of biofilter efficiency as a function of retention time and pH; (d) Contour plot of biofilter efficiency as a function of temperature and pH.

Table 3. RBFN network parameters.
 (6)
(6)
where R.Eexpt is the experimental value and R.Epred is the predicted value of the response. The absolute error in case of RSM with respect to experimental removal efficiency was found to be in the range of 0.004% to 19.4% with average percentage error of 7.76%. Similarly for RBFN, it was found to be in the range of 0.06% to 16.05% with average percentage error of 3.03%. Comparison between experimental and predicted values of biofilter performance using RBFN and RSM is as shown in Figure 4 and Table 4.
4.5. Effect of Optimum Operating Conditions on Biofilter Performance
Optimization was done in order to maximize removal efficiency greater than 85% of toluene removal efficiency from biofilter. Biofilter being a semi-controlled system, three optimization conditions were generated which gave the flexibility to optimize parameters such as pH and inlet loading. The desirability function was found to be 0.98 for all the combinations which further supports that the optimized values were ideal. 3D surface graphs were studied which indicated that the highest percentage


Table 4. Comparison between experimental and predicted values of biofilter performance using RBFN and RSM.
of removal efficiency is obtained, when the temperature is at lower side i.e. in between 21˚C to 25˚C. Whereas, moisture content of the biofilter bed in the range of 54% - 71%, accompanied by pH in the range of 6.5 - 8.00, yielded higher removal efficiency. Further, emphasis was given to lower retention time and based on these assumptions an optimum conditions were predicted (Table 5). The biofilter was operated over a period of time under the predicted optimized conditions. The experimental results obtained showed good agreement between predicted and experimentally obtained biofilter performance (Table 5).
5. Conclusion
In this study, a mathematical model has been developed by using RSM and RBFN based artificial neural network as a performance prediction tool for biofilter system using toluene as a case study. Further, optimization of the

Figure 4. Experimental and predicted biofilter performance for toluene removal by RSM and RBFN.

Table 5. RSM predicted optimum biofilter parameters for maximizing performance.
system was done with an aim to optimize the performance of the biofilter. RSM and RBF methodologies were compared for their predictive capabilities. Average % error in case of RSM was found to be 7.76%, whereas for RBF, it was found to be 3.03%. Similarly R2 for RBF was 0.9755, and for RSM it was found to be 0.8826, indicating the superiority of RBF in the prediction capability due to its ability to approximate higher degree of non-linearity between input and output variables. However, RSM being structured in nature was useful to study the interaction effect between various independent variables. Optimization could be also done using RSM and the predicted data obtained was found to be in good agreement with the experimental observations. The predicted optimum conditions were useful to carry out further studies related to biofilter as they gave the range in which the biofilter should be operated (maintained) to get maximum removal. The proposed statistical and neural network models based on RSM and RBFN can be better alternatives to the conventional process based models for biofilter performance prediction for VOC removal.
6. Acknowledgements
The authors would like to gratefully acknowledge the financial support provided by Mitsui Environmental Engineering Trust (MEET), New Delhi for carrying out this research work.
REFERENCES
- E. R. Rene, D. V. S. Murthy and T. Swaminathan, “Performance Evaluation of a Compost Biofilter Treating Toluene Vapours,” Process Biochemistry, Vol. 40, No. 8, 2005, pp. 2771-2779. doi:10.1016/j.procbio.2004.12.010
- J. S. Devinny, M. A. Deshusses and T. S. Webster, “Biofiltration for Air Pollution Control,” CRC Press, New York, 1999.
- S. P. P. Ottengraf and A. H. C. Van den Oever, “Kinetics of Organic Compound Removal from Waste Gases with a Biological Filter,” Biotechnology and Bioengineering, Vol. 25, No. 12, 1983, pp. 3089-3102. doi:10.1002/bit.260251222
- Z. Shareefdeen, B. C. Baltzi, Y. S. Oh and R. Bartha, “Biofiltration of Methanol Vapor,” Biotechnology and Bioengineering, Vol. 41, No. 5, 1993, pp. 512-524. doi:10.1002/bit.260410503
- P. Mathews, “Design of Experiments with MINITAB,” Pearson Education Press, Upper Saddle River, 2005.
- D. C. Montgomery, “Design and Analysis of Experiments,” 5th Edition, Wiley, New York, 2011.
- D. Bas and I. H. Boyaci, “Modeling and Optimization II: Comparison of Estimation Capabilities of Response Surface Methodology with Artificial Neural Network in Biochemical Reaction,” Journal of Food Engineering, Vol. 78, No. 1, 2007, pp. 836-845.
- B. S. Narendra, P. V. Sivapullaiah, S. Suresh, S. N. Omkar, “Prediction of Unconfined Compressive Strength of Soft Grounds Using Computational Intelligence Techniques: A Comparative Study,” Computers and Geotechnics, Vol. 33, No. 3, 2006, pp. 196-208. doi:10.1016/j.compgeo.2006.03.006
- C. Ferreira, “Gene Expression Programming: Mathematical Modeling by an Artificial Intelligence,” 2nd Edition, Springer-Verlag, Berlin, 2006.
- M. B. Kasiri, H. Aleboy and A. Aleboyeh, “Modeling and Optimization of Heterogeneous Photo-Fenton Process with Response Surface Methodology and Artificial Neural Networks,” Environmental Science and Technology, Vol. 42, 2008, pp. 7970-7975. doi:10.1021/es801372q
- S. S. Tambe, B. D. Kulkarni and P. B. Deshpande, “Elements of Artificial Neural Network with Selective Application in Chemical and Biological Sciences,” Simulation and Advance Control Inc., Louisville, 1996.
- K. M. Desai, S. A. Survase, P. S. Saudagar, S. S. Lele and R. S. Singhal, “Comparison of Artificial Neural Network (ANN) and Response Surface Methodology (RSM) in Fermentation Media Optimization: Case Study of Fermentative Production of Scleroglucan,” Biochemical Engineering Journal, Vol. 41, No. 3, 2008, pp. 266-273. doi:10.1016/j.bej.2008.05.009
- L. H. Keith and W. A. Telliard, “Priority Pollutants,” Environmental Science and Technology, Vol. 13, No. 4, 1979, pp. 416-423. doi:10.1021/es60152a601
- J. P. Maestre, X. Gamisans, D. Gabriel and J. Lafuente, “Fungal Biofilter for Toluene Biofiltration: Evaluations of the Performance with Four Packing Materials under Different Operating Conditions,” Chemosphere, Vol. 67, No. 4, 2007, pp. 684-692. doi:10.1016/j.chemosphere.2006.11.004
- S. Raissi and R. E. Farsani, “Statistical Process Optimization through Multi-Response Surface Methodology,” World Academy of Sciences, Engineering and Technology, Vol. 51, 2009, pp. 267-271.
- M. Basri, Rahman, R. N. Z. R. A. Rahman, A. Ebrahimpour, A. B. Salleh, M. B. A. Gunawan and E. R. Rahman, “Comparison of Estimation Capabilities of Response Surface Methodology (RSM) with Artificial Neural Network (ANN) in Lipase-Catalyzed Synthesis of Palm-Based Wax Ester,” BMC Biotechnology, Vol. 7, No. 53, 2007.
- R. J. Schilling and S. L. Harries, “Applied Numerical Methods for Engineers Using MATLAB and C,” Thomson Asia Ltd., Singapore City, 2002.
NOTES
*Corresponding author.