Modern Economy
Vol. 3 No. 3 (2012) , Article ID: 19166 , 11 pages DOI:10.4236/me.2012.33042
Trade Integration in East Asia: An Empirical Assessment
School of Development Economics, National Institute of Development Administration, Bangkok, Thailand
Email: sasatra@nida.ac.th
Received March 26, 2012; revised April 15, 2012; accepted April 24, 2012
Keywords: Intra-Regional Trade; Intra-Industry Trade; Gravity Model
ABSTRACT
This study employs a gravity model of bilateral trade flows at the one-digit level of the standard international trade classification (SITC) product categories over the period of 1996 to 2005 to provide an empirical assessment of regional trade integration in East Asia. The formation of the ASEAN free trade area agreement is found to have both positive and negative effects on trade both among members and between members and the rest of the world, subject to SITC product category. Although the differences between actual and predicted levels of intra-ASEAN trade and of trade between ASEAN and other East Asian countries have been reduced, there remain product categories indicating a low degree of trade integration. Those product categories include food and live animals, machinery and transport equipment, and miscellaneous manufactured articles. Finally, the level of intra-industry trade intensity based on predicted trade values confirms that ASEAN is involved in intra-industry trade among its members more than trade with other East Asian countries.
1. Introduction
Trade integration has always been an important part of regional and economic integration in East Asia. In 1992, six member countries of the Association of Southeast Asian Nations (ASEAN) signed the ASEAN Free Trade Area (AFTA) agreements1. The primary goals of these agreements were to enhance trade integration and increase ASEAN’s competitiveness as a production base in the world market through the reduction and elimination of intra-trade barriers among its members2. Despite the fact that AFTA was one of the most ambitious attempts at regional integration in Asia, its actual achievements have been limited (Pomfret [2]). The effects of regional integration, especially trade integration, are always a concern of policymakers. Empirical studies on this subject are particularly important, as they provide useful trade policy information on such issues as trade creation and diversion effects. This information helps to indicate the benefits of regional trade cooperation to a country, while pointing out those sectors that are likely to be harmed from higher market competition.
For empirical frameworks, a gravity model has been widely used as the workhorse for analyzing the patterns of bilateral trade flows and to examine the effects of regional trade cooperation. In the context of East Asia, a large number of empirical studies employ a gravity model to examine the effects of several regional trade agreements on trade flows and to estimate the level of trade potential. For instance, Derosa [3] shows the benefits of the ASEAN-U.S. Free Trade Agreement (FTA) that would substantially increase ASEAN’s total exports. Sudsawasd and Mongsawad [4] find large trade potentials remaining to be explored between the ASEAN-5 (Indonesia, Malaysia, Philippines, Singapore, and Thailand) and ASEAN’s four major trading partners (China, Japan, India, and the United States). In addition, East Asian countries are found to have been the leading exporters to developed countries since the 1970s (Filippini and Molini [5]).
Nonetheless, the analysis from the previous literature on East Asian trade has mostly suffered from data limitation. Since most use the aggregate level of bilateral trade flows, they lack information on sectoral trade. Policy recommendations drawn from those studies may not be effective for policymakers seeking guidance on the supervision of domestic sectoral policies. Hence, in this study, the gravity model of East Asian export and import flows is employed at the one-digit level of standard international trade classification (SITC) product categories over the period of 1996 to 2005 to provide a more detailed examination of trade integration in East Asia than has been done in the past.
A number of AFTA-related variables are introduced in the model to examine their effects on East Asian trade. In addition, the predicted trade levels for the ASEAN-5 are estimated. These estimates provide information for further analysis on East Asian regional trade integration regarding several aspects. In this study, they are used to assess the degree of ASEAN-5 trade integration by comparing it to actual trade values for all product categories. If actual trade is far below its predicted level, it would suggest a low degree of trade integration in that particular sector. In addition, this study also analyzes the level of intra-industry trade (IIT) intensity in ASEAN-5 intraregional trade and in trade between the ASEAN-5 and other East Asian countries. In contrast to previous studies (e.g., Sawyer, et al. [6]), the calculation of the IIT index is based on predicted trade values, as this study argues that it is a more accurate estimate of intra-industry trade levels.
The outcomes of this study will, hopefully, provide new insights for trade policymakers to make appropriate adjustments on East Asian trading strategies. For instance, sectors that are found to trade below their trade potentials should be one of the top priorities for deepening East Asian trade integration regimes.
The structure of this paper is organized as follows. In the second section, the empirical model is presented. Data and empirical issues are also discussed. The third section contains estimation results and empirical analysis on East Asian trade integration. Finally, the concluding remarks are presented in the fourth section.
2. Methodology, Data, and Empirical Issues
A gravity model of bilateral trade flows has been widely used in explaining the volumes of trade between countries. It is built on Newton’s Law on gravitational force between two objects, in which the gravitational force (trade flow) depends on the mass (the size of an economy) of each object (country) and the distance between them. In general, bilateral trade flows are positively related to the economic sizes of both trading countries, and negatively related to the distance between trading countries3.
Since factor determinants of export flows can be quite different from those of import flows, the models of bilateral export and import flows are therefore estimated separately. In addition, the models are augmented by including a set of AFTA-related variables, specified as follows:
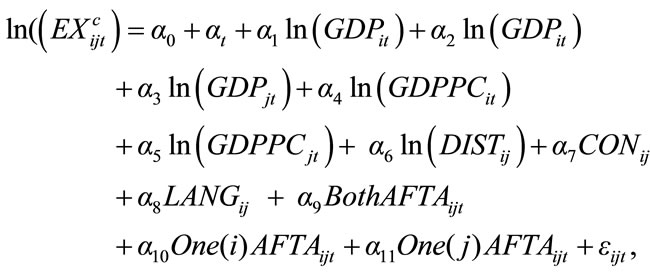 (1)
(1)
and
 (2)
(2)
where  is the intercept term;
  is the time-specific effect on year t.
  is bilateral exports of a commodity c from country i to country j and
  is bilateral imports of country i from country j. GDP is the gross domestic product; GDPPC is GDP per capita;
  is average geographic distance between i and j, measured in kilometers;
  is a contiguity dummy, which is unity if i and j adjoin land borders and zero otherwise;
  is a common language dummy, which is unity if i and j have a common language and zero otherwise.
AFTA-related variables are as follows.  is a dummy variable which is unity if both i and j are AFTA members and zero otherwise;
  is a dummy variable which is unity if only i (not j) is an AFTA member and zero otherwise;
  is a dummy variable which is unity if only j (not i) is an AFTA member and zero otherwise.
  is the error term, which is assumed to be normally distributed with zero mean and constant variance for all observations.
 and
and  variables usually measure the economic size and level of development of importing and exporting countries. They are believed to capture the potential demand of the importing country and potential supply of the exporting country. And the coefficients are normally expected to be positive. However, as noted by Kreinin and Plummer [9], the
  variable can also be used to measure labor costs and returns to capital. The estimated coefficient of this variable can be subjected to multiple interpretations. For instance, if
  measures labor costs, an exporting country with a larger
  may export less due to higher cost of production. Similarly, for the coefficient of the
  variable, a country with a higher GDP may present larger domestic demands. If domestic firms, facing with production constraints, decide to sell more in a domestic market (production may be biased toward this domestic demand), they may have less product available for export. Therefore, the estimated coefficients of
  and
and  variables are hypothesized to be ambiguous.
For variables measuring trade transportation and transacttion costs, the estimated coefficients of the  variable is hypothesized to be negative, as trade is expected to decline with distance between trading countries; whereas, a common land border (
 ) or similar language (
 ) are expected to influence trade positively.
The parameters of interest are the coefficients of the
 ,
, 
 , and One(j)AFTA
  variables. If AFTA increases trade among its members,
  may be positive; whereas if AFTA causes changes in the structural trade and production of its members, resulting in less trade, then
  may be negative. When one country is an AFTA member and the other is not, the hypothesized signs of
  and
and  are also unclear. If trade is diverted away from non-AFTA members whose productions are more efficient, then the coefficients may be negative. In contrast, AFTA can possibly induce more trade between members and non-members. An AFTA member may expand its production base in ASEAN countries and export more to non-AFTA members (or import more primary products from non-AFTA members). Hence, there is a combination of trade creation and trade diversion effects from the AFTA formation. Thus,
  ,
,  , and
, and  could be positive or negative.
Unlike previous studies (e.g., Rose [10], Lee and Shin [11], etc.) that usually assume that the symmetric effects of one country being part of regional integration are the same regardless of country i or j, for example  4, this study separates the effects of i and j AFTA membership since the effects may be completely different,
 . Besides, this study does not break up trade creation and diversion effects, since it requires knowing more detailed information such as industry cost structure in each country.
The assumptions mentioned above regarding the mean and variance of the error term may be violated in a standard pooled ordinary least square (OLS) model estimation, providing biased estimates (Baltagi, et al. [12]). This is because the model may not be able to capture the whole space of all possible factors that must be controlled (such as historical factors, cultural factors, etc.). In order to control for this heterogeneity problem, the fixed effects (FE) model is generally employed by introducing country-pair fixed effects,  , to capture the effects of all other omitted country-pair specifics that remain constant over time5.
However, the inclusion of country-pair effects may undermine the effects of other variables that are constant over time (Wei and Frankel [14]). Cheng and Wall [15] propose another alternative specification of the FE model, known as the unrestricted FE model specification6, in which a trade variable is estimated by regressing it on GDP, GDP per capita, and regional trade agreement dummies. Hence, the export and import models are expressed as follows7:
 (3)
(3)
and
 (4)
(4)
Bilateral trade data are taken from the International Trade Center, UNCTAD,’s Statistics for International Trade Analysis (SITA) CD-Rom. The data are based on the SITC, revision 3, covering 224 trading countries during the period from 1996 to 2005. In this study, trade data are selected at the one-digit level of SITC product categories (ten product groups), listed in Table 18, and restricted to 14 East Asian countries i, including eight AFTA members (Brunei, Cambodia, Indonesia, Malaysia, Philippines, Singapore, Thailand, and Vietnam) and six other non-AFTA members, namely, Australia, China, India, Japan, Korea, and New Zealand. For a set of country j, this study uses data from all countries available in the UNCTAD dataset. It is noted that SITC product categories 0 through 4 are usually referred to as primary products, including partly used as raw materials for other industries; whereas SITC product categories 5 through 9 are referred to as secondary products, including manufacturing goods. GDP and GDPPC data are obtained from the World Bank’s World Development Indicators. All data are expressed in US dollars at constant 2005 prices. Data on the regional trade agreements are collected from the World Trade Organization (WTO) website9. The distance variables (geographical distance, physically contiguity, and language) are accessed through the CEPII research center10.
For model estimation, this study uses Cheng and Wall [15] augmented FE model estimator (Equations (3) and (4))11. The Baltagi and Wu [16] locally best invariant (LBI)

Table 1. The one-digit level of the SITC product categories.
test for first-order serial correlation was employed. The test rejected the null hypothesis of no first-order serial correlation. In addition, the White test for the presence of heteroskedasticity was performed, and also rejected the null hypothesis of homoskedasticity. Since evidence of both serial correlation and heteroskedasticity was found, the robust covariance matrix estimator is used throughout this study.
3. Estimation Results
3.1. The Impact of AFTA on East Asian Trade Flows
Table 2 reports estimation results from the gravity model of bilateral export flows using the unrestricted FE model estimator. The significant levels and signs of  and
and  coefficients vary depending upon SITC product category. The effects of AFTA membership on East Asian export flows are found to increase exports among AFTA members and to increase exports from AFTA members to non-AFTA members in five product categories: SITC 0, 3, 5, 6, and 8. These findings are likely the indication of trade creation effects, which are shown to not be restricted to only intra-bloc trade among members, but also expands to trade between members and non-members. On the other hand, the formation of AFTA reduces East Asian exports among members and from AFTA members to non-AFTA members in SITC 2, 4, and 7. The estimated coefficients of BothAFTA and
  variables are almost identical, suggesting that the effects of AFTA are mainly attributed by the effects of an export country i being an AFTA member.
There is possibly evidence of export diversion when an importing country j only is an AFTA member. Exports of three SITC product categories 1, 4, and 6 from non-AFTA members to AFTA members decrease by about 49 (SITC 6, manufactured foods) to 99 percent (SITC 4, animal and vegetable oils, fats, and waxes), when the other variables are held constant.12 For the other SITC product categories, the impacts are found to be insignificant.
For the impacts of AFTA on East Asian import flows, estimation results are reported in Table 3. The estimated coefficients of  and
and  variables are similar to those from the export models, as they have mixed effects on East Asian exports, subject to SITC product category. Likewise, this study observes the nearly identical estimated coefficients of the BothAFTA and One(i) AFTA variables, suggesting that the effects of AFTA membership are mainly a result of the importing country i being a member of AFTA. Nevertheless, the estimated signs and coefficients are subject to SITC product category. For imports of SITC product categories 0, 2, 5, and 9, AFTA members tend to import more of these products than the average East Asian importer. In contrast, AFTA membership may have negative effects on East Asian imports of SITC product categories 1, 3, and 7.
When estimation results from the gravity model of East Asian exports and of East Asian imports are compared, the effects of BothAFTA and  are substantially different. With few exceptions, AFTA is found to have a significant and positive impact on both East Asian exports and imports of food and live animals (SITC 0) and chemicals and related products (SITC 5), whereas it has negative impact on East Asian exports and imports of machinery and transport equipment (SITC 7). In general, the effects of AFTA on East Asian exports and on East Asian imports are not the same, and therefore cannot be treated the same.
This study finds a negative and significant coefficient of  for imports of beverages and tobacco (SITC 1) and crude material, inedible, except fuels (SITC 2). This may suggests that East Asian countries that are non-AFTA members may divert their imports of these particular products away from AFTA members. In contrast, non-AFTA members are found to import more secondary products such as miscellaneous manufactured articles (SITC 8) and commodities and transaction not classified elsewhere in the SITC (SITC 9) from AFTA members. This may reflect the trade creation effects of AFTA.
Since both positive and negative effects of AFTA on trade between members and non-members are found, the findings of this study somewhat contrast with those of Lee and Shin [11], who used aggregate bilateral trade data and found that East Asian trade agreements create more trade among members without diverting trade from non-members. The analysis based on sectoral trade data are shown to be dramatically different from those based on aggregate trade data.
3.2. How Well Does ASEAN-5 Integrate with Trade?
Although trade integration has been the main focus of regional integration since the first article of the General Agreement on Tariffs and Trade (GATT) formed in 1947, there is no consensus on how trade integration should be measured13. One of the most common measures of trade integration is the degree of openness, defined by the sum of exports and imports, divided by GDP. However, it has some drawbacks, as it disregards entirely the architecture of trade connections that a country has with its trading partners (Arribas, et al. [17]). Countries with different degrees of openness may be attributed to different economic characteristics. For instance, a country with a larger economy may have more domestic demands, and production may be therefore biased toward this demand. As a result, a country may export or import less than a country with a smaller economy. In addition, distances between countries may be an obstacle to trade. Two countries with a large distance between them have a tendency to trade less with each other, since trade costs will likely be large. Additionally, the degree of openness is too


Table 2. Gravity estimation results (dependent variable: ln(EXij), estimated by the FE model estimator).

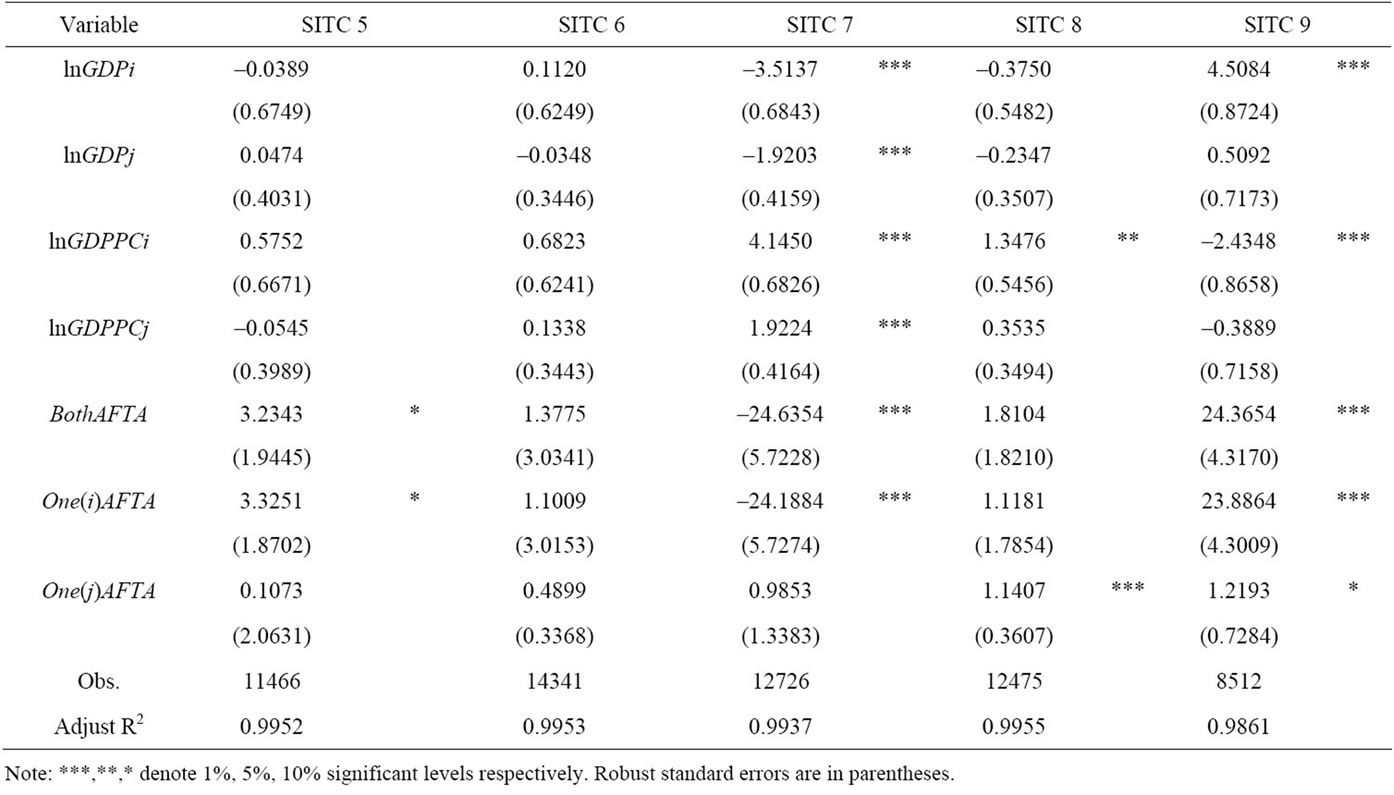
Table 3. Gravity estimation results (dependent variable: ln(IMij), estimated by the FE model estimator).
aggregate and prone to aggregation bias, as it lacks information of natural trade connections between economies, especially regarding sectoral trade.
Based on the ideas mentioned above, this study proposes to use the simple ratio of the sum of actual values divided by the sum of predicted values of ASEAN-5 trade with all of its trading partners obtained from the gravity model (derived in the previous section) as a measurement of trade integration at the commodity level. The ratio can be written as:
 (5)
(5)
where J is the set of ASEAN-5 trading partners, in which two sets of trading countries are considered. One is the set of ASEAN-5 itself, and the other is the set of the other six East Asian countries (Australia, China, India, Japan, Korea, and New Zealand).
This measurement is built on the notion of natural trading partners, taking into account those domestic biases and those different characteristics of trading countries, as they are controlled in the gravity model. In addition, it provides superior information of trade connections at the commodity level. The low ratio value (i.e., less than 100 percent) indicates that actual trade flows of a commodity c are less than its predicted level. This implies a low degree of trade integration. In contrast, if the ratio value is close to or greater than 100 percent, it indicates a high degree of trade integration for that a particular commodity.
Figures 1 and 2 present the ratio of ASEAN-5’s actual trade to predicted trade among members and trade with the other six East Asian countries. The figures indicate that the differences between actual and predicted trade have been clearly reduced over the period from 1996 to 2005. For ASEAN-5’s intra-regional trade, the ratio ranged in percent from 73 (SITC 9) to 116 (SITC 4) in 2005. SITC product categories 0, 7, 8, and 9 are found to integrate poorly with intra-regional trade, since actual trade is far below predicted trade by more than 10 percent. Hence, the findings suggest that, if ASEAN-5 countries aim to fully integrate with trade, they should find a way to expand their intra-regional trade in those four SITC product categories.
When the findings of ASEAN-5 trade with the six East Asian countries are compared with those of ASEAN-5 intra-regional trade, the two findings are slightly different. Nonetheless, there are three SITC product categories that indicate low ratio values of actual to predicted trade in both sets of ASEAN-5 trading partners. They are SITC product categories 0 (food and live animals), 7 (machinery and transport equipment), and 8 (miscellaneous manufactured articles). These product categories should be the area of focus for policymakers on improving the trade integration regime in East Asia.
3.3. ASEAN-5 Intra-Industry Trade
This study uses a variant of the Grubel and Lloyd [19] intra-industry trade (IIT) index to measure the overall intensity of ASEAN-5 intra-industry trade for a commodity c (based on the one-digit level of SITC disaggregation) with the set of its trading partners, J, and can be written as
 (6)
(6)
This IIT measure ranges from zero to one. If all trade for a commodity c is intra-industry trade so that the sum of ASEAN-5 exports and imports from all countries in set J are equal, 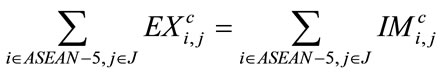 then
then . In contrast, if all trade is inter-industry trade, either
  or
or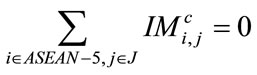 , then
 .
.
While the IIT index has been widely used in the literature, it may undermine true natural intra-industry trade connections if actual trade happens to be higher or lower than predicted trade level. Hence, this study calculates and compares the IIT index using both actual trade and predicted trade values for all ten SITC product categories. The IIT indices by SITC product category for ASEAN-5 intra-regional trade and for trade between ASEAN-5 and the six East Asian countries are displayed in Tables 4 and 5.
When the IIT indices based on actual trade data are compared with those based on predicted trade data, they are quite similar. The one exception is that, in the SITC 4 category (animal and vegetable oils, fats and waxes), the average of actual IIT indexes during the ten year periods from 1996 to 2005 is higher than the average of predicted IIT levels by more than 10 percent. Hence, the calculation of the IIT index based on actual trade data may lead to possible bias estimation.
On average, ASEAN-5 countries are found to be involved in intra-industry trade more within the region than with the six East Asian countries, except in SITC product categories 5, 8, and 9. These findings are, in general, consistent with those of Sawyer, et al. [6] who finds that AFTA members exhibit significantly higher levels of IIT among AFTA members and the effects of AFTA are found to promote IIT across all SITC product categories. However, there are products that indicate a low intensity of ASEAN-5 intra-industry trade (beltow the 50 percent level). The corresponding products are in SITC product category 4 (animal and vegetable oils, fats and waxes), in which the average predicted IIT index is at the 41 percent level.
For ASEAN-5 trade with the six non-AFTA East Asian countries, the lists of products having low intensity of intra-industry trade are expanded to include those in SITC product category 3 (mineral fuels, lubricants and related materials). It is worth noting that the predicted IIT indices in SITC product categories 3 and 4 are extremely low, at 32 and 9 percent levels, respectively.
4. Concluding Remarks
This study applies a gravity model of bilateral trade
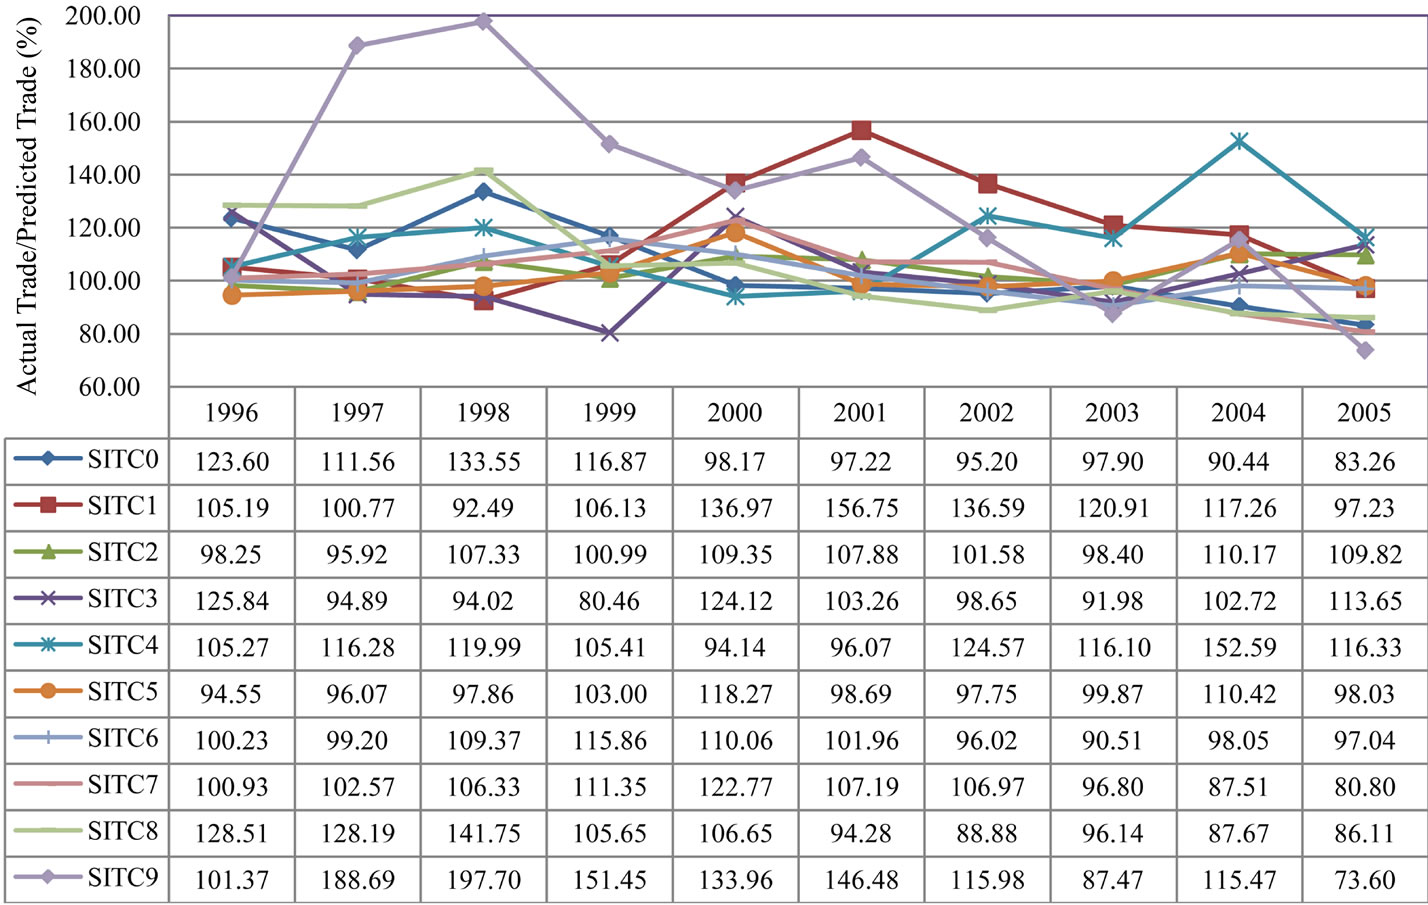
Figure 1. ASEAN-5 intra-regional trade integration.

Figure 2. ASEAN-5 trade integration with the six East Asian countries.

Table 4. Intra-industry trade (IIT) indices for ASEAN-5 intra-regional trade.

Table 5. Intra-industry trade (IIT) indices for ASEAN-5 trade with the six non-AFTA East Asian countries.
flows at the one-digit level of SITC product categories to assess East Asian regional trade integration in several aspects. First, the effects of AFTA formation on East Asian sectoral exports and on East Asian sectoral imports are shown to be quite different. In addition, both positive and negative effects of AFTA formation are found on sectoral trade among members and on trade between members and the rest of the world, subjected to SITC product category.
Next, the degree of East Asian trade integration at the commodity level is analyzed by comparing actual to predicted trade levels. The findings indicate that the differences between actual and predicted levels of trade have been clearly reduced. Nonetheless, there are three SITC product categories in which actual trade is below predicted trade by at least 10 percent, which may indicate a low degree of trade integration. Those three product categories include food and live animals, machinery and transport equipment, and miscellaneous manufactured articles. Therefore, these product categories should be a major concern for policymakers seeking to enhance trade integration regimes in East Asia.
Finally, the calculation of the IIT index based on actual trade data may undermine the true natural intra-industry trade connections. The IIT index is suggested to be based on predicted trade data obtained from the gravity model. The findings based on the predicted trade data confirm that ASEAN-5 involves in intra-industry trade among its members more than trade with other East Asian countries, as indicated by the high degree of ASEAN-5 intra-industry trade intensity in most SITC product categories.
5. Acknowledgements
Helpful research assistance from Siam Sakaew is gratefully acknowledged.
REFERENCES
- M. Mikic, “ASEAN and Trade Integration,” ESCAP Trade and Investment Division, Staff Working Paper 01/09,” United Nations, Bangkok, 2009.
- R. Pomfret, “Sequencing Trade and Monetary Integration: Issues and Application to ASIA,” Journal of Asian Economics, Vol. 16, No. 1, 2005, pp. 105-204. doi:10.1016/j.asieco.2004.12.002
- D. Derosa, “US Free Trade Agreement with ASEAN,” In: J. J. Schott, Ed., Free Trade Agreements US Strategies and Priorities, Institute for International Economics, Washington DC, 2004, pp. 117-171.
- S. Sudsawasd and P. Mongsawad, “Go with the Gang ASEAN,” ASEAN Economic Bulletin, Vol. 24, No. 3, 2007, pp. 339-353. doi:10.1355/AE24-3D
- C. Filippini and V. Molini, “The Determinants of East Asian Trade Flows: A Gravity Equation Approach,” Journal of Asian Economics, Vol. 14, No. 5, 2003, pp. 695-711. doi:10.1016/j.asieco.2003.10.001
- W. C. Sawyer, R. L. Sprinkle and K. Tochkov, “Patterns and Determinants of Intra-Industry Trade in Asia,” Journal of Asian Economics, Vol. 21, No. 5, 2010, pp. 485-493. doi:10.1016/j.asieco.2010.04.001
- J. E. Anderson, “A Theoretical Foundation for the Gravity Equation,” American Economic Review, Vol. 63, No. 1, 1979, pp. 106-116.
- J. H. Bergstrand, “The Gravity Equation in International Trade: Some Micro-Economics Foundations and Empirical Evidence,” Review of Economic and Statistic, Vol. 67, No. 3, 1985, pp. 474-481. doi:10.2307/1925976
- M. E. Kreinin and M. G. Plummer, “Effects of Regional Integration of FDI: An Empirical Approach,” Journal of Asian Economics, Vol. 19, No. 5-6, 2008, pp. 447-454. doi:10.1016/j.asieco.2008.09.005
- A. K. Rose, “Do We Really Know That the WTO Increases Trade?” American Economic Review, Vol. 94, No. 1, 2004, pp. 98-114. doi:10.1257/000282804322970724
- J.-W. Lee and K. Shin, “Does Regionalism Lead to More Global Trade Integration in East Asia?” North American Journal of Economics and Finance, Vol. 17, No. 3, 2006, pp. 283-301. doi:10.1016/j.najef.2006.06.007
- B. H. Baltagi, P. Egger and M. Pfaffermayr, “A Generalized Design for Bilateral Trade Flow Models,” Economic Letters, Vol. 80, No. 3, 2003, pp. 391-397. doi:10.1016/S0165-1765(03)00115-0
- J. A. Hausman, “Specification Tests in Econometrics,” Econometrica, Vol. 46, No. 6, 1978, pp. 1251-1271. doi:10.2307/1913827
- S.-J. Wei and J. A. Frankel, “Open versus Closed Trading Blocs,” In: T. Ito and A. O. Krueger, Eds., Regionalism versus Multilateral Trade Agreements, University of Chicago Press, Chicago, 1997, pp. 119-140.
- I.-H. Cheng and H. J. Wall, “Controlling for Heterogeneity in Gravity Models of Trade and Integration,” Federal Reserve Bank of St. Louis Review, Vol. 87, No. 1, 2005, pp. 49-63.
- B. H. Baltagi and P. X. Wu, “Unequally Spaced Panel Data Regressions with AR (1) Disturbances,” Econometric Theory, Vol. 15, No. 6, 1999, pp. 814-823. doi:10.1017/S0266466699156020
- I. Arribas, F. Pérez and E. Tortosa-Ausina, “Measuring Globalization of International Trade: Theory and Evidence,” World Development, Vol. 37, No. 1, 2009, pp. 127-145. doi:10.1016/j.worlddev.2008.03.009
- OECD, “Shaping Policy Reform and Peer Review in Southeast Asia,” OECD, Paris, 2008.
- H. G. Grubel and P. J. Lloyd, “Intra-Industry Trade: The Theory and Measurement of International Trade in Differentiated Products,” Macmillan, London, 1975.
NOTES
1The six member countries are Brunei, Indonesia, Malaysia, Philippines, Singapore, and Thailand.
2For a recent review of the progress in ASEAN regional cooperation, see Mikic [1].
3For economic theories underling the gravity model, see Anderson [7], Bergstrand [8], etc.
4Trade diversion effects are usually defined when the estimated coefficient of α10 or α11 is significant and negative.
5The Hausman [13] specification test was performed to examine the null hypothesis of no correlation between the random effects and the regressors. The Hausman test rejected this null hypothesis and suggested the use of the fixed-effect model estimator in this study.
6For the unrestricted FE model specification, a country-pair effect is allowed to be different for each direction of trade, .
.
7In the second step, the estimated country-pair dummy variable from the first step is regressed on the time invariant variables: distance, contiguity, and language variables.
 . where ^ denotes predicted values.
8For a more detailed structure of SITC product categories, see http://unstats.un.org
9The data on ASEAN trade agreements were retrieved in May, 2009.
10The data are available at http://www.cepii.fr/anglaisgraph/bdd/distances.htm
11Although the model estimations based on the pooled OLS estimator are not reported in the paper, they are available upon request.
12This is calculated by e–0.6810 – 1= –0.49 and e-4.4873 – 1= –0.99.
13As cited in Mikic [1], OECD [18] discusses how the choice of measurements depends on the purpose and area of integration, but often on data availability.