Wireless Engineering and Technology
Vol.3 No.3(2012), Article ID:21471,7 pages DOI:10.4236/wet.2012.33023
Research of Intelligent Transportation System Based on the Internet of Things Frame
![]()
Department of Electronic Information and Control Engineering, Beijing University of Technology, Beijing, China.
Email: wyq_27@yahoo.com.cn, qihui@bjut.edu.cn
Received March 31st, 2012; revised April 28th, 2012; accepted May 16th, 2012
Keywords: The Internet of Thing; Intelligent Transportation System; Data Visible
ABSTRACT
According to city public transit problem characteristic, the main body of a paper has been submitted and has worked out one kind of based on the Internet of things frame Intelligent transportation system. That system collects data by vehicle terminal and uploads data to the server through the network and makes data visible to the consumer passing an algorithm in the server. One aspect, the consumer may inquire about public transit vehicle information by Web. On another aspect, the consumer can know public transit vehicle information by station terminal. The experiments have tested that the Intelligent transportation system can offer public transit vehicle information to many consumers with convenient way thereby this system can solve the city mass transit problem.
1. Introduction
1.1. Backgrounds
With the development of our country’s national economy, the course of urbanization being accelerated, the prompt increase of vehicle, communications construction are insufficient in the city, urban traffic imbalance between supply and demand is gradually strained. City traffic problem has already become a nowadays first problem facing. In order to resolve this problem, the government should firstly improve business efficiency and the Intelligent transportation system quality.
Intelligent traffic study is one way to solve the problem of city traffic. Advanced city mass transit system can help urban resident to gain dynamic data and static state traffic information effectively. Mass transit has much merit such as large carrying capacity, high delivery efficiency, low energy consumption and low transportation costs. Therefore it is a very important function to make the city informatization.
Information technology develops fastly on the nowadays, a new concept comes out and develops—the Internet of things. In the past decade, there were various techniques and algorithms developed the Intelligent Traffic System by using AVL and APC data [1]. These methods can be categorized as: artificial neural network (ANN) or support vector machine (SVM), Non-parametric regression model (NPR) and Kalman filter model [2]. SVM is the most specific type of learning algorithm to use the Intelligent Traffic System now, because the accuracy of this algorithm is better than others. However, many researchers can not realize the algorithms on the Intelligent Traffic System based on the Internet of things.
In the future, the Internet of things will be more popular on the intelligent transportation system. The Internet of things has provided a very fine platform for intelligent traffic studies, it exchanges public transit vehicle information by the network and without people’s disturbance, thereby the information of the public transit vehicle become especially intelligence.
1.2. Contributions
Nowadays, people like researching information on the internet. In order to help people to know more information about the transportation, we have structured based on the Internet of things frame intelligent transportation system. This system can transfer current public transit vehicle location information to the server by computer internet. Vehicle location information can be demonstrated on Web by a kind of algorithm, at the same time the server calculates the arriving information and send it to station terminal through internet. Residents can know public transit vehicle information in two ways: people can inquire about public transit vehicle information on the internet, people also can see arriving information in station during peak periods. Once people know more information about the vehicle location, they can choose more ways to achieve the destination. This scheme has provided the new train of thought to resolve problem of city mass transit effectively.
2. System Frames and System Patterns
2.1. System Frames
As is shown in Figure 1. Based on the Internet of things frame intelligent transportation system is composed of four major parts: The network server, database module, data transmission module, moving terminal [1].
The network server part faces to customer group, this part is used for collecting new data and shows out in the website form [3].
The database module is used for classifying and saving the different information in the database. The database module can build a firm and safe bridge between server and vehicle terminal [4].
On one hand, the data transmission module can be used for sending new information to database which the new information come from vehicle terminal, on another aspect the data transmission module can pick up some data from the database to send them to station terminal which can show these data to people.
The moving terminal part includes the embedded device centering on PXA310, the GPRS module and the GPS module. The embedded device is used for collecting public transit vehicle information mainly and send the data to database by the GPRS module and the GPS module; And, the real time field, connecting the database and extract some data from database by the network. So the moving terminal includes two parts—the vehicle terminal and the station terminal GPRS module effect is connecting a server mainly, uploads the data in the database for waiting for call or abstract data from the database provide to the moving terminal. GPS module collects present data such as longitude, latitude, time and speed. As is shown in Figure 1, PXA310 embedded device in the moving terminal play an administration information and sequence managing role. In order to decrease the costing and development’s time, the sever mainly manages and calculate the information.
2.2. System Pattern
According to reality working process of the intelligent transportation system system, the system frame which shows in the Figure 1 divides several the following stages:
Firstly, the GPRS module and the GPS module is initialized by the vehicle terminal. The GPS module collects some data such as longitude and latitude, time, speed and then the information is saved into the vehicle terminal’s data storage waiting for GPRS module uploading them to the database.
Secondly, the GPRS module dispatches AT order and connects with the data transmission module fixing IP address. After building TCP passage, the data transmission module sends data to the database waiting for the next ordering.
Thirdly, the Web page display module abstracts the data information from the database, and then the Java Script module calculates and exploits these data. The customer exposition part shows these data to customers by transferring Java Script module [5]. The customer exposition part can make customers clearly search the information which they want to know.
At the same time the Web page display module sends data (public transit vehicle and platform distance data) which is calculated to the database waiting for the platform terminal using. The platform terminal links up again by TCP, abstracts and demonstrates the data from the database [6].
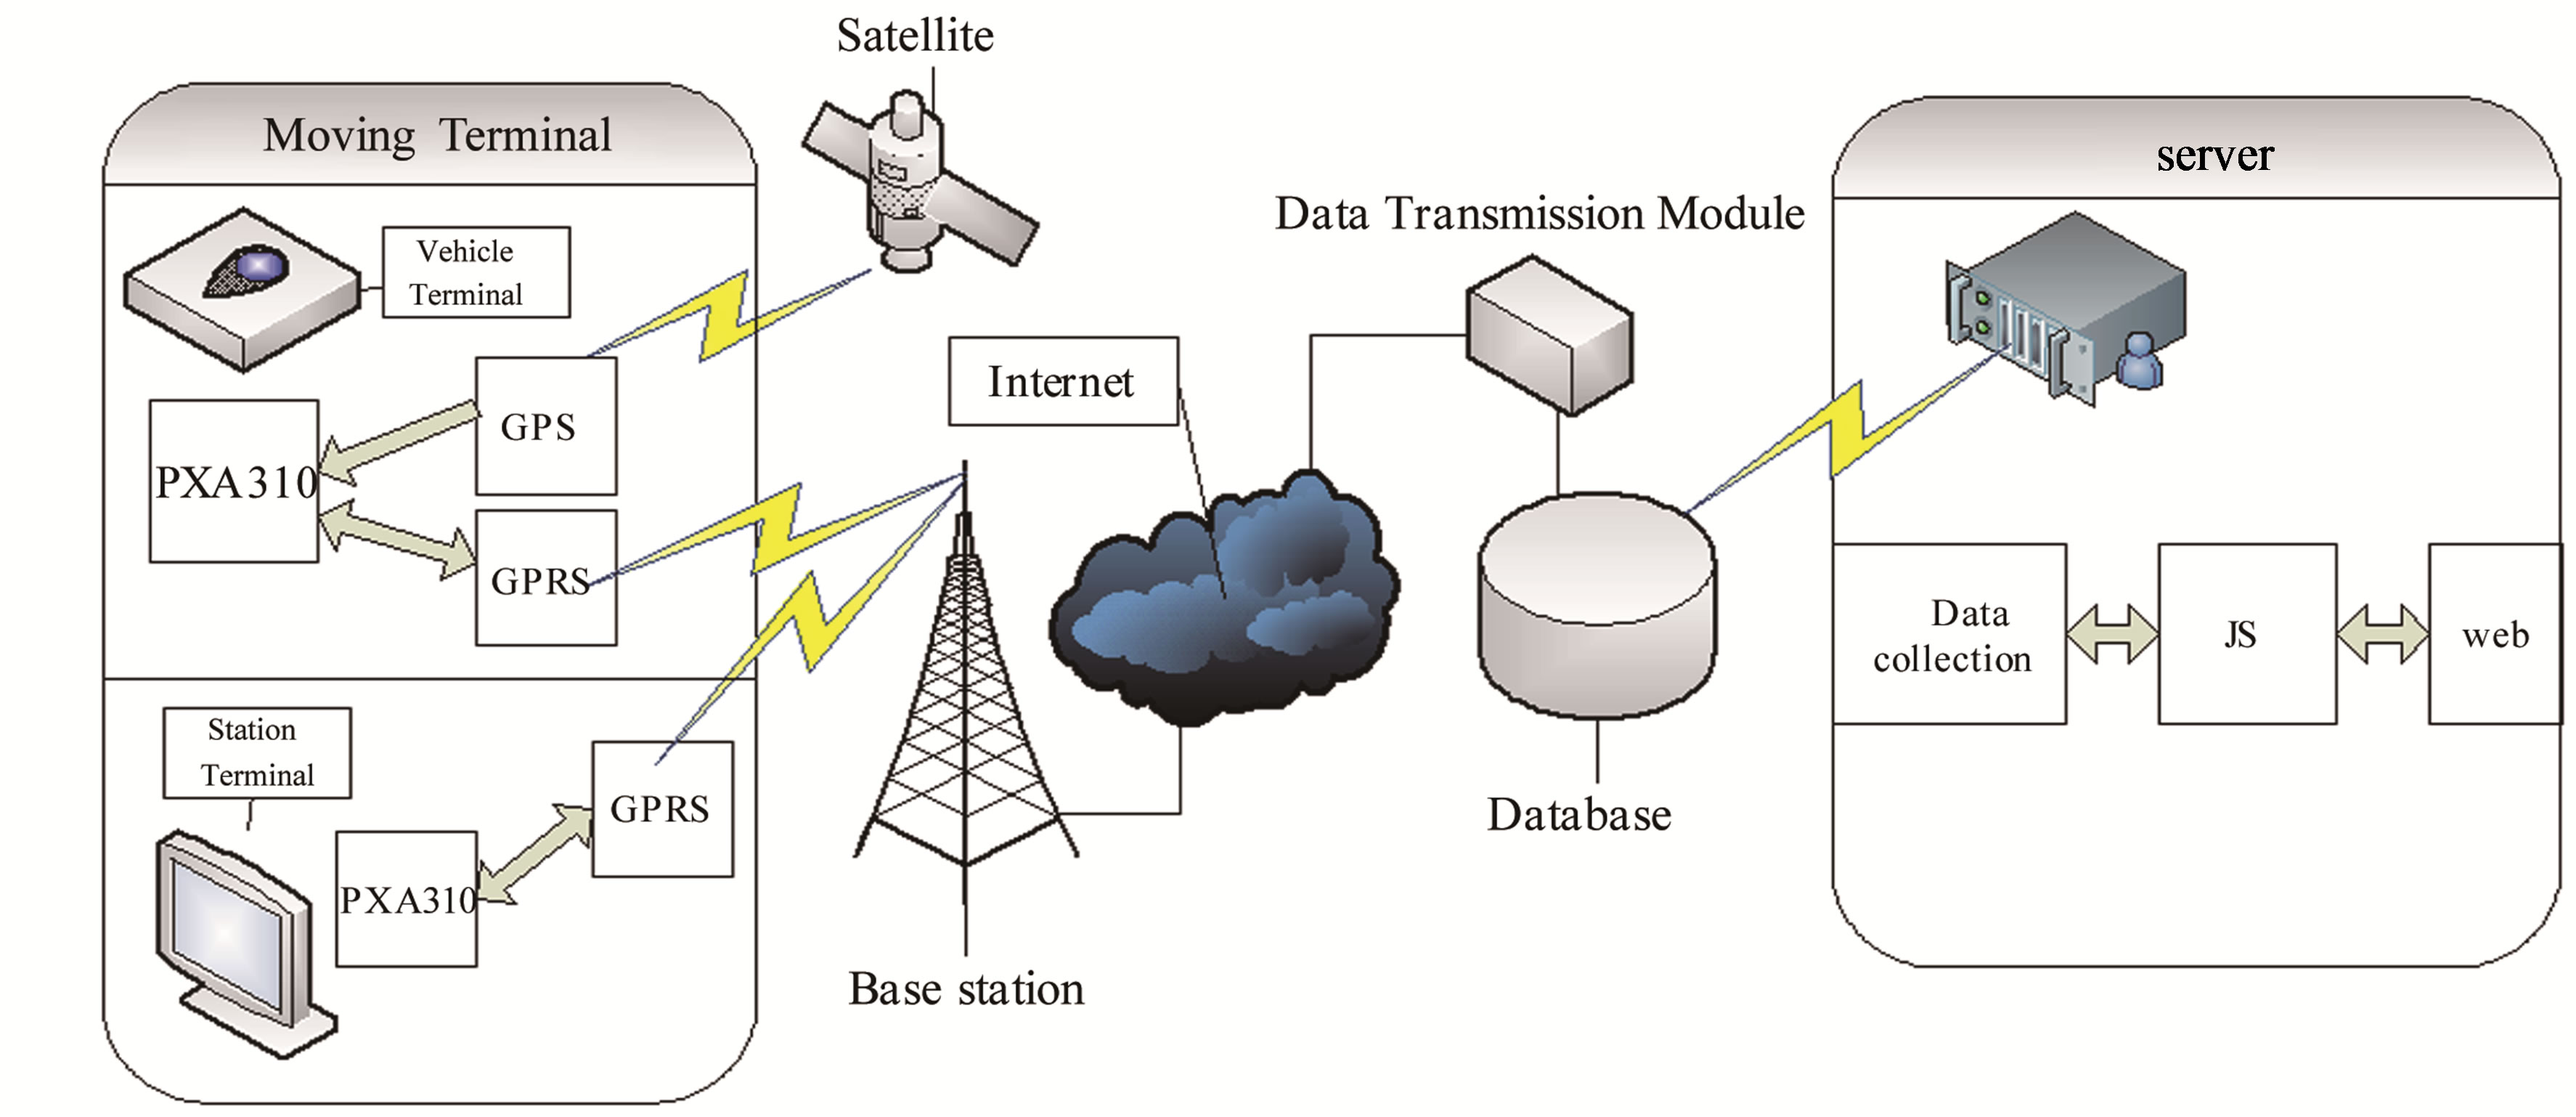
Figure 1. General system frame.
3. Public Transit System Software Platform Ingredient
As is shown in Figure 2 public transit software frame.
3.1. Vehicle Terminal
There are five parts in the vehicle terminal: terminal serial communication part, GPRS network link part, GPS data collect and data draw part, GPS information dispatch part. Technological process includes following steps:
At first the terminal serial communication part opens and deploys GPS and GPRS module to realize follow-up information collecting and transferring job. In order to build network data transmission passage, the vehicle terminal dispatches AT order to connect the GPRS network by SIM card and the GPRS module. And then the GPS module collects data (longitude and latitude information, current speed, UTC time) extract effective data and saves them in the vehicle terminal. Finally, the GPS information is sent to the server through the GPRS network waiting for the next calculating treatment and reliable memory.
The public transit system platform vehicle terminal adopts the multi-thread pattern to manage data for ensuring real time transmission information. Namely vehicle terminal collects current longitude, latitude, speed and UTC time information by the GPS module, at the same time the GPRS module uploads these pertinent information. For achieving public transit system platform real time display vehicle information’s purpose, vehicle terminal have adopt the multi-thread treatment data pattern with the Linux system. The GPRS is not able to occupy the resource while GPS collects information, at the same time the GPS module is not able to occupy the resource while GPRS uploads a data. The multi-thread treatment data pattern makes this two modules simultaneous work, mutually independent. These two modules do not affect mutually. Thereby this kind of manage pattern is satisfied with the demand of public transit system platform to data information real time nature. As is shown in Figure 3
Technological process.
3.2. Data Transmission Module
The data transmission module includes the tripartite function mainly: Building connection element; Receive data and upload element; Dispatching terminal data element [7].
Building connection element is to build a TCP connection passage, and then to monitor whether having equipment to link up or not. If there is some equipment to request linking up, the data transmission module builds a passage. If not, it will wait all time.
After the data transmission module connects to vehicle terminal device, the receive and upload data element mainly receive data (longitude, latitude, UTC time and speed) and upload them to database [8].
Dispatching terminal data element is responsible for abstracting the data from the database and sending to the terminal after the data transmission module connects to station terminal device.
3.3. Databases Module
At present, the database module mainly has three son database: public transit vehicle longitude and latitude information son database, station longitude and latitude information son database and vehicle and station plate distance son database.
As is shown in Figure 4, the station longitude and latitude information database stores concrete public transit station information which includes the station name, station location, station number and vehicle direction. The Web page display module is responsible for processing these data.
The public transit vehicle longitude and latitude information database stores the public transit vehicle longitude and latitude data which come from vehicle terminal module and Web page display module processes these data later. There is everyday correction longitude
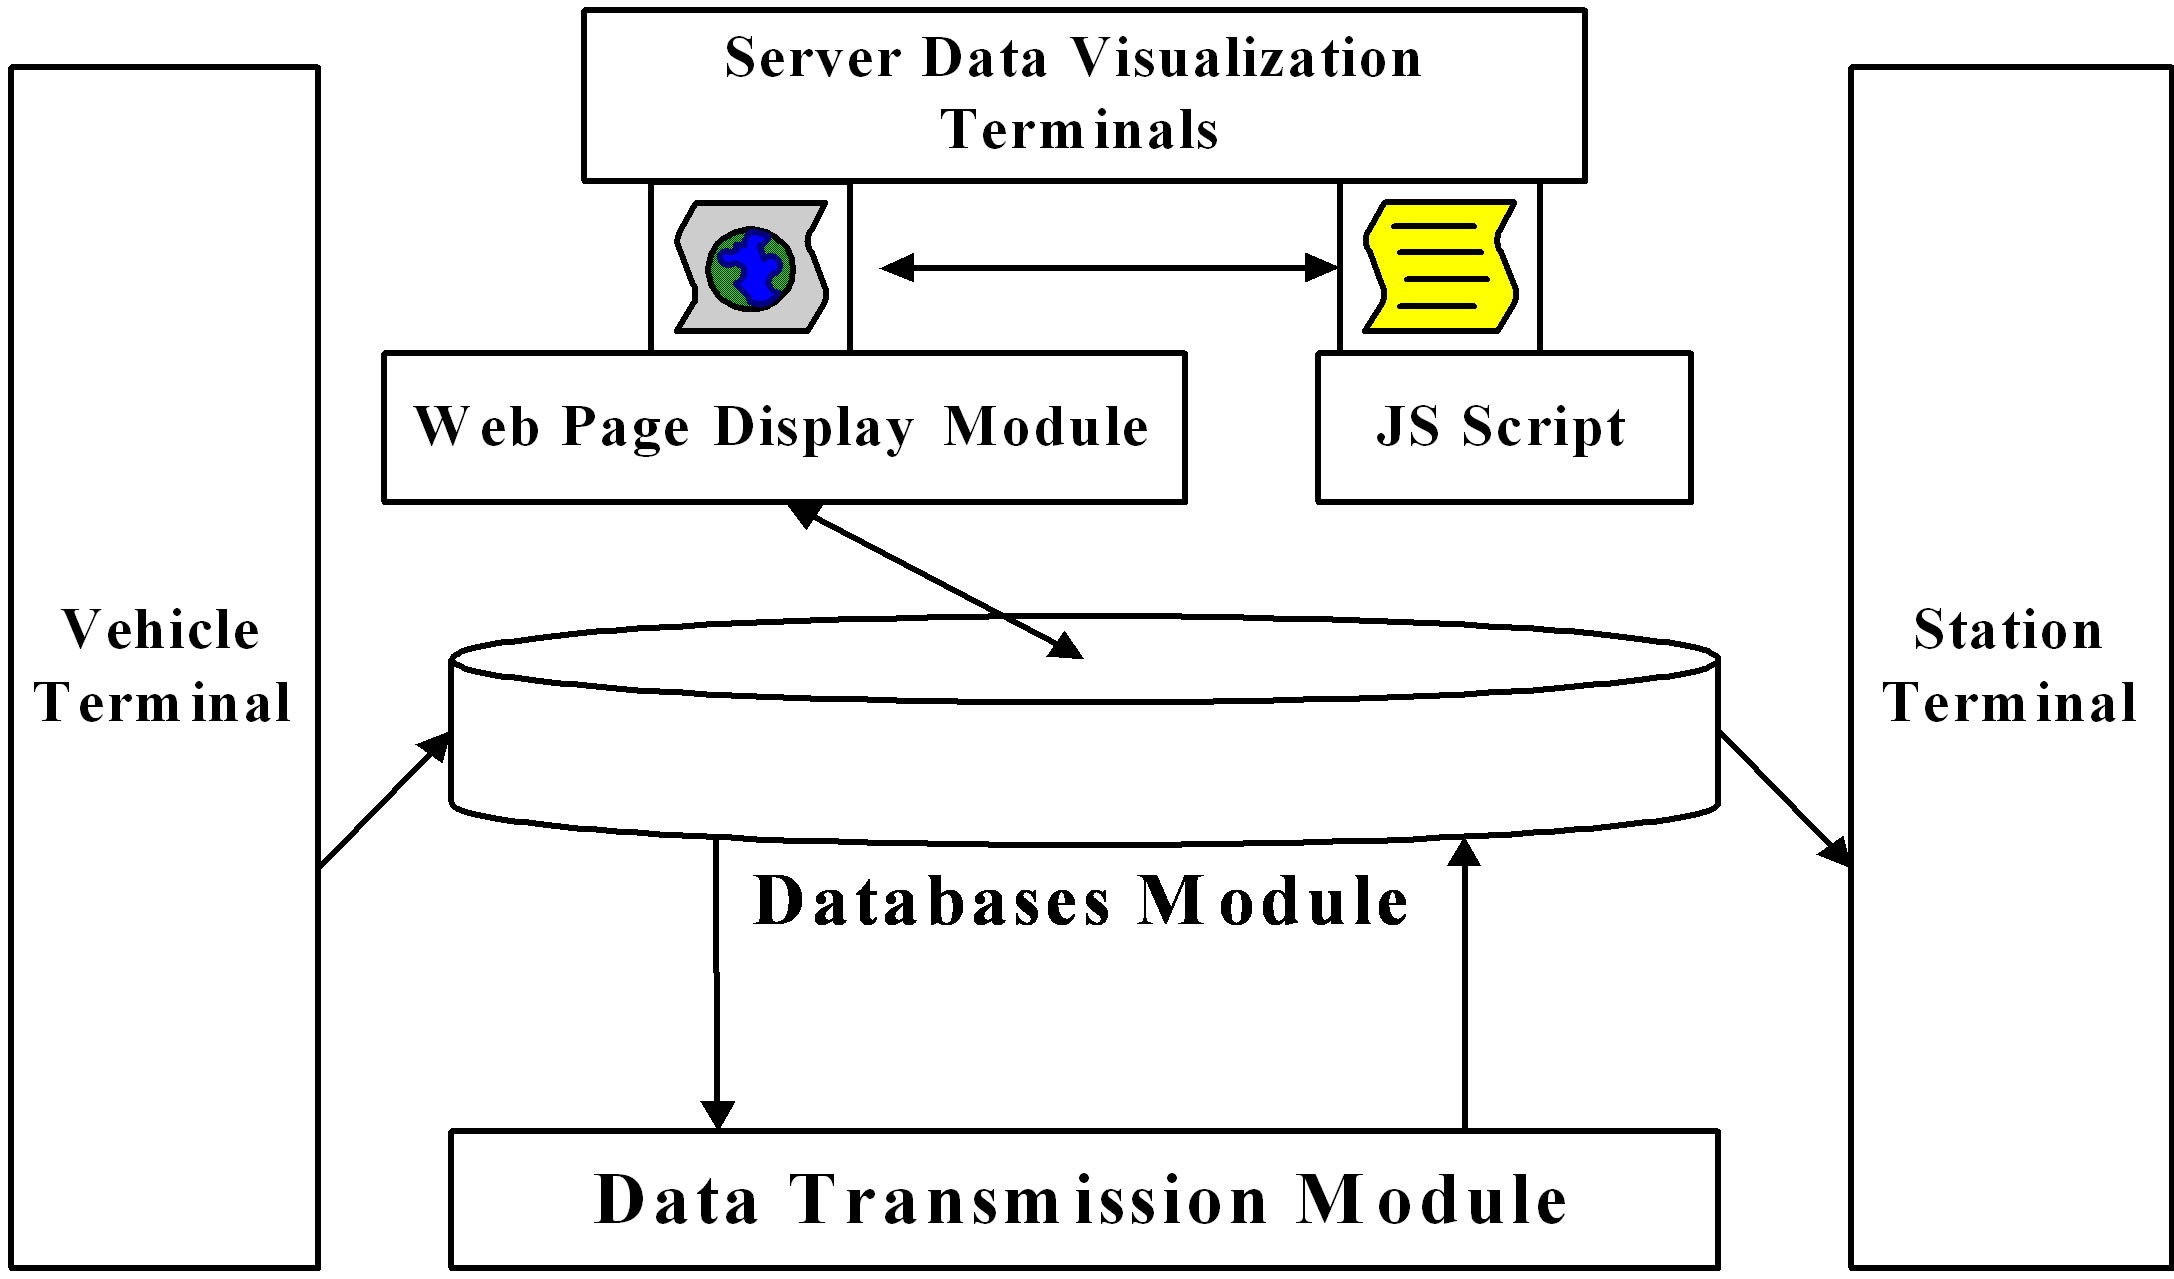
Figure 2. Software frames.

Figure 3. Technological process.
and latitude data which prevent web page from calculateing the correction longitude and latitude data when people open Web page every time in this database.
The vehicle and station plate distance database are to store the vehicle and nearest station data which is calculated out by the Web page display module.
In the process of above-mentioned database designeralization, we have considered the security of the public transit system platform database. One aspect is the security of the customer control. In entire systematic background, there is no one who can have the power to revise, insertion and delete any data unless system develop platform personnel permit in the database. On the other aspect, the public transit system platform database ensure the security storing information. According to different category, information is stored respectively in different database in this system and every database all owns self password. Each datum does not affect mutually and each of data is independent. So the public transit system platform stability is improved greatly. When a database data has been breakdown and the password disclosing, completeness and security of other several data can not be affected.
3.4. Server Data Visualization Terminals Design
The server data visualization terminal includes two parts: Web page display module and data collection transfer module. As is shown in Figure 5. And the Figure 6 is the JS software flow chart.
The Web page display module includes customer data display Web page and JS script. The customer data display Web page is used to demonstrate relevance information (bus geographical position, bus station geographical position, and distance between bus and nearest bus station). JS script’s effect is to connect customer data display Web page with Google Maps’ API interface and make some feasible data becoming more nimble.
The data collection transfer is responsible for connecting database module with customer data display Web page and transferring public transit vehicle longitude and latitude information, public transit circuit information and station information, uploading public transit vehicle and the station distance information etc. [9]. During the transfer process, JS script calculates and processes these data and then upload results to the customer data display Web page to show [10].
3.5. Station Terminals
The station terminal mainly includes: the station data receiver part and the data display part.
The station data receiver part extracts relevant data from database, such as distance between bus and nearest bus station information, the bus arrives in station time information and current bus speed etc.; and the data display part realizes information visualization.
4. Intelligent Transportation System Platform Functions Study
4.1. Visualization and Accuracy of Public Transit System
The visualization and accuracy of public transit system embodies in customer data display Web page part. The public transit system adopts two kinds of schemes for this

Figure 4. Database module.
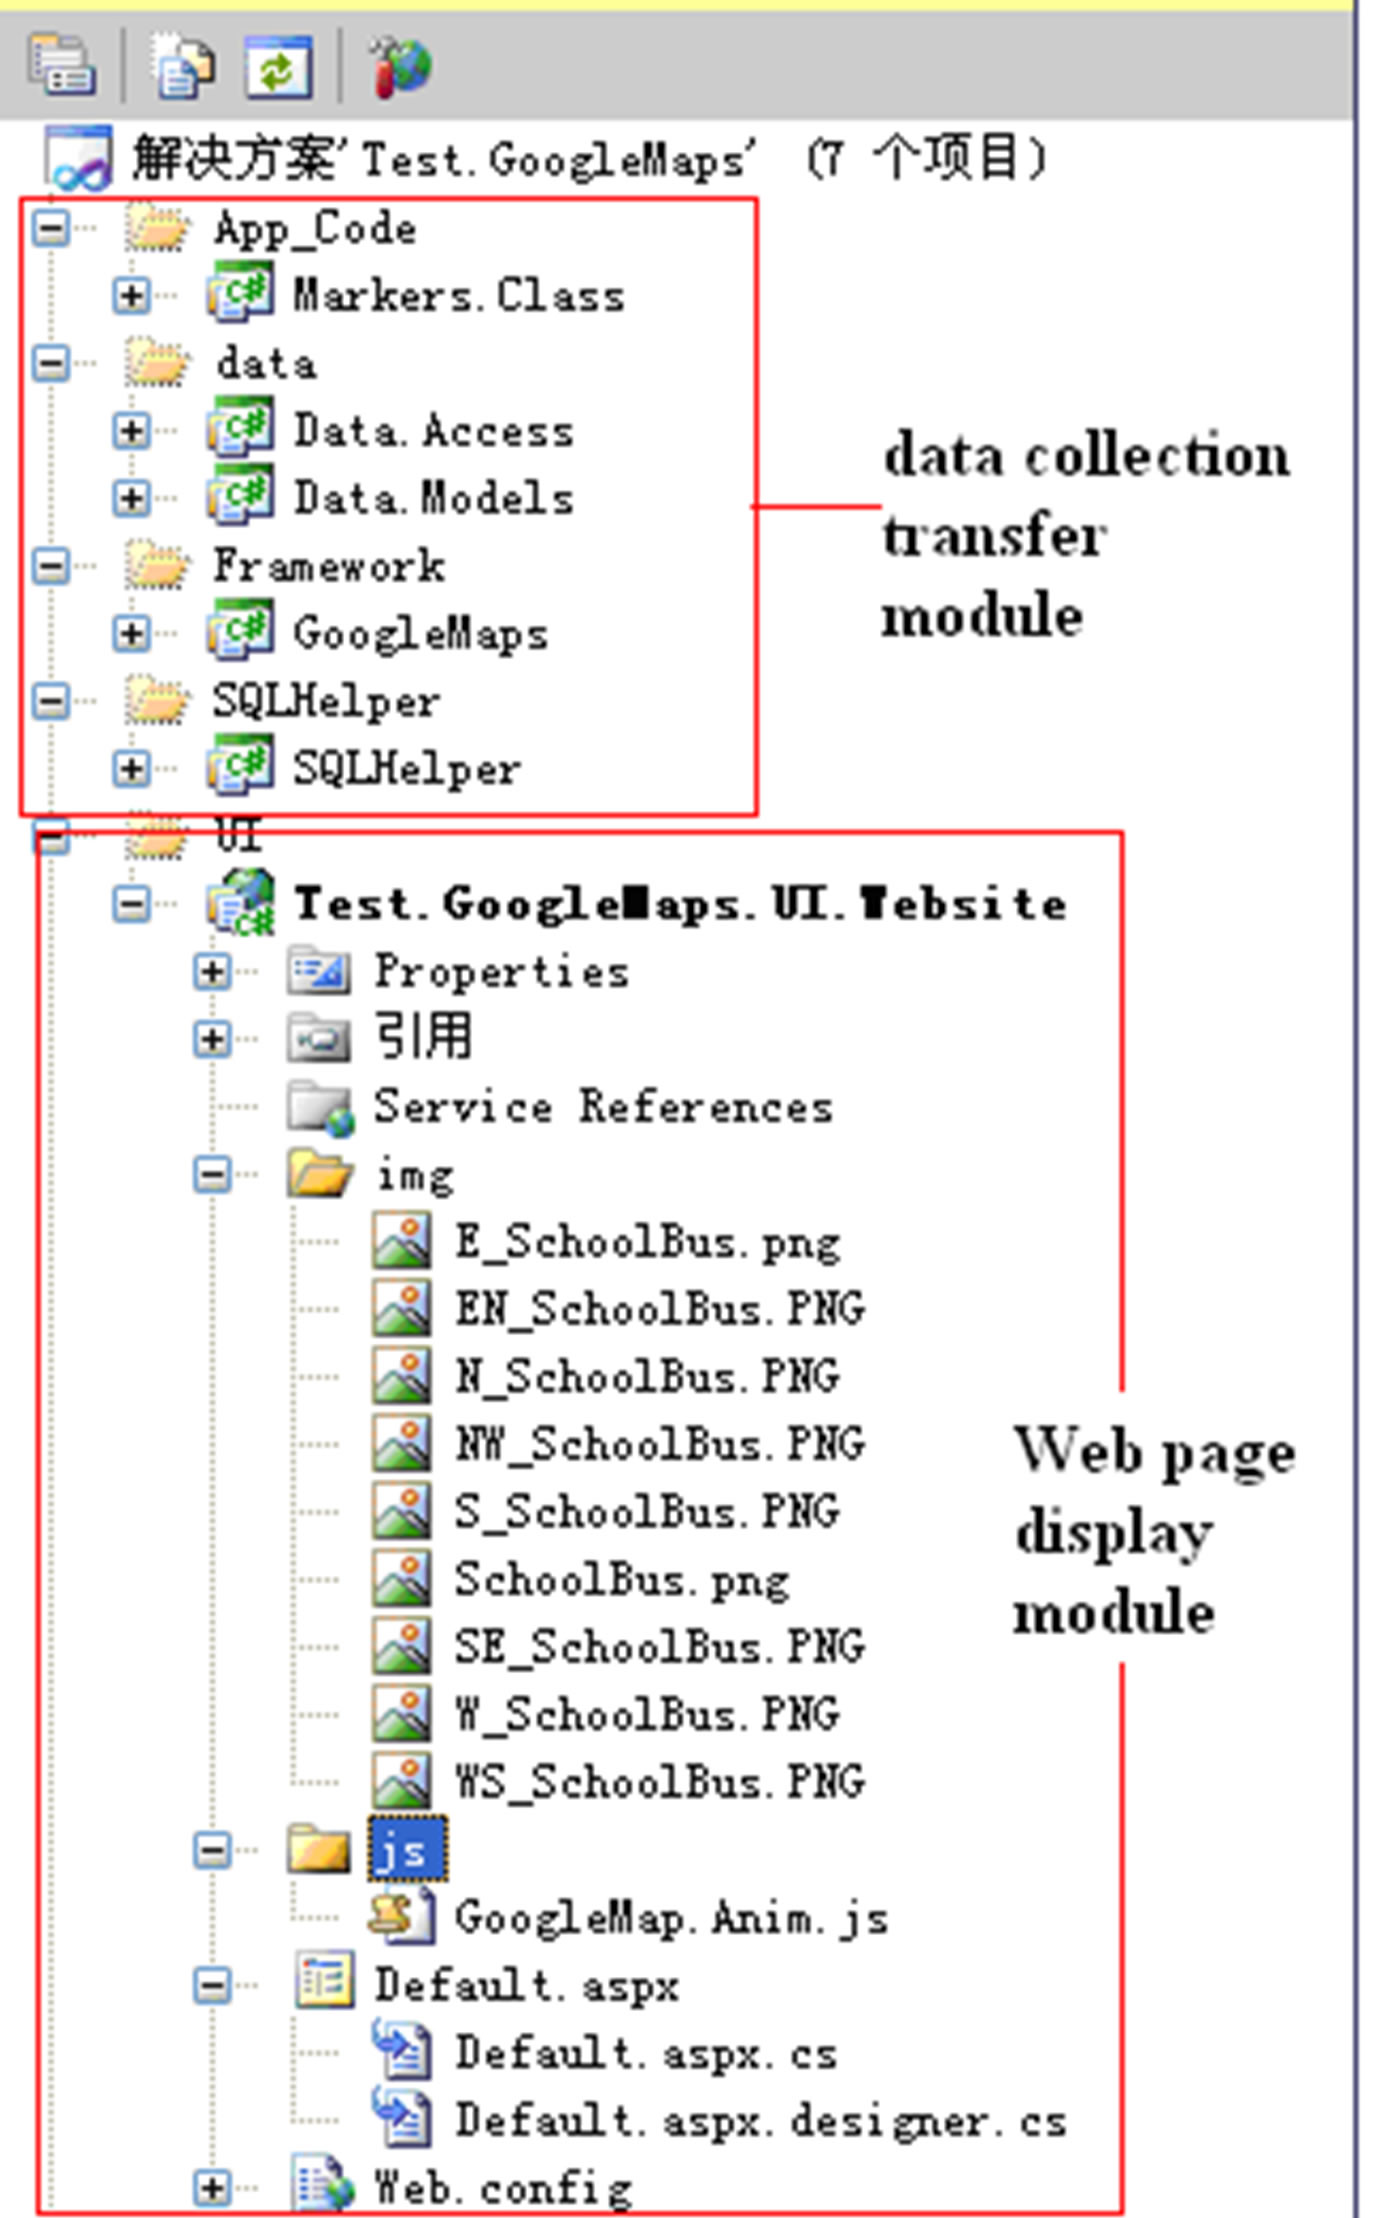
Figure 5. Server data visualization terminals design.
purpose: accuracy correction and visualization correction.
As is shown in Figure 7, before the bus bears off the station 0th, the arithmetic need to match the bus current longitude and latitude coordinate with the station 0th (bjut0) longitude and latitude coordinate. Because actual longitude and latitude coordinate is different from longitude and latitude coordinate of Google Maps labeling and the GPS module acquisition data has some certain inaccuracy. The arithmetic must correct the bus current longitude and latitude coordinate to close to the station 0th (bjut0) longitude and latitude coordinating and uploading the departure to corresponding database. In order to correct bus current longitude and latitude coordinate and realize that bus demonstrates on the map every time, the arithmetic blend bus’s information with the departure after system extracts current bus longitude and latitude data every time. Many times experiment data analysis indicates the above-mentioned coordinate departure happening change only in one day, so the arithmetic can concentrate initialize system. Figure 7 is the picture without algorithm processing. The bus obviously appears in deflecting the rough 10 meters place of station 0th (bjut0) in

Figure 6. JS software flow chart.
the picture. Figure 8 is the picture with algorithm correction of deviation. The bus appears in station 0th (bjut0) and there is correction numerical value in the map below. Observing the effect correcting the front and back can explain that the correcting algorithm is successful which make bus appearing on accurate field in reality [11].
In the process of system operation, GPS module drift will be able to lead to bus being away from actual vehicle orbit, will is more obvious especially during bus cornering. This phenomenon has greatly affected public transit system platform’s visualization.
The visibility correction algorithm can be adopted specifically for four kinds of driving and four corners.
The four kinds of driving are: driving from west to east, driving from east to west, driving from north to south, driving from south to north. Four kinds of curved condition are respectively: cornering from west to east, cornering from east to west, cornering from north to south, cornering from south to north. Bus makes judgment according to different driving situation to keep running on the road all the time. Bus also makes judgment according to different cornering situation. When bus drives into the range of cornering (the inflection point as the center and radius of the circular area of 5 meters), the

Figure 7. Not corrected effect.
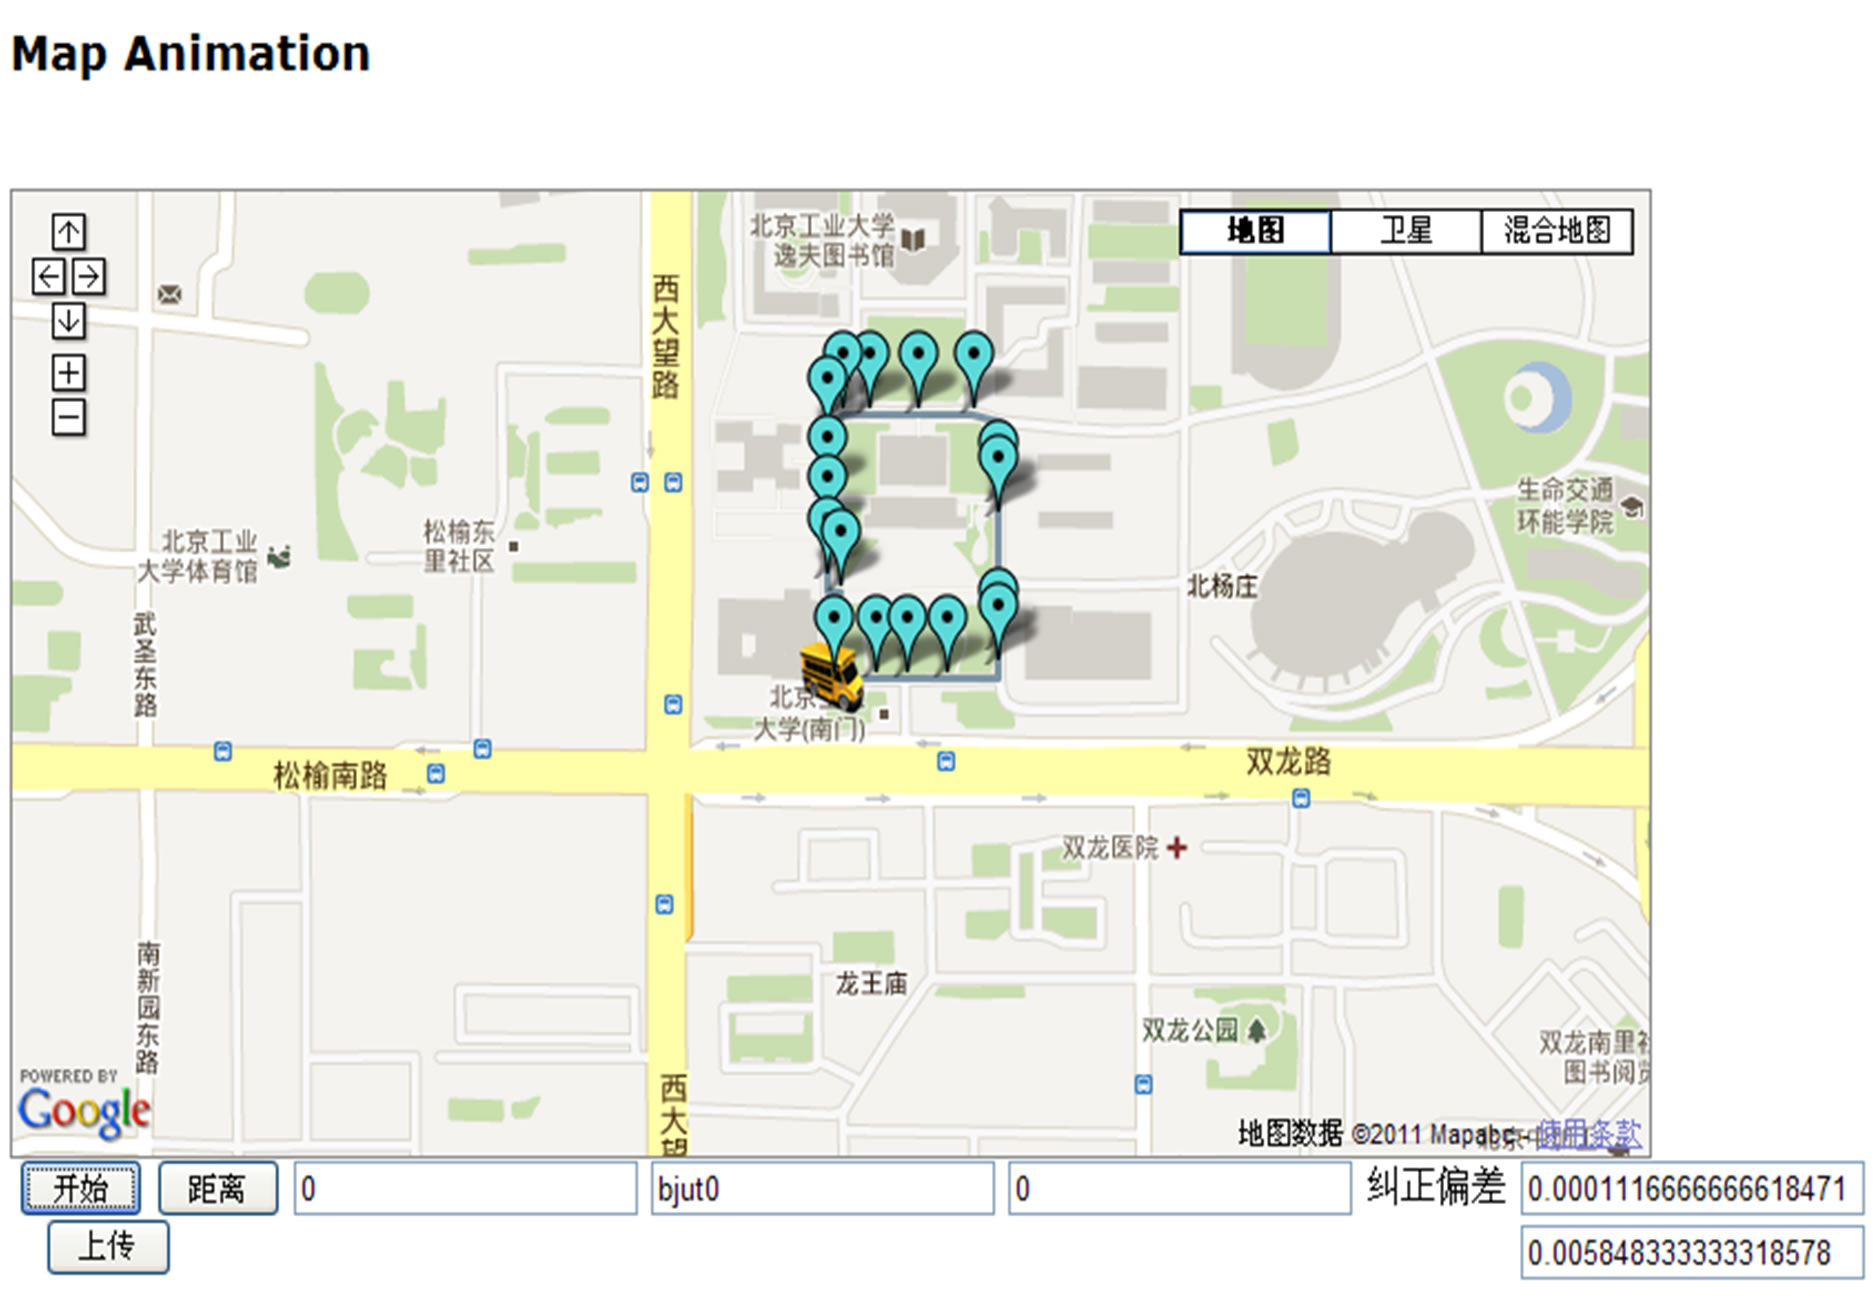
Figure 8. Correction effect.
algorithm locks bus at the cornering and forecasts the next situation in advance [12]. As is shown in Figure 9, when bus runs away from the actual vehicle orbit, the algorithm can make bus return to orbit. The red circle is the range of cornering judgment [13,14].
4.2. Intelligent Transportation System Platform Personalization
The Intelligent transportation system platform personalization problem is embodied in: when the consumer opens up Web page again, the system can pick up corrected longitude and latitude data from the database. Then the system continues to calculate out bus current location, distance between the bus and the nearest station and arriving time. Thereby the system avoids the demonstration mistake.
5. Conclusions
With the development of intelligent traffic application and technology of the Internet of things, based on the Internet of things frame intelligent transportation system can provide public transit vehicle information for resident and dispatching point [15]. This system will have an effect to improve the traffic resources utilization ratio and make travel much more convenient.
It is the most important to resolve problem about vehicle location information in the Intelligent Tansportation System. On one aspect, the resident can inquire about the public transit vehicle’s information in the internet and find out which circuit they want to choose. The system not only economizes waiting time and rise travel efficiency but also provides the technology guarantee for punctually arriving at the destination. On another aspect, public transit controller stand strengthens public transit vehicle controller ability according to public transit vehicle information. The public transit controller stand can depend on public transit vehicle information to dispatch bus during the peak time. When bus appears state of emergency, the system can provide vehicle location
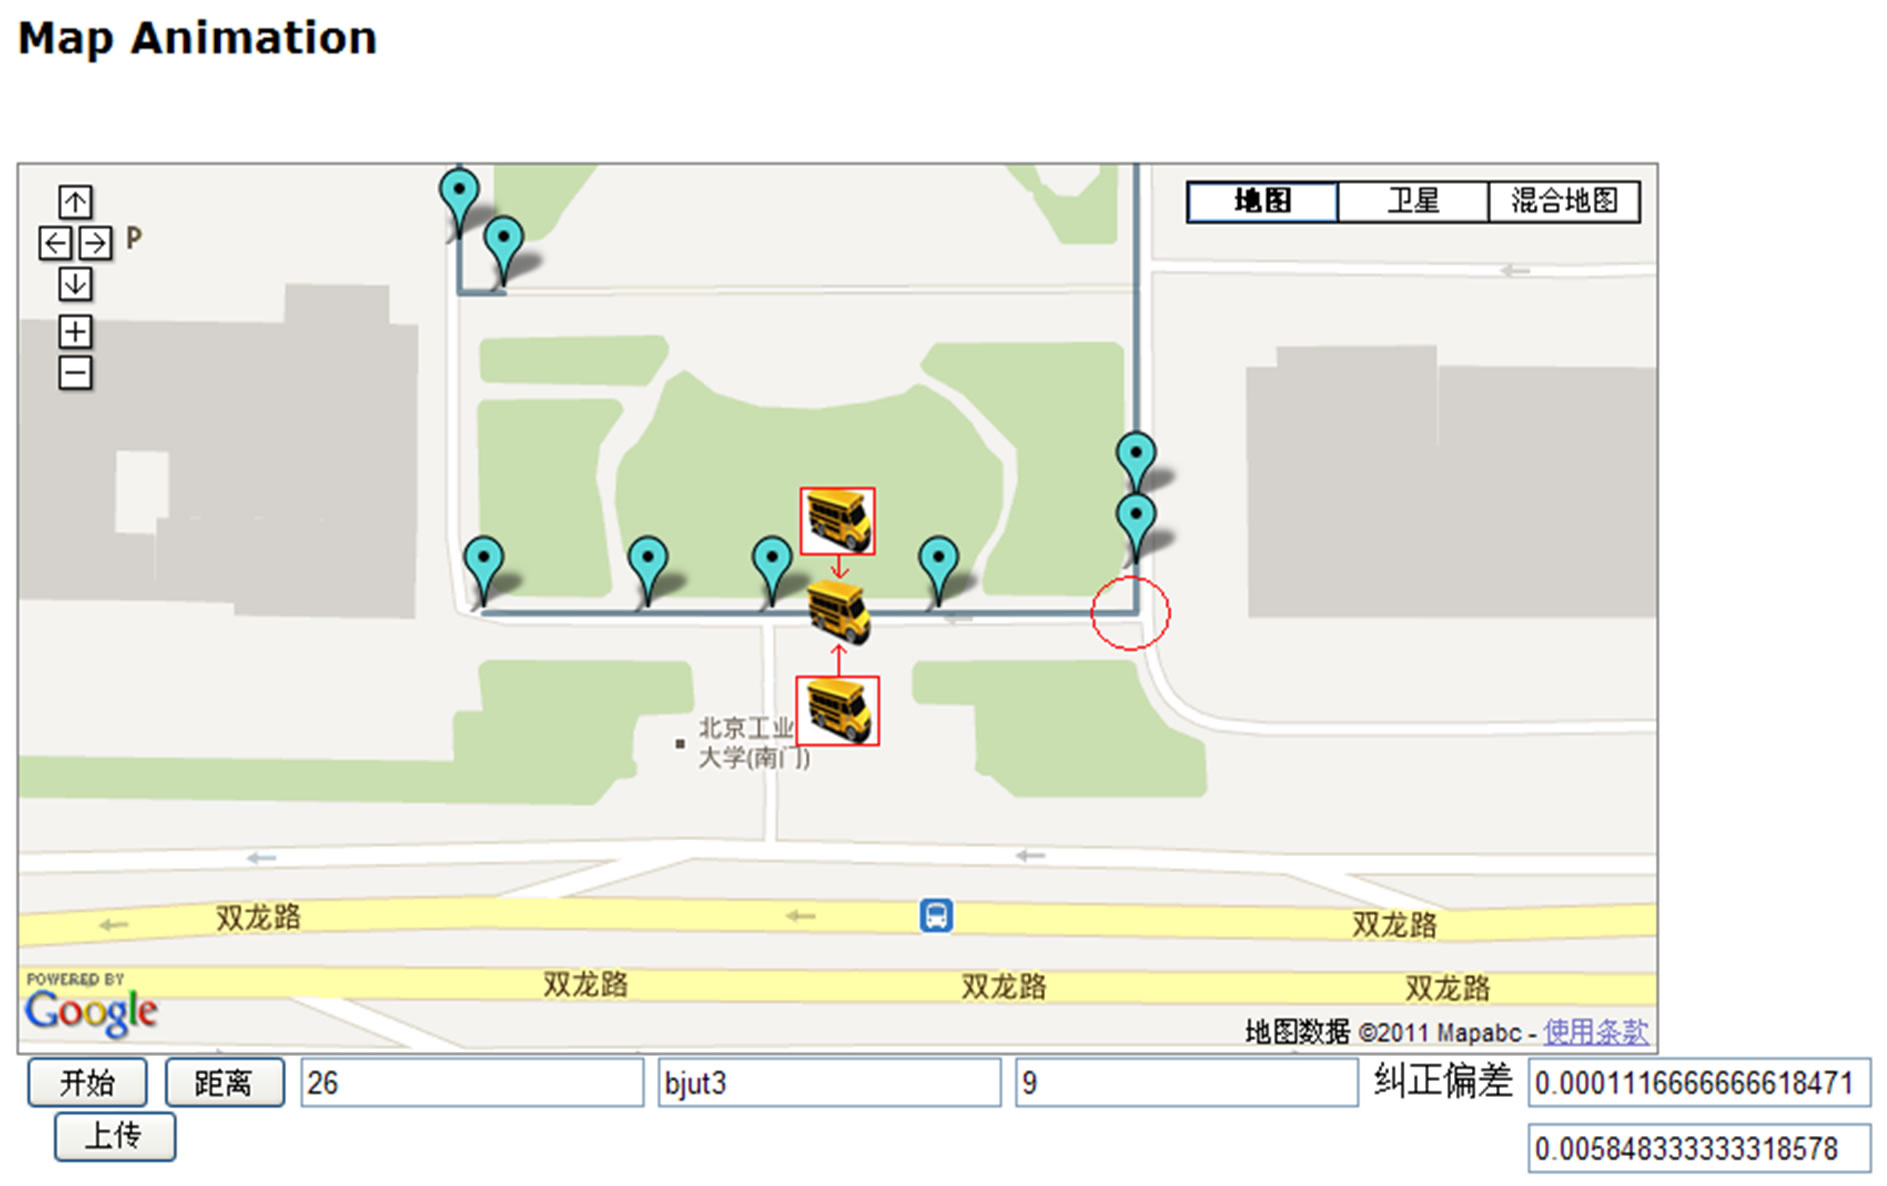
Figure 9. Visualization effect.
and accurate time for rescue workers.
Therefore, based on the Internet of things frame Intelligent transportation system has very big prospect and space on intelligent traffic field.
REFERENCES
- Q. Qian, “Google Earth/Maps/KML Kernel Development Technology,” Proceedings of Google Earth/Google Maps the Use of Basic, Public House of Electronics Industry, Beijing, 2010, pp. 23-57.
- Y. C. Chen, “Google Maps API Development Guinness,” Proceedings of Development of Google Maps API, China Machine Press, Beijing, 2010, pp. 274-327.
- P. Wilton and J. McPeak, “Beginning JavaScript Fourth Edition,” Proceeding of Ajax, Tsinghua University Press, Beijing, 2011, pp. 441-473.
- Z. Z. Liu, “ASP.NET Development Guinness,” Proceeding of ASP.NET Operation of the Database, Tsinghua University Press, Beijing, 2011, pp. 270-297.
- M. Lee and G. Bieker, “Mastering SQL Server 2008,” Proceeding of SQL Server and .NET Client, Tsinghua University Press, Beijing, 2011, pp. 421-449.
- A. Calderon and J. Rumerman, “Advanced ASP. NET AJAX Server Controls for .NET Framework 3.5,” Proceeding of AJAX Control Toolbox, China Machine Press, Beijing, 2009, pp. 334-377.
- Z. Y. Li, “LINQ From the Foundation to the Project Deelopment,” Proceeding of LINQ to SQL, Chemical Industry Press, Beijing, 2010, pp. 174-263.
- Z. J. Zhu, “Smarter Cloud Computing: The Basic of Internet of Things,” Proceeding of Cloud Computing and Wisdom of the World of Intelligence Operation, Electronics Industry Press, Beijing, 2010, pp. 23-35.
- K. Jung, “Beginning Linux Programming,” Proceeding of Extending Linux with Functions, John Wiley & Sons, New York, 2007, pp. 134-342.
- P. Bardwell and S. Marr, “Making the Most of Collaboration an International Survey of Public Service Co-Design, DEMOS Report 23,” DEMOS, Price Waterhouse Coopers (PWC) Public Sector Research Centre, London, 2008.
- Z. Wall and D. J. Dailey, “An Algorithm for Predicting the Arrival Time of Mass Transit Vehicle Using Automatic Vehicle Location Data,” The 78th Annual Meeting of the Transportation Research Board, Washington, DC, 12 January 1999.
- Google Maps API, 2012. http://code.google.com/apis/maps/index.html
- Wikipedia, 2012. http://www.wikipedia.org/
- R. Jeong and L. R. Rilett, “Bus Arrival Time Prediction Using Artificial Neural Network Model,” IEEE 7th Intelligent Transportation Systems Conference, Washington DC, 11-15 January 2004, pp. 988-993
- W. Li, M. W. Koendjbiharie, R. C. Juca, Y. Yamashita, and A. Maciver, “Algorithms for Estimating Bus Arrival Times Using GPS Data,” IEEE 5th International Conference on Intelligent Transportation Systems, Singapore City, 3-6 September 2002, pp. 868-873.