Atmospheric and Climate Sciences
Vol.3 No.4(2013), Article ID:36700,5 pages DOI:10.4236/acs.2013.34050
The Neutron Flux Variation in the Earth’s Atmosphere Depending on the Solar Proton Flux
Department of Physics, University of Osijek, Osijek, Croatia
Email: branko@fizika.unios.hr, planinic@ffos.hr
Copyright © 2013 Marina Poje et al. This is an open access article distributed under the Creative Commons Attribution License, which permits unrestricted use, distribution, and reproduction in any medium, provided the original work is properly cited.
ABSTRACT
The Earth is continually exposed to the cosmic radiation of both solar and galactic origin. Solar eruption and solar activity may affect cosmic radiation flux density which has a secondary effect on the flux of particles in the atmosphere as well. Such one event was recorded in the last week of October 2003, where the measured dose rate of the cosmic radiation in the aircraft ATR 42 was 1.8 times higher than the average value of the other measurements. Later we found the data on an unusual solar activity in the mentioned time interval. Analysis of the increasing solar proton flux during the solar flare, as well as the decreasing neutron flux in the atmosphere (representing the galactic radiation), on May 14 and 15, 2005, showed a nonlinear correlation with the exponential equation of regression; this one described galactic ray modulation by solar flux during the short term variation of cosmic radiation.
Received June 29, 2013; revised July 30, 2013; accepted August 7, 2013
Keywords: Cosmic Radiation; Solar Radiation; Galactic Component; Forbush’s Decrease
1. Introduction
Cosmic radiation has a normally dominant galactic component as well as a component of solar origin [1,2]. Galactic radiation is modified during its passage through space by interactions with interstellar matter, and in the environment of the solar system. It consists of nuclei (88% protons, 11% alpha particles, and about 1% heavier nuclei), 98% of total, and 2% of electrons. The energy of nuclei ranges up to over 1014 MeV [3].
Transient, unusual high levels of cosmic radiation can result from solar particles, produced by sudden, sporadic releases of energy in the solar atmosphere (solar flares), and by coronal mass ejections. Only a small fraction of solar radiation produces large numbers of high-energy protons which cause observable increased intensity in cosmic radiation fields at aviation altitudes. Maximum solar flare duration may last from hours to several days.
The Sun has a varying magnetic field with a basic dipole component that reverses direction approximately every 11 years. At solar maximum there are many sunspots as well as plasma of protons and electrons, which ejected from the Sun (the solar wind) carry relatively strong magnetic field.
When the magnetic field is stronger, the paths of the ions are bent more, and fewer galactic cosmic rays reach the Earth, thus solar maximum causes a radiation minimum, and, conversely, solar minimum is the time of radiation maximum. The size of this effect depends on other two main variables affecting cosmic radiation in the atmosphere: namely altitude and geomagnetic latitude [4,5].
When the primary particles from space, mainly protons, enter the atmosphere, they interact with air nuclei and induce cosmic-ray showers [6-11]. Lower-energy particles are deflected back into space by the Earth’s magnetic field; this effect is more important in the equator region than near the poles.
Neutrons are produced via multi-step reactions; they lose energy mainly by elastic collisions and, when thermalized, they are absorbed by 14N to form 14C. From a few hundred meters above the Earth to near the top of the atmosphere, there is an approximate equilibrium established between neutron production and absorption.
The dose rate resulting from the combination of attenuation and particle production increases with depth in the atmosphere reaching a maximum at ~20 km, then decreases down to the Earth’s surface. The contribution to dose from each particle type depends on altitude, as well as on the phase of the solar cycle. At sea level, the doses of cosmic radiation are ~70 times less than those experienced at ~20 km [12,13].
At aircraft altitude, or flight level around 10 km, one can receive a dose rate of about 5 μSv/h, where the neutrons contribution is around 40%, photon and electron 30%, protons 25% and muons 5%. At sea level, the dominant component of dose equivalent is the muon component [3,12-15].
Specially we considered a short term variation of cosmic radiation (or so-called the cosmic ray Forbush decrease), a phenomenon when the solar flares (with increased flux of charged particles toward the Earth and belonging solar magnetic winds) deflect protons of the galactic radiation, and therefore decrease, for instance, neutron flux as secondary particles of the galactic component in the atmosphere [16-18].
As an example of the short term variation of the cosmic ray, we considered increasing solar proton flux, registered by the GOES satellites, as well as changing neutron flux in the atmosphere, measured by the Oulu Neutron Monitor, during May 13, 14 and 15, 2005 [19].
2. Methods and Results
The dose rate of the cosmic radiation was measured by the Mini 6100 semiconductor dosimeter in the aircraft ATR 42. During the last week of October 2003, the dose rate was 1.8 times higher than the average of the other measurements; later we found data on an unusual solar activity in the mentioned time interval, whereby the short term variation of cosmic radiation, or solar maximum, was interpreted as a Sun flare or coronal mass ejection [20-25].
We take the cosmic ray Forbush decrease into account, a phenomenon during which the solar flares, with increased flux of charged particles toward the Earth, and belonging magnetic winds, deflect protons of the galactic radiation. It therefore decreases, for instance, neutron flux, as secondary particles, produced by the galactic protons in the atmosphere. The solar flares are random, typically one per month, and last for several hours or days [13].
As an example of the short term variation of the cosmic ray, we considered increasing solar proton flux, registered by the GOES satellites (NASA Center), as well as changing neutron flux in the atmosphere, measured by the Oulu Neutron Monitor during May 13, 14 and 15, 2005 [19]. Figure 1(a) presents solar proton flux (p/pfu) during May 13, 14 and 15 on daily hours and Figure 1(b) presents neutron flux (n/%) on May 14 and 15, 2005; the given curves were obtained as the smoothed ones from the experimental curves registered by the GOES satellite (p), and the Oulu Neutron Monitor (n; [19]).
Data of the p were taken from eight equidistant time intervals (approximately every fifth hour) during increasing period, as well as the data of the n (every hour) during decreasing period, as presented in Table 1 (with the ordinary number of interval No).
 (a)
(a) (b)
(b)
Figure 1. (a) Solar proton flux (p/pfu) versus time at May 13-15, 2005; (b) Neutron flux (n/%) versus time at May 15, 2005.

Table 1. The empirical data of the neutron flux, n (%), in the Earth atmosphere, and the solar proton flux, p (pfu), obtained from the empirical curves in Figure 1(a) and Figure 1(b), respectively.
Using the data from Table 1, the following regression curve was obtained:
 (1)
(1)
presented in Figure 2; in the above relationship, P = logp and M = log(−n), with the fitted parameters k1 = 0.313 and k2 = 0.419. The determination coefficient of the exponential correlation was significant (at the significance level of 0.05) with its value of 0.954.
So, for a typical short term variation of the cosmic ray, we were able to estimate a neutron flux change (n/%) in the atmosphere as a result of the solar flare, or modulation of the changing solar proton flux (p). Namely, from the above relationship (1), we got:

Figure 2. The regression curve obtained by fitting the function (1) to the empirical values M = log(−n) versus P = logp (data from Table 1).
 (2)
(2)
We applied the regression Equation (2) to estimate the galactic ray modulation (neutron flux) in short term variation of cosmic radiation (or for the Forbush’s decrease). During the last week of October 2003 (when the case of increasing solar radiation described by the above mentioned experiment with the aircraft ATR 42 happened) we used the data of the solar maximum; the proton flux maximum, registered at 28th October 2003, at location S16 E08, as solar proton events affecting the Earth environment, for proton energies > 10 MeV, by GOES spacecraft (NASA Center), was p03,1 = 29,500 pfu [24]. By adopting the proton detector sensitivity of the 28th October 2003 (GOES1) to the one of the 15th May 2005 (GOES2), the p03,1 value became (for the adopted sensitivity) as p03,a = 3758 pfu (by comparing proton maximums: p03,1 (=9500; in 2003; GOES1), p05,2s (=800; in 2005; GOES2; from the smoothed curve, Figure 1(a)), p05,1 (=3140; in 2005; GOES1) and p05,2 (=1600; in 2005; GOES2; peak from the experimental curve which was obtained from the smoothed curve Figure 1(a)); the next relationship was obtained:

The value p03,a, introduced into Equation (2), gave: n03 = −25.1 (minus, as decreasing neutron flux, in percentage, %) ; so the n03 was obtained as the estimated neutron flux in the atmosphere at the ground level for the measured proton flux of the solar maximum at the end of October 2003. By the same event, the measured neutron minimum was nm = −19 (or nm = n1 [25]); so we could consider the estimation error as (nm – n03) = 6.1, or the relative error as (nm – n03)/n03 = 24.3%.
Otherwise, if we apply the Poisson distribution to the proton flux (p), and if we take the standard deviation for the measured value p03,a = 3758 as , the standard deviation of the neutron flux (n) can be determined in the following way:
 (3):
(3):
where the n is to be taken from the Equation (2).
Of course, a source of error by applying the Equation (2) or (1) may lie in uncertainty by choosing data, or points from the empirical curves in Figures 1(a) and 1(b), for preparing Table 1; the modulation of the galactic ray (here the neutron flux) by the solar protons can last more hours or a few days, and different durations of solar flares can influence the determination of values of the fitted parameters k1 and k2.
Neutron fluxe (%) versus time (years) is given in Figure 3, for a longer period; so one can see the neutron flux variation, presented in Figure 1(b), as a detail from the period of 2003 to 2012 year of the neutron variation in the Earth atmosphere.
3. Conclusions
During the last week of October 2003, the dose rate of the cosmic radiation, measured by the Mini 6100 semiconductor dosimeter in the aircraft ATR 42, was 1.8 times higher than the average of the other measurements; later we found data on an unusual solar activity in the mentioned time interval, and the short term variation of cosmic radiation, or solar maximum, was interpreted as a Sun flare or coronal mass ejection.
Galactic ray modulation by the solar flux was investigated in short term variation of the cosmic radiation. The analysis of the increasing solar proton flux (p) during the solar flare, as well as the decreasing neutron flux (n) in the atmosphere, at May 14 and 15, 2005 showed a
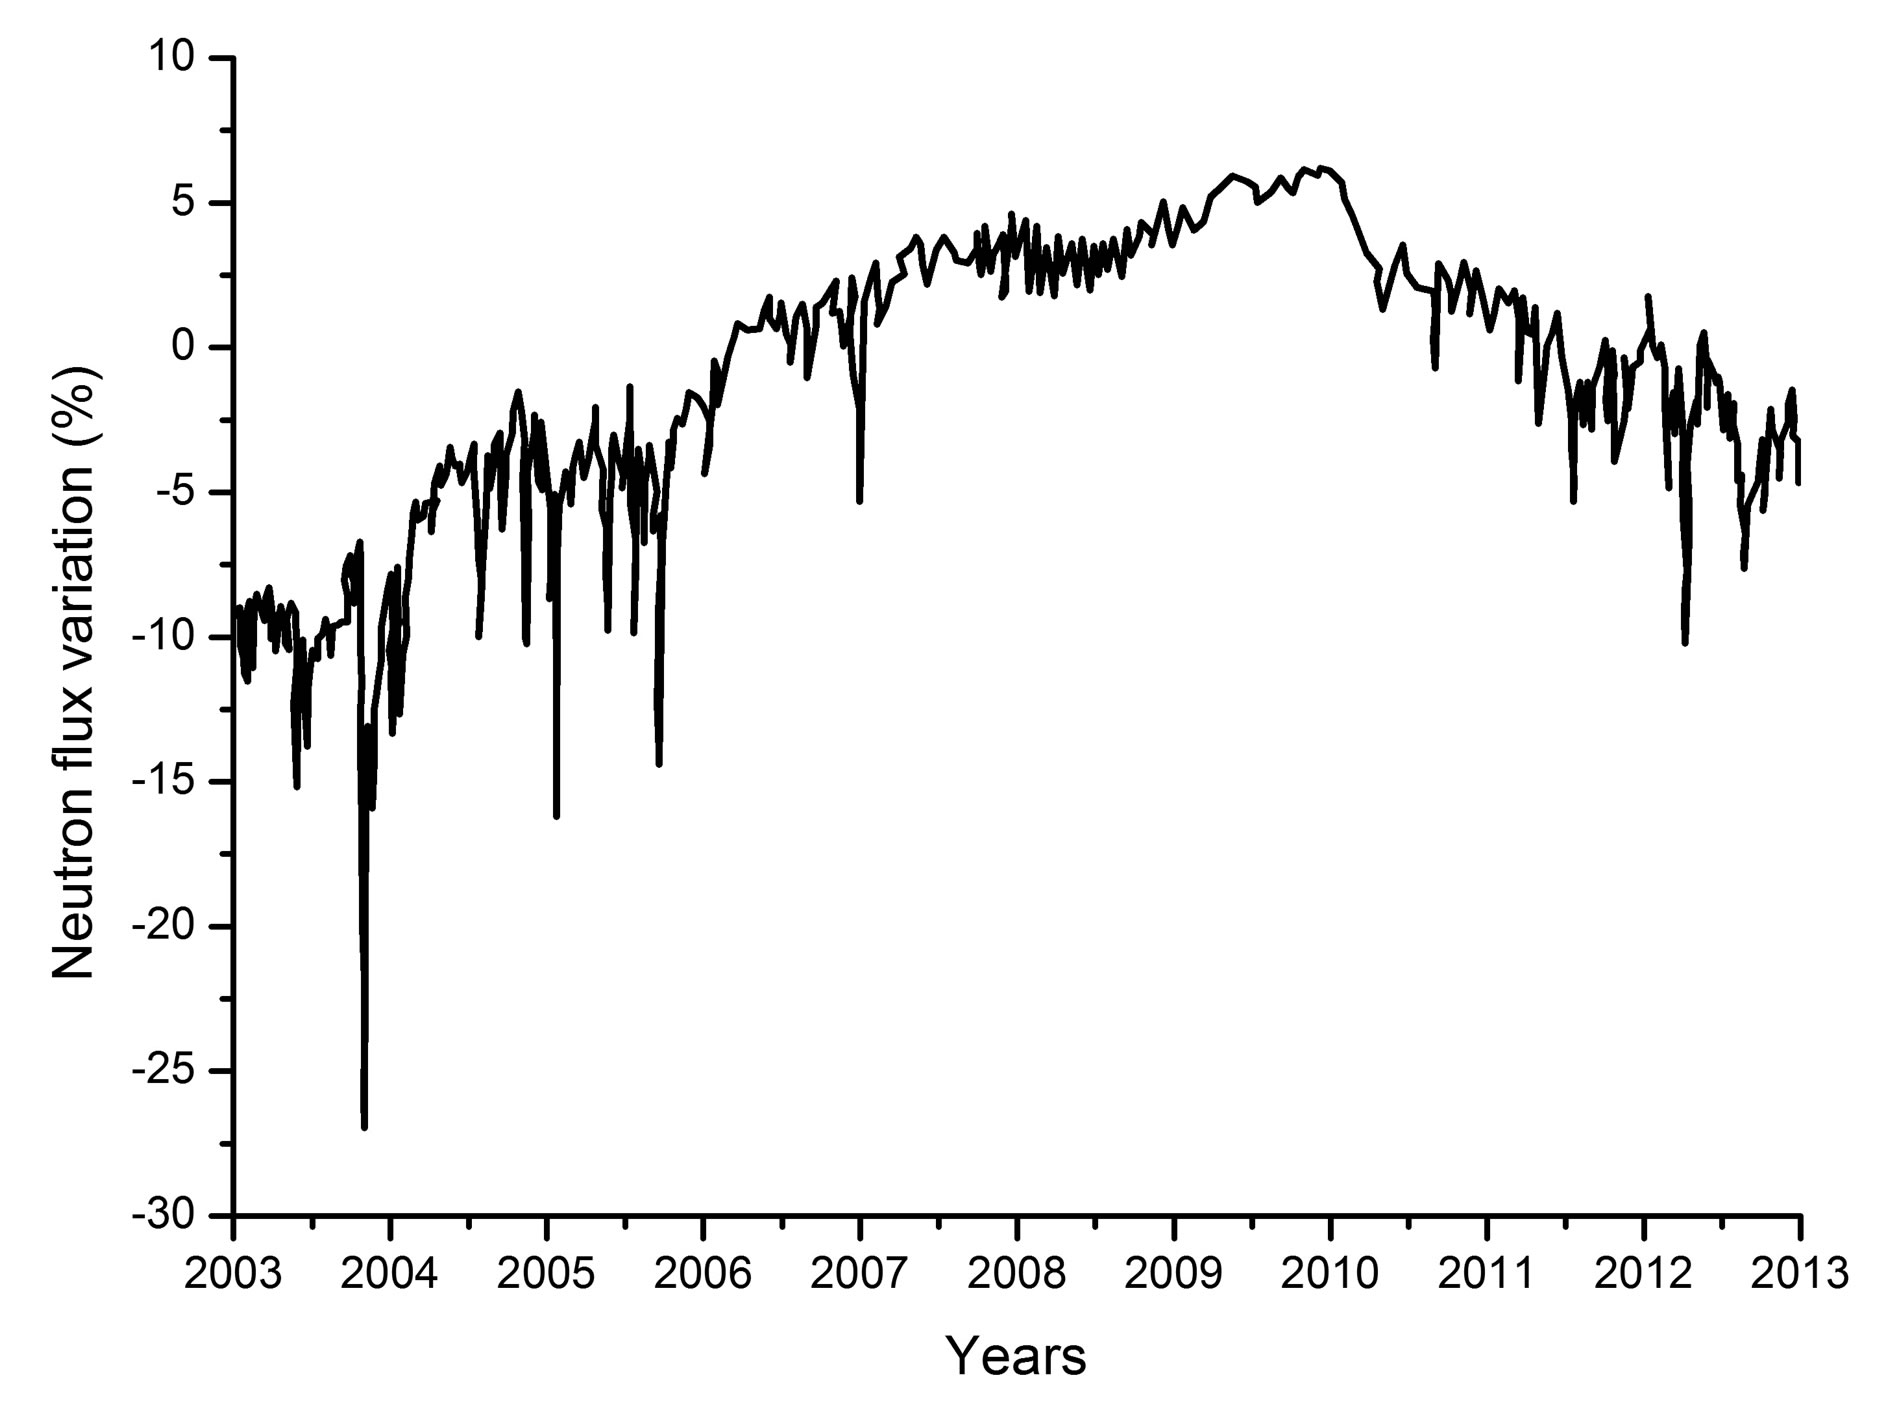
Figure 3. Neutron flux (%) versus time (years).
nonlinear correlation with the exponential equation of regression (1). So, using the explicit equation on the n, (2), it was possible to estimate a neutron flux change in the atmosphere as a result of the registered solar flare in the form of an increasing solar proton flux that happened in the last week of October, 2003. The discrepancy between the estimated neutron flux in the atmosphere and the measured one was 24.3%.
REFERENCES
- L. Anchordoqui, T. Paul, S. Reucroft and J. Swain, “Ultrahigh Energy Cosmic Rays: The State of the Art before the Auger Observatory,” International Journal of Modern Physics A, Vol. 18, No. 13, 2003, pp. 2229-2366.
- T. Geisser, “Cosmic Rays and Particle Physics,” Cambridge University Press, Cambridge, 1999.
- D. T. Bartlett, “Radiation Protection Aspects of the Cosmic Radiation Exposure of Aircraft Crew,” Radiation Protection Dosimetry, Vol. 109, No. 4, 2004, pp. 349-355. http://dx.doi.org/10.1093/rpd/nch311 http://dx.doi.org/10.1109/9.402235
- P. Goldhagen, “Overview of Aircraft Radiation Exposure and Recent ER-2 Measurements,” Health Physics, Vol. 79, No. 5, 2000, pp. 526-544. http://dx.doi.org/10.1097/00004032-200011000-00009
- S. Solanki, I. Usoski, B. Kromer, M. Schüessler and J. Beer, “Unusual Activity of the Sun During Recent Decades Compared to the Previous 11,000 Years,” Nature, Vol. 431, No. 7012, 2004, pp. 1084-1087. http://dx.doi.org/10.1038/nature02995
- R. J Sheu and S. H. Jiang, “Cosmic-Ray-Induced Neutron Spectra and Effective Dose Rates Near Air/Ground and Air/Water Interfaces in Taiwan,” Health Physics, Vol. 84, No. 1, 2003, pp. 92-99. http://dx.doi.org/10.1097/00004032-200301000-00008
- P. Goldhagen, J. M. Clem and J. W. Wilson, “The Energy Spectrum of Cosmic-Ray Induced Neutrons Measured on an Airplane over a Wide Range of Altitude and Latitude,” Radiation Protection Dosimetry, Vol. 110, No. 1-4, 2004, pp. 387-392. http://dx.doi.org/10.1093/rpd/nch216
- P. Maestro, H. S. Ahn, P. Allison, et al., “Elemental Energy Spectra of Cosmic Rays Measured by CREAM-II,” Proceedings of the 31st International Cosmic Ray Conference, Lodz, 7-15 July 2009, Article ID: icrc0641.
- R. Mewaldt, M. Looper, C. Cohen, D. Haggerty, A. Labrador, R. Leske, G. Mason, J. Mazur and T. von Rosenvinge, “Energy Spectra, Composition, and Other Properties of Ground-Level Events during Solar Cycle 23,” Space Science Reviews, Vol. 171, No. 1-4, 2012, pp. 97- 120. http://dx.doi.org/10.1007/s11214-012-9884-2
- G. F. Krymsky, V. G. Grigorev and S. A. Stardubtsev, “New Method for Estimating the Absolute Flux and Energy Spectrum of Solar Cosmic Rays Based on NeutronMonitor Data,” Journal of Experimental and Theoretical Physics Letter, Vol. 88, No. 7, 2008, pp. 411-413. http://dx.doi.org/10.1134/S0021364008190016
- Yu. V. Balabin, E. V. Vashenyuk, O. V. Mingalev, A. I. Podgorny and I. M. Podgorny, “The Spectrum of Solar Cosmic Rays: Data of Observations and Numerical Simulation,” Astronomy Reports, Vol. 49, No. 10, 2005, pp. 837-846. http://dx.doi.org/10.1134/1.2085253
- P. A. Colgan, H. Synnott and D. Fenton, “Individual and Collective Doses from Cosmic Radiation in Ireland,” Radiation Protection Dosimetry, Vol. 123, No. 4, 2007, pp. 426-434. http://dx.doi.org/10.1093/rpd/ncl527
- United Nations Committee on the Effects of Atomic Radiation, Sources and Effects of Ionising Radiation, UNSCEAR, New York, 2000.
- P. Goldhagen, M. Reginatto, T. Kniss, J. Wilson, J. Singlettery, I. Jones and W. van Steveninck, “Measurement of the Energy Spectrum of Cosmic-Ray Induced Neutrons aboard an ER-2 High-Altitude Airplane,” Nuclear Instruments and Methods in Physics Research A, Vol. 476, No. 1-2, 2002, pp. 42-51. http://dx.doi.org/10.1016/S0168-9002(01)01386-9
- F. Tuo, L. Shou, C. Xu, Y. Yao, T. Ren and Q. Zhou, “Measurement of Cosmic Radiation Dose to Air Crew Connecting for a Typical Polar Route Flight,” Journal of Radioanalytical and Nuclear Chemistry, Vol. 293, No. 3, 2012, pp. 935-939. http://dx.doi.org/10.1007/s10967-012-1775-1
- W. Heinrich, S. Roesler and H. Schraube, “Physics of Cosmic Radiation Fields,” Radiation Protection Dosimetry, Vol. 86, No. 4, 1999, pp. 253-258. http://dx.doi.org/10.1093/oxfordjournals.rpd.a032953
- A. Wawrzynczak and M. V. Alania, “Modeling and Data Analysis of a Forbush Decrease,” Advances in Space Research, Vol. 45, No. 5, 2010, pp. 622-631. http://dx.doi.org/10.1016/j.asr.2009.09.005
- O. Okike and A. B. Collier, “A Multivariate Study of Forbush Decrease Simultaneity,” Journal of Atmospheric and Solar-Terrestrial Physics, Vol. 73, No. 7, 2011, pp. 796-804. http://dx.doi.org/10.1016/j.jastp.2011.01.015
- Oulu Neutron Monitor. http://cosmicrays.oulu.fi/webform/query.cgi?startday=13&startmonth=05&startyear=2005&starttime=00%3A00&endday=15&endmonth=05&endyear=2005&endtime=23%3A30&resolution=Automatic+choice
- B. Vuković, I. Lisjak, V. Radolić, B. Vekić and J. Planinić, “Measurements of the Dose Due to Cosmic Rays in Aircraft,” Nuclear Instruments and Methods in Physics Research A, Vol. 562, No. 1, 2006, pp. 517-520. http://dx.doi.org/10.1016/j.nima.2006.01.132
- I. Getley, “Observation of Solar Particle Event on Board a Commercial Flight from Los Angeles to New York on 29 October 2003,” Space Weather, Vol. 2, No. 5, 2004, Article ID: S05002. http://dx.doi.org/10.1029/2003SW000058
- Solar Data Charts, 2003. http://www.dxlc.com/solar/history/hist2003.html
- J. W. Wilson, “Overview of Radiation Environments and Human Exposures,” Health Physics, Vol. 79, No. 5, 2000, pp. 470-494. http://dx.doi.org/10.1097/00004032-200011000-00005
- NOAA Space Environment Services Center, Solar Proton Events Affecting the Earth Environment. http://umbra.nascom.nasa.gov/SEP/seps.html
- M. Poje, B. Vuković, M. Varga, V. Radolić, I. Miklavčić, D. Faj and J. Planinić, “Relation between Galactic and Solar Cosmic Radiation at Aviation Altitude,” Advances in Space Research, Vol. 42, No. 12, 2008, pp. 1913-1916. http://dx.doi.org/10.1016/j.asr.2008.06.001