Open Journal of Fluid Dynamics
Vol.2 No.4A(2012), Article ID:25814,7 pages DOI:10.4236/ojfd.2012.24A026
Correlation between Aerodynamic Noise and Velocity Fluctuation of Tip Leakage Flow of Axial Flow Fan
Department of Mechanical Engineering, Oita University, Oita, Japan
Email: hamakawa@oita-u.ac.jp
Received September 11, 2012; revised October 25, 2012; accepted November 4, 2012
Keywords: Fan; Noise; Tip Leakage Flow; Relative Flow Measurement; Correlation Measurement; Acoustic Resonance
ABSTRACT
In the present paper the attention is focused on correlation between fan noise and velocity fluctuations of tip leakage vortex around rotor blade of a low pressure axial flow fan at the maximum pressure operating point. We measured time fluctuating velocity near the rotor tip around the rotor blades by using a hot-wire sensor from a relative flame of reference fixed to the rotor blades. As the results, it is clear that the velocity fluctuation due to tip leakage vortex has weak periodicity and the hump portion appeared in its spectrum. If the flow rate was lower than the design condition, the tip leakage flow became to attach to the following blade and the sound pressure level at frequency of velocity fluctuation of this flow was increased. The correlation measurements between the velocity fluctuation of tip leakage flow and the aerodynamic noise were made using a rotating hot-wire sensor near the rotor tip in the rotating frame. The correlation between the velocity fluctuation due to tip leakage flow and acoustic pressure were increased due to generation of weak acoustic resonance at the maximum pressure operating point.
1. Introduction
Low noise level is an important sales point of the various kinds of machines as well as high performance and miniaturization. This situation is also applied to axial flow fans used, for example, in air conditioners.
The controlling noise source generated from an axial flow fan is turbulent noise due to vortex shedding when the fan is operated near the design point [1,2]. Fukano et al. have investigated the discrete frequency noise generated by Karman vortex shedding from a flat plate blade immersed in a uniform two-dimensional flow field, and theoretically introduced a formula to predict its sound pressure level [3].
On the other hand, aerodynamic noise increase by enlarging a tip clearance is studied by Longhouse [4], Fukano et al. [5], and Kameier and Neise [6]. Their studies showed that the spectral peaks occurred in sound spectra although a tip clearance noise is broadband naturally. Fukano and Jang [7] also reported that the noise increase due to tip clearance flow at low flow rate condition was analyzed with relation to the distribution of velocity fluctuation due to the interference between the tip leakage vortex and the adjacent pressure surface of the blade. However, the relation between the aerodynamic sound and the tip leakage vortex near the rotor tip in axial flow fan is unclear in detail.
The purpose of the present study is to clarify the relation between fan noise and velocity fluctuations of tip leakage flow around rotor blade of a low pressure axial flow fan in the cases of the design and off design point. The correlation measurements between the velocity fluctuation of tip leakage flow and the aerodynamic noise are made using a rotating hot-wire sensor near the rotor tip in the rotating frame.
2. Experimental Apparatus and Procedure
The schematic view of the experimental apparatus is shown in Figure 1. It was an open-loop facility having the duct inner diameter of 579 mm. The facility consisted of a bellmouth inlet, a fan driving motor connected by the belt, a damper and a booster fan. The aerodynamically designed damper was used to adjust the flow rates.
The present study was performed on low speed axial flow fan of the tip clearance of 2 mm, the outer radius of 287.5 mm and the number of blades of 9. A flow coefficient (F) and a total pressure rise coefficient (Yt) are defined as
 (1)
(1)

Figure 1. Experimental apparatus.
 (2)
(2)
where Q is the volume flow rate, Dt the rotor tip diameter, Dh the rotor hub diameter, Ut the rotor tip speed, ΔPt the total pressure rise, and ρ the air density. The fan has a design flow coefficient F of 0.41. Figure 2 shows the total pressure rise Yt plotted against flow coefficient F of the test fan. The total pressure rise was measured by using 5-hole pitot tube. The rotor blade has NACA 65 series profile sections designed by free vortex operation. The blade stagger angle at the rotor tip is 63.9 deg. The experimental measurements were carried out at the design operating condition of F = 0.41 and off design conditions of F = 0.31, 0.47 while rotational speed of the fan rotor was kept constant, 1000 rpm. The blade tip section of the rotor has the solidity of 0.65 and the chord length of 131 mm. Reynolds number based on the rotor tip speed and the rotor tip chord length is 2.5 × 10⁵. The trailing edges of the rotor blades were semicircle shape which thickness δt were 2.0 mm over the whole span of the blades.
The velocity fluctuation near blade tip was measured from a relative frame of reference fixed to the rotating blade by using an I-type hot-wire sensor which rotated with the same speed of the blade. The hot-wire was a tungsten filament wire of 5-μm diameter. The schematic view of the experimental apparatus used in the present experiment is shown in Figure 3. The hot-wire sensor was traversed and fixed at pre-determined location by a computer controlled traversing system even when it was turning. The traversing probe was controlled by the three-dimensional traversing system, i.e., radial, axial and rotational directions, installed inside of the hub with traverse resolution of 0.3 mm.
The wire of the probe sensor was set parallel to the radial direction of the rotor blade. The output from this sensor was automatically sampled by a computer and the statistical values were calculated. The spectrum analysis

Figure 2. Total pressure rise of test fan.

Figure 3. Schematic of the test section.
of the velocity fluctuation was performed using FFT analyzer. The output from the hot-wire probe was carried from a rotating frame to a stationary frame through slip ring unit installed inside of the hub as shown in Figure 1. Figure 4 shows a measuring area around rotor blade in the blade passage. The measuring area on the L-Z plane is 96 per cent span of blade and R-Z plane is from 0.90 to 0.97.
The aerodynamic sound generated from the rotor blade was measured at the position of 1 m upstream from the fan rotor and on the rotational axis. In the measurement of the sound, the background noise kept 5 dB below the sound pressure level of all frequencies. The frequency

Figure 4. Measuring area around rotor blade.
resolution was estimated to be 5.0 Hz.
The resonance curve was measured by the supply of sinusoidal tone from the speaker at the outlet of test duct as shown in Figure 1, and the damping ratio ζ was obtained by the half power method. This measurement of acoustic damping ratio was carried out in the condition without the flow.
3. Results and Discussion
3.1. Acoustic Resonance Frequency in the Duct
The resonant frequency in the Z-direction of the duct is given by
 (1)
(1)
where a is the sound velocity, L the length of the duct, and m the number of standing waves in the duct. Natural resonance frequencies in the Z-direction of the duct are about 86.9Hz (m=3), 144.8 Hz (m = 5), 173.8 Hz (m = 6), 231.7 Hz (m = 8), 405.5 Hz (m = 14), 550.3 Hz (m = 19), etc., when the temperature of the flow t is 20˚C.
Figure 5 shows the typical result of measured frequency response characteristic in the test duct. The multiple peaks were formed at the frequency response spectrum. The peak frequencies of f5 = 140 Hz, f6 = 175 Hz, f8 = 235 Hz, f14 = 405 Hz and f19 = 550 Hz agree with the resonance frequencies calculated by Equation (1) although there are the bellmouth, hub, honeycomb and chamber in the test duct. It is considered that the other peaks of 185 Hz, 210 Hz and 355 Hz etc. were formed by the acoustic resonance of the Z-direction coupled with the other direction.
Figure 6 shows the variation of acoustic damping ratio ζ plotted against the resonance frequencies. The acoustic damping ratio became local minimum at about 175 Hz. It is considered that it is easy to generate the acoustic resonance of this mode in the test duct.
3.2. Aerodynamics Sound of Test Fan
Figure 7 shows the spectra of aerodynamic sound for the operating conditions: F = 0.28 - 0.44. In the figure, n indicate the harmonic frequencies of blade passing where the fundamental blade passing frequency BPF is 150 Hz.

Figure 5. Frequency response characteristic.

Figure 6. Acoustic damping ratio.

Figure 7. Sound pressure level of test fan.
The spectral peak at about 175 Hz excepting the harmonic of BPF is observed from F = 0.28 to 0.32.
Figure 8 shows the variation of peak sound pressure level (SPL) at about 175 Hz. It should be noted that the peak level increase below the flow rate F = 0.32 although the SPL over F = 0.37 have almost same values irrespective of the flow rate F.
3.3. Velocity Fluctuation near Bade Tip at Design Point
Figure 9(a) shows the distribution of the time averaged relative velocity u on the L-Z plane of 96 per cent span of the blade in the test fan for design condition (F = 0.41). The relative velocity normalized by the circumferential velocity of the blade tip Ut. It should be noted that the low velocity region distributes in the blade passage without interference with the adjacent blade surface.

Figure 8. Variation of peak SPL at 175 Hz.
Figure 9(b) shows the distributions of u/Ut on the R-Z plane. The low velocity region on the R-Z plane distributes circular cross section near the casing in the blade passage and moves to the casing surface in the downstream direction.
The distribution of turbulence intensity on the L-Z plane of 96 per cent span is shown in Figure 9(c) as the contour maps of the coefficient of the velocity variation, u'/Ut. This coefficient was defined as the ratio of the intensity u', i.e. the standard deviation of velocity fluctuation, to the circumferential velocity of the blade tip Ut. And Figure 9(d) shows the distributions of the turbulence intensity on the R-Z plane. Evidently, the intense velocity fluctuations on the each plane are observed near the corresponding low velocity region as shown in Figures 9(a) and (b). It is considered that this region results from the tip leakage vortex [7]. The tip leakage vortex formed on suction side grows in the downstream direction without interference with the pressure surface of adjacent blade in the design operating condition.
It is well known that the intense velocity fluctuation is closely related to the aerodynamic sound generation. Figure 9(e) shows the typical spectrum of velocity fluctuations at the  point (×symbol) in Plane III of Figure 9(d). The spectrum is obtained by a FFT analyzer, which averages each value 64 times at a measuring position. The spectrum was broad-band and the periodicity of velocity fluctuation became weak although single peak was formed at about 320 Hz in the spectrum.
3.4. Velocity Fluctuation near Blade Tip at off Design Point
In the present study, the peak level increased below the flow rate F = 0.32 as described in Figure 8. Hereafter, the flow structure and the spectral characteristics of the fluctuating velocity in the blade passage are discussed in the axial flow fan at the maximum pressure rise condition of F = 0.31, because the increase of SPL is predicted due to the stall below the flow rate F = 0.29.
Figure 10 shows the contour of relative velocity and turbulence intensity for F = 0.31. The low velocity and the intense velocity fluctuation region near the pressure
 (a)
(a) (b)
(b) (c)
(c) (d)
(d) (e)
(e)
Figure 9. Design operating point (Φ = 0.41, αt = 3.8˚). (a) Contour map of relative velocity (L-Z plane); (b) Contour map of relative velocity (R-Z plane); (c) Contour map of turbulence intensity (L-Z plane); (d) Contour map of turbulence intensity(R-Z plane); (e) Spectrum of velocity fluctuation.
surface of the adjacent rotor blade is observed. These regions move closer to the pressure side as the flow rate decreases, and the tip leakage vortex interferes with the pressure surface of the adjacent blade. Especially, the intense velocity fluctuation presents near the pressure surface (dotted blue line in Figure 10(c)).
Figure 10(e) shows the typical spectrum of velocity fluctuations at the  point (× symbol) in Plane III of Figure 10(d). The single peak was formed at about 170 Hz
 (a)
(a)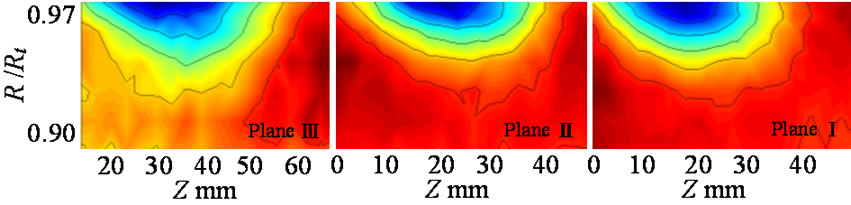 (b)
(b) (c)
(c) (d)
(d) (e)
(e)
Figure 10. Maximum pressure rise point (Φ = 0.31, αt = 8.9˚). (a) Contour map of relative velocity (L-Z plane); (b) Contour map of relative velocity (R-Z plane); (c) Contour map of turbulence intensity (L-Z plane); (d) Contour map of turbulence intensity (R-Z plane); (e) Spectrum of velocity fluctuation.
in the spectrum, which was same frequency of the peak of SPL excepting the harmonic of BPF as described in Figure 7.
Figure 11 shows the contour of relative velocity and turbulence intensity for F = 0.47. The low velocity and the intense velocity fluctuation region due to tip leakage vortex distributes in the blade passage without interfereence with the adjacent blade surface, which are similar to the results at design condition (F = 0.41). However, the velocity fluctuation increased at the adjacent blade surface because the flow separated from the surface of pressure side of blade.
The spectrum of velocity fluctuation of tip leakage vortex was broad-band and the periodicity of velocity fluctuation became weak as described in Figures 9(e), 10(e) and 11(e). In the present study, the peak frequency
 (a)
(a)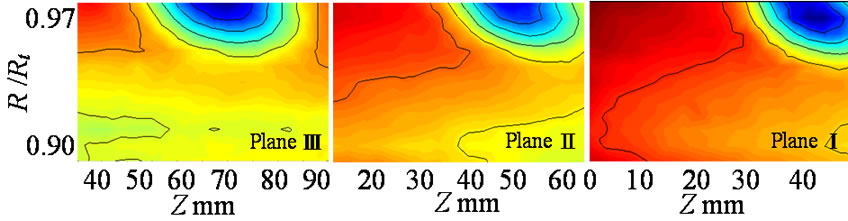 (b)
(b) (c)
(c) (d)
(d) (e)
(e)
Figure 11. Over discharge range (Φ = 0.47, αt = 0.9˚). (a) Contour map of relative velocity (L-Z plane); (b) Contour map of relative velocity (R-Z plane); (c) Contour map of turbulence intensity (L-Z plane); (d) Contour map of turbulence intensity (R-Z plane); (e) Spectrum of velocity fluctuation.
band Δf as shown in Figure 9(e) was focused at the operating condition from F = 0.31 to 0.47. Figure 12 shows the variation of frequency band of velocity fluctuation due to tip leakage vortex against the flow coefficient F. This frequency band increases with F at the constant rotational speed of the fan rotor.
3.5. Correlation between Aerodynamic Sound and Velocity Fluctuation Due to Tip Leakage Vortex
We measured the correlation between the aerodynamic sound and the velocity fluctuations due to tip leakage vortex to clarify the mechanism of increase of the peak level of 175 Hz components for flow coefficient F.
Figure 13 shows the typical coherence coefficient Cxy for F = 0.31 to 0.47. The hot-wire sensor was set at  points around the blade tip, as shown in Figures 9(d), 10(d) and 11(d).
  points of F = 0.41 and 0.47 were locations in the blade passage as shown in Figures 9(c) and 11(c) and that of F = 0.31 was near the pressure surface of the adjacent rotor blade as shown in Figure 10(c). Figure 13(a) shows the result of F = 0.31. Two peaks were observed at 90 Hz and 175 Hz in the coherence coefficient Cxy. The values of coherence at 90 Hz and 175 Hz were about 0.19 and 0.32 respectively. These low values were caused by the coherence between the signal of microphone which included all of sound radiated from 9 blades of test rotor and that of the velocity fluctuation from single hot-wire near one blade. It should be noted that these peak frequencies agreed well with the acoustic resonance frequencies of 87.4 Hz and 174.8 Hz which were 3rd and 6th mode of acoustic resonance of duct at 23˚C respectively. The peak levels increased at 90 Hz and 175 Hz in the SPL spectrum as shown in Figure 7, and these frequencies were included in the hump portion of spectrum as described in Figure 10(e). On the other hand, no peak was observed in the frequency response spectrum at 90 Hz as shown in Figure 5 and the acoustic damping ratio increased as shown in Figure 6 although that was local minimum at 175 Hz. This is caused by the effect of excitation position on the generation of acoustic resonance and damping ratio in the duct. Therefore, it is

Figure 12. Variation of frequency band of spectrum.
considered that the weak acoustic resonance were excited from the sound due to interaction between the tip leakage vortex and the surface of pressure side of the adjacent blade at F = 0.31.
Figures 13(b) and (c) show the results of F = 0.41 and 0.47 respectively. The coherence coefficient become below about 0.06 for all frequencies although the signals of velocity fluctuation and that of SPL included for all frequencies components as described in Figures 7, 9(e) and 11(e). Therefore, the low values of coherence of 0.32 at 175 Hz and 0.19 at 90 Hz for F = 0.31 are sufficiently larger than those of 0.06 for F = 0.41 and 0.47. It is considered that the aerodynamic sound at 90 Hz and 175 Hz for F = 0.31 correlate the velocity fluctuation near the pressure surface of the adjacent rotor blade.
From above discussion, it is concluded that the aerodynamic sound at about 90 Hz and 175 Hz were caused by the weak acoustic resonance excited from the sound due to interaction between the tip leakage vortex and the surface of pressure side of the adjacent blade at F = 0.31.
 (a)
(a)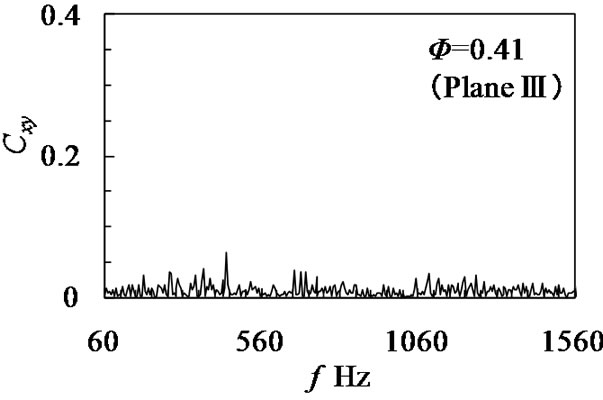 (b)
(b) (c)
(c)
Figure 13. Correlation between noise and velocity fluctuation. (a) F = 0.31; (b) F = 0.41; (c) F = 0.47.
4. Conclusions
The relation between fan noise and velocity fluctuations of tip leakage flow around rotor blade of a low pressure axial flow fan is investigated experimentally by using rotating a hot-wire sensor at a design and off design operating conditions. As a result, the following conclusions were obtained:
1) The spectral peak of SPL excepting the harmonic of BPF is observed from the maximum pressure operating condition to stall region. This frequency agrees well with the frequencies of velocity fluctuation due to tip leakage vortex at the maximum pressure operating condition and the resonance frequency of the duct;
2) The correlation measurements between the velocity fluctuation of tip leakage flow and the aerodynamic sound were made using a rotating hot-wire sensor near the rotor tip in the rotating frame. The correlation between the velocity fluctuation due to tip leakage flow near the pressure surface of the adjacent rotor blade and the acoustic pressure were increased at the maximum pressure operating point. This sound was caused by the weak acoustic resonance excited from the sound due to interaction between the tip leakage vortex and the surface of pressure side of the adjacent blade;
3) At the design operating condition, the low velocity and the intense velocity fluctuation region due to tip leakage vortex distributed in the blade passage without interference with the adjacent blade surface. This region distributed circular cross section in the blade passage and moved to the casing surface in the downstream direction;
4) At the maximum pressure operating condition, the low velocity and the intense velocity fluctuation region due to tip leakage vortex near the pressure surface of the adjacent rotor blade was observed. This region moved closer to the pressure side as the flow rate decreased, and interfered with the pressure surface of the adjacent blade. This frequency of velocity fluctuation increased with the flow rate at the constant rotational speed of the fan rotor.
5. Acknowledgements
This investigation was supported by a research grant from Harada commemorative foundation.
REFERENCES
- I. J. Sharland, “Sources of Noise in Axial Flow Fans,” Journal of Sound and Vibration, Vol. 1, No. 3, 1964, pp. 303-322. doi:10.1016/0022-460X(64)90068-9
- T. Fukano, Y. Kodama and Y. Senoo, “Noise Generated by Low Pressure Axial Flow Fans, I: Modeling of the Turbulent Noise,” Journal of Sound and Vibration, Vol. 50, No. 1, 1977, pp. 63-74. doi:10.1016/0022-460X(77)90551-X
- T. Fukano, A. A. Talukuder, T. Kozu and Y. Takamatsu, “Discrete Frequency Noise Generated from a Flat Plate in Parallel with a Uniform Oncoming Flow,” Memoirs of the Faculty of Engineering Kyushu University, Vol. 44, No. 1, 1984, pp. 19-39.
- R. E. Longhouse, “Control of Tip-vortex Noise of Axial Flow Fans by Rotating Shrouds,” Journal of Sound and Vibration, Vol. 58, No. 2, 1978, pp. 201-214. doi:10.1016/S0022-460X(78)80075-3
- T. Fukano, Y. Takamatsu and Y. Kodama, “The Effects of Tip Clearance on the Noise of Low Pressure Axial and Mixed Flow Fans,” Journal of Sound and Vibration, Vol. 105, No. 2, 1986, pp. 291-308. doi:10.1016/0022-460X(86)90158-6
- F. Kameier and W. Neise, “Experimental Study of Tip Clearance Losses and Noise in Axial Turbomachines and Their Reduction, American Society of Mechanical Engineers,” Journal of Turbomachinery, Vol. 119, No. 3, 1997, pp. 460-471. doi:10.1115/1.2841145
- T. Fukano and C.-M. Jang, “Tip Clearance Noise of Axial Flow Fans Operating at Design and Off-Design Condition,” Journal of Sound and Vibration, Vol. 275, No. 3-5, 2004, pp. 1027-1050. doi:10.1016/S0022-460X(03)00815-0