T. I. EDEWOR ET AL.
138
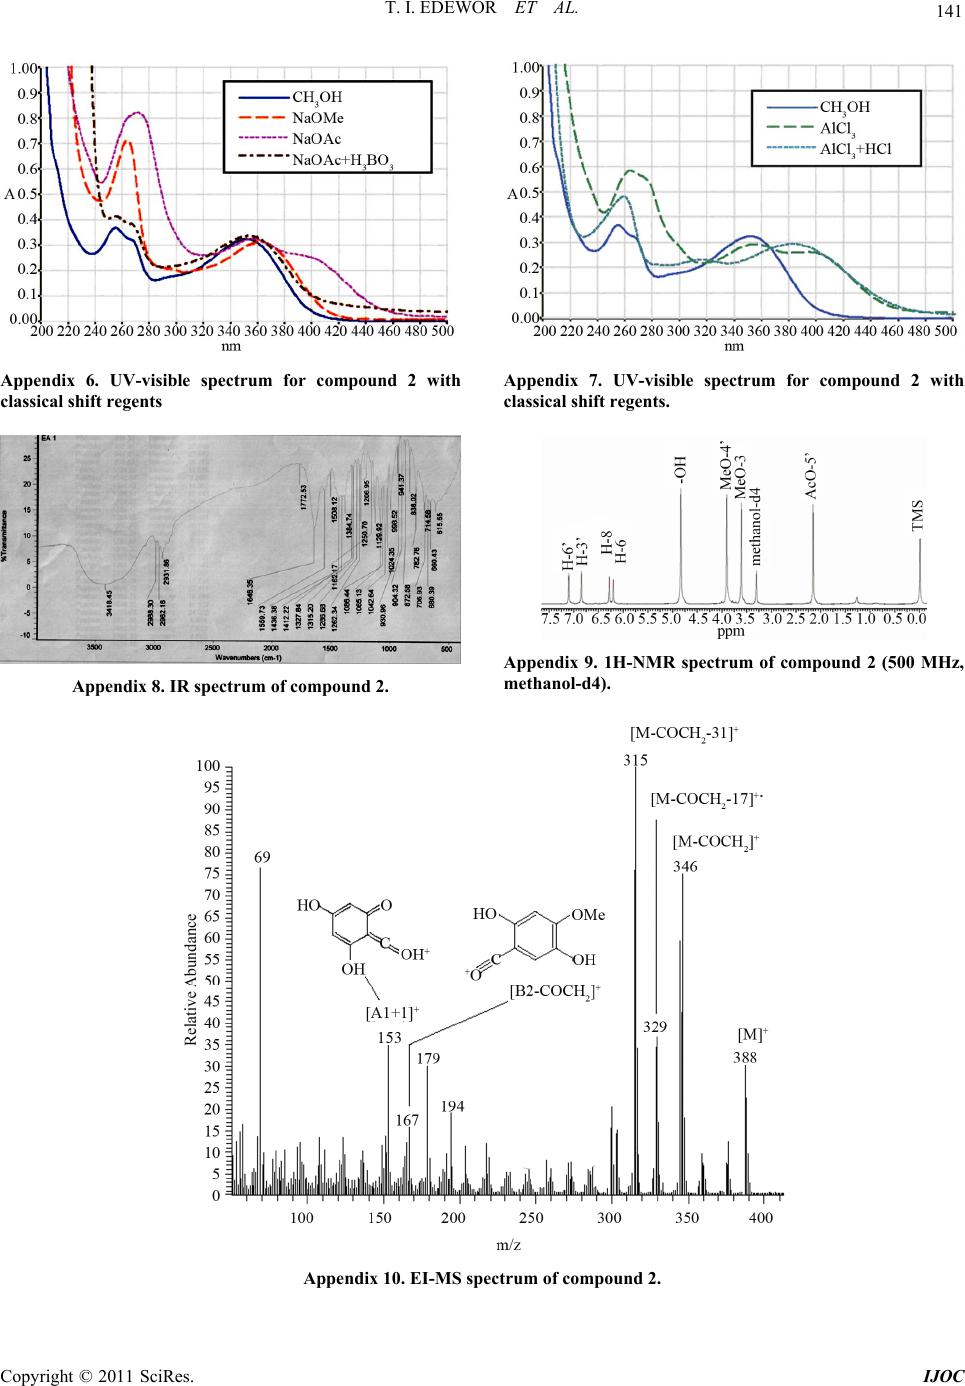
4. Conclusions
The isolation and spectroscopic characterization of anti-
bacterial flavonoids from the methanolic leaf extract of A.
hispidum DC was described. The antibacterial flavonoids
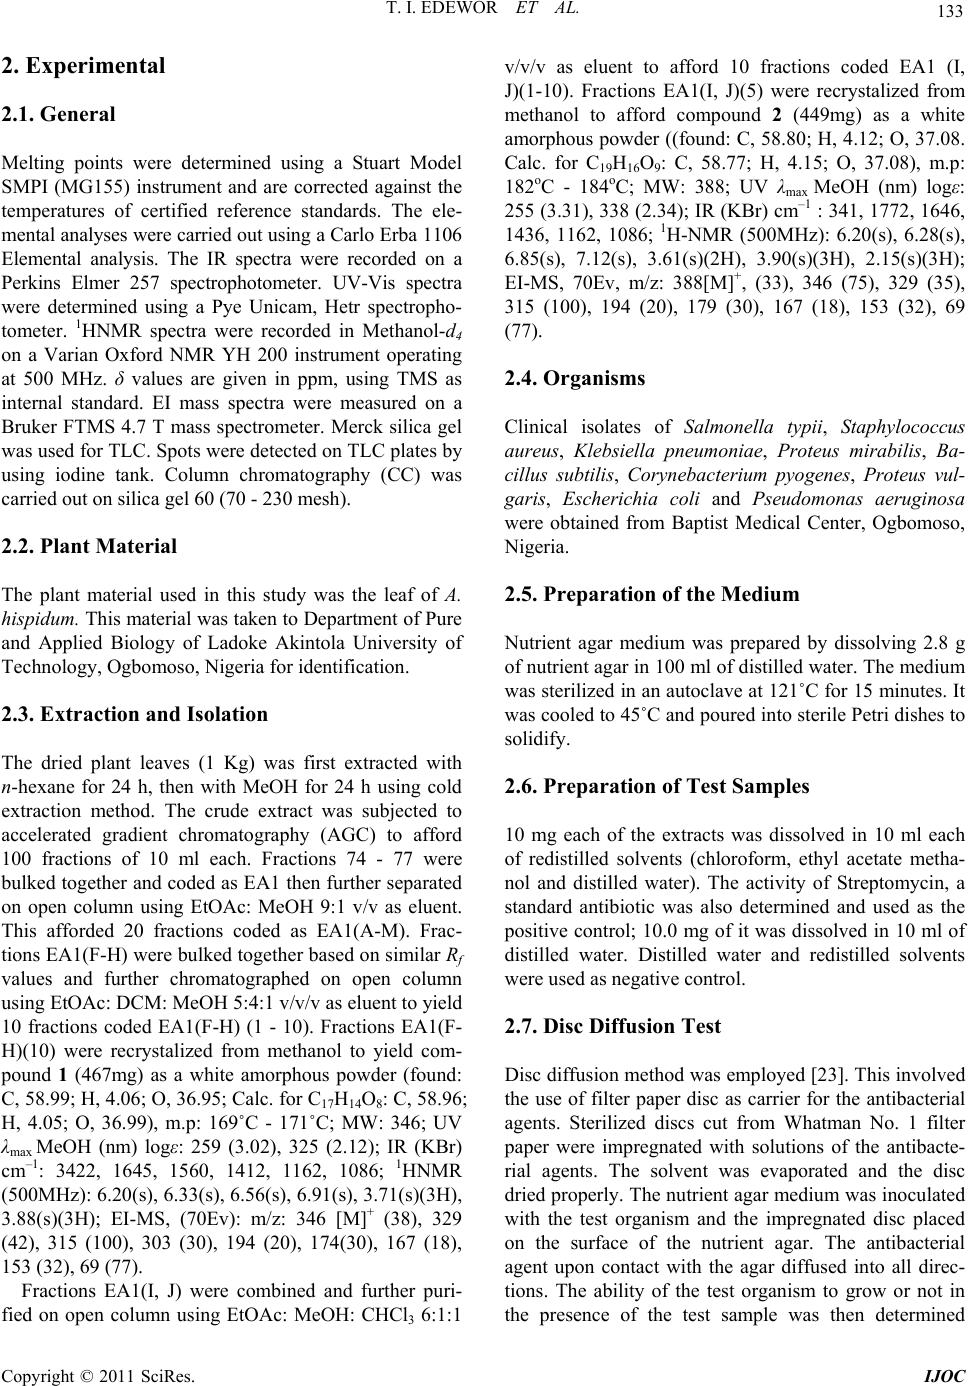
are flavones and were identified as 5,7,2’,5’-tetrahydro-
xy-3,4’-dimethoxyflavone and 5’-acetoxy-5,7,2’-trihy-
droxy-3,4’-dimethoxyflavone.
5. References
[1] C. A. Olafimihan, “Antibacterial Efficacy of Citrus Aura-
ntifolia,” Nigerian Society for Experimental Biology
Journal, Vol. 2, No. 2, 2002, pp. 165-167.
[2] D. Z. Egah, C. S. S. Bello, E. E. Banwat and J. A. Alana,
“Antibacterial Susceptibility Pattern of S. aureus in Jos,
Nigeria,” Nigerian Journal of Medicine, Vol. 8, No. 2,
1999, pp. 58-61.
[3] K. A. Abo, V. O. Ogunleye and J. S. Ashidi, “Antimicro-
bial Potential of Spondias mombin, Croton zambescus
and Zygotritonia crocea,” Phytotherapy Research, Vol.
13, No. 6, pp. 494-497.
doi:10.1002/(SICI)1099-1573(199909)13:6<494::AID-P
TR490>3.0.CO;2-9
[4] A. A. Elegami, E. I. Elnima, A. K. Muddathir and M. E.
Omer, “Antimicrobial Activity of Plicosepalus acacia,”
Fitoterapia, Vol. 72, 2001, pp. 431-434.
[5] A. Islam, A. Sayeed, M. S. A. Bhuiyan, M. A. Mosadik,
M. A. U. Islam and G. R. M Astaq Mondal Khan, “An-
timicrobial Activity and Cytotoxicity of Zanthoxylum
budrunga,” Fitoterapia, Vol. 72, 2001, pp. 428-430.
[6] J. O. Adebayo, M. T. Yakubu, E. C. Egwin, B. V. Owo-
eye and B. U. Enaibe, “Effect of Ethanolic Extract of
Khaya senegalensis on Some Biochemical Parameters of
Rat Kidney,” Journal of Ethnopharmacol, Vol. 88, No. 1,
2003, pp. 69-72. doi:10.1016/S0378-8741(03)00193-4
[7] A. G. R. Nair, S. A. Rao, B. Voirin, F. Favre and J. Bon-
vin, “Polyphenolic Compounds from Leaves of Acan-
thospermum hispidum,” Fitoterapia, Vol. 56, No. 4, 1985,
pp. 240-250.
[8] S. B. Mathur and L. B. Bejarane, “Isolation of Triacon-
tane, N-Butil Eicosante and N-Heptacosanol from Acan-
thospermum hispidum,” Phytochemistry, Vol. 15, 1976, p.
2026.
[9] M. U. S. Sultanbawa, G. P. Wannigama and W. M. Ban-
daranayake, “Chemical Investigation of Ceylonese Plants.
Part XXIX. A Survey of Plants of Sri Lanka (Ceylon) for
Alkaloids I,” Lloydia, Vol. 41, 1978, pp. 597-633.
[10] N. A. G. Ramachandran, S. A. Rao and B. Voirin, “Poly-
phenolic Compounds from Leaves of Acanthospermum
hispidum,” Fitoterapia, Vol. 56, 1985, pp. 249-251.
[11] F. Bohlmann, J. Jakupovic, C. Zdero, R. M. King and H.
Robinson, “Naturally Occurring Terpene Derivatives, 179.
New Melampolidis and Cis-Cis-Germacranolides from
Members of the Subhibes Melanpodiinae,” Phytoche-
mistry, Vol. 18, 1979, pp. 625-630.
[12] L. H. Yao, Y. M. Jiang, J. Shi, F. A. Tomás-Barberán, N.
Datta, R. Singanusong and S. S. Chen, “Flavonoids in
Food and Their Health Benefits,” Plant Foods for Human
Nutrition, Vol. 59, 2004, pp. 113-122.
doi:10.1007/s11130-004-0049-7
[13] P. J. Ferguson, E. Kurowska, D. J. Freeman, A. F.
Chambers and D. J. A. Koropatnick, “Favonoid Fraction
from Cranberry Extract Inhibits Proliferation of Human
Tumor Cell Lines,” Journal of Nutrition, Vol. 134, 2004,
pp. 1529-1535.
[14] B. Havsteen, “Flavonoids, A Class of Natural Products of
High Pharmacological Potency,” Biochemical Pharma-
cology, Vol. 32, 1983, pp. 1141-1148.
[15] P. M. Lyons-Wall and S. Samman, “Flavonoids-Dietary
Perspectives and Health Benefits,” Nutrition Society of
Australia, Vol. 21, 1997, pp. 106-114.
[16] T. E. Ma, S. Celestino and C. R. Julián, “Anthocyanins in
Cereals,” Journal of Chromatography A, Vol. 1054, 2004,
pp. 129-141.
[17] Y. J. Moon, X. D. Wang and M. E. Morris, “Dietary Fla-
vonoids: Effects on Xenobiotic and Carcinogen Meta-
bolism,” Toxicology in Vitro, Vol. 20, 2006, pp. 187-210.
doi:10.1016/j.tiv.2005.06.048
[18] M. M. Rahman and A. Gray, “Antimicrobial Constituents
from the Stem Bark of Feronia Limonia,” Phytochemistry,
Vol. 59, 2002, pp. 73-77.
[19] D. T. Okpako, “Traditional African Medicine as a Viable
Compliment to Modern Medicine,” A Paper Presented at
a Seminar Organized by E. O. Kafaru: Simple Ways of
Staying Healthy, 1997, pp. 20-27.
[20] M. F. Agra, P. F. França and J. M. Barbosa-Filho, “Syn-
opsis of the Plants Known as Medicinal and Poisonous in
Northeast of Brazil,” Revista Brasileira de Farmacog-
nosia, Vol. 17, 2007, pp. 114-140.
[21] K. R. Markham, “Techniques of Flavonoid Identifi-
cation,” Academic Press, London, 1982, pp. 36-51.
[22] T. I. Mabry, K. R. Markham and W. B. Thomas, “The
Systematic Identification of Flavonoids,” Springer, New
York, 1970, pp. 35-250.
[23] A. W. Bauer, W. M. M. Kirby, J. C. Sheriss and M.
Turck, “Antibiotic Susceptibility Testing by Standardized
Single Disk Method,” American Journal of Clinical Pa-
thology, Vol. 45, 1966, pp. 493-496.
[24] P. G. Zhang and S. U. Xu, “Two New c-Glycoside
Flavonoids from Leaves of Crataegus Pinnatifida Bge.
var. Major N.E.Br.,” Chinese Chemical Letters, Vol. 13,
No. 4, 2002, pp. 337-340.
[25] J. W. Bright and E. C. M. Chen, “Mass Spectra Inter-
pretation Using the ‘Rule of 13’,” Journal of Chemical
Education, Vol. 60, No. 7, 1983, pp. 557-558.
doi:10.1021/ed060p557
[26] R. Scherrer and P. Gerhardt, “Molecular Sieving by the
Bacillus Megaterium Cell Wall and Protoplast,” Journal
of Bacteriology, Vol. 107, 1971, pp. 718-735.
[27] H. Nikaido and M. Vaar, “Molecular Basis of Bacterial
Outer Membrane Permeability,” Microbiological Reviews,
Copyright © 2011 SciRes. IJOC