Journal of Water Resource and Protection
Vol.4 No.3(2012), Article ID:17950,9 pages DOI:10.4236/jwarp.2012.43019
Evaluation of Meandering Characteristics Using RS & GIS of Manu River
Department of Civil and Environmental Engineering, Shahjalal University of Science and Technology, Sylhet, Bangladesh
Email: deb_civil@hotmail.com
Received December 30, 2011; revised January 31, 2012; accepted March 1, 2012
Keywords: River Morphology; Meanders; Bend Migration; GIS; Remote Sensing; Satellite Images
ABSTRACT
A river or stream is dynamic through time. The most significant morphological property of a river is the meandering process, which is dominated and governed by hydraulic, hydrologic and topographic characteristics of the river and its drainage area [1]. In a meandering river, the length of the river keeps on increasing by eroding the outer bank of a bend [2]. The present study has been conducted to investigate the meandering parameters of Manu River using Remote sensing technology and Geographic information system. The name Manu River used here to represent the river reach from Tripura border to the confluence with Kushiyara River in Manumukh, Sherpur. Ten critical bend have been chosen in Manu River which are changing over time. The minimum width as found was 52.6 m at near Brahman-bazar (chainage 22.58 km) in 1997; the maximum width was 80.6 m near Rajnagar (chainage 34 km) in 2006. Meandering ratio varies from 0.32 to 1.67 and wavelength 558.31 m to 1803.54 m. The Sinuosity of the river ranges from 1.36 to 2.48.
1. Introduction
Study area of Manu River shown in the Figure 1 represent the river reach from Tripura border to the confluence with Kushiyara River in Manumukh, Sherpur and it lengths 69.88 km. It is also an alluvial and highly sinuous river. Ten major bends have been selected in this study reach. The mean highest and lowest water levels of Manu River are 18.88 m and 12.77 m respectively [3]. It is a highly sinuous river with lots of meander and lateral bank migration in it.
2. Meander and Meander Parameters [4]
A meander in general is a bend in a sinuous watercourse. A meander is formed when the moving water in a stream erodes the outer banks and widens its valley. A stream of any volume may assume a meandering course, alternatively eroding sediments from the outside of a bend and depositing them on the inside. The result is a snaking pattern as the stream meanders back and forth across its down-valley axis. When a meander gets cut off from the main stream, an oxbow lake is formed. Over time meanders migrate downstream, sometimes in such a short time as to create civil engineering problems for local municipalities attempting to maintain stable roads and bridges.
The technical description of a meandering watercourse is termed meander geometry. It is characterized as an irregular waveform. Ideal waveforms, such as a sine wave, are one line thick, but in the case of a stream the width must be taken into consideration. The bankfull width is the distance across the bed at an average crosssection at the full-stream level, typically estimated by the line of lowest vegetation.
Meander Length (ML): It is the axial length of one meander, i.e. the tangential distance between the corresponding points of a meander.
Meander Width (MB): It is the distance between the outer edges of clockwise and anti-clockwise loops of a meander.
Meander Ratio: It is the ratio of meander width to meander length, i.e. MB/ML
Sinuosity: It is the ratio of the length along the channel (i.e. actual length) to the direct axial length of the river.
Wavelength: At any cross-section the River/stream is following the sinuous axis, the centerline of the bed. Two consecutive crossing points of sinuous and down-valley axis define a meander loop. The meander is two consecutive loops pointing in opposite transverse directions. The distance of one meander along the down-valley axis is the meander length or wavelength.
Radius of curvature (R): In contrast to sine waves, the loops of a meandering stream are more nearly circular. The radius of the loop is considered to be the straight line perpendicular to the down-valley axis intersecting the


Figure 1. Study area (Manu River).
sinuous axis at the apex.
3. Data Collection and Methodology
Satellite Image Data
A series of satellite images for the Manu River has been collected. The original source of the images is Bangladesh Space Research and Remote Sensing Organization (SPARRSO). For this study, satellite images of 1997, 2006 & 2010 which were shown in Figure 2, Figure 3 & Figure 4 respectively, collected directly from SPARRSO. The software ArcGIS 9.2 is used to analyze the images. From the analysis, ten critical bend have been found out which are changing with the time very hastily. Critical changes on these bends are revealed in Figure 13 to Figure 22. Firstly, the river area was delineated from the images using ArcGIS 9.2. Then, polygons of different years were digitized on each single bend. Location of the bend apex, actual length, axial or straight length, sinuosity, radius of curvature, meander ratio and river widths were then calculated using ArcGIS tool [5].
4. Results and Discussions
4.1. Width of the River
The width of the river is defined as the distance between two banks as drawn from images. Here width of the river measured from the images considering the point bars and active corridors, which go under water during monsoon. From Figure 5, the minimum width as found from the time series was 52.6 m at Brahman Bazar in 1997, the maximum width was 80.6 m on bend 2 at Rajnagar in 2006.
4.2. Radius of Curvature
Figure 6 shows the variation of radius of curvature with time. It was found that the maximum radius of curvature is 629 m on bend 9 at India Border in 1997 and the minimum is 192 m on bend 3 at Rajnagar in 2010.
4.3. Meander Wavelength
Figure 7 shows the variation of wavelength of the bends
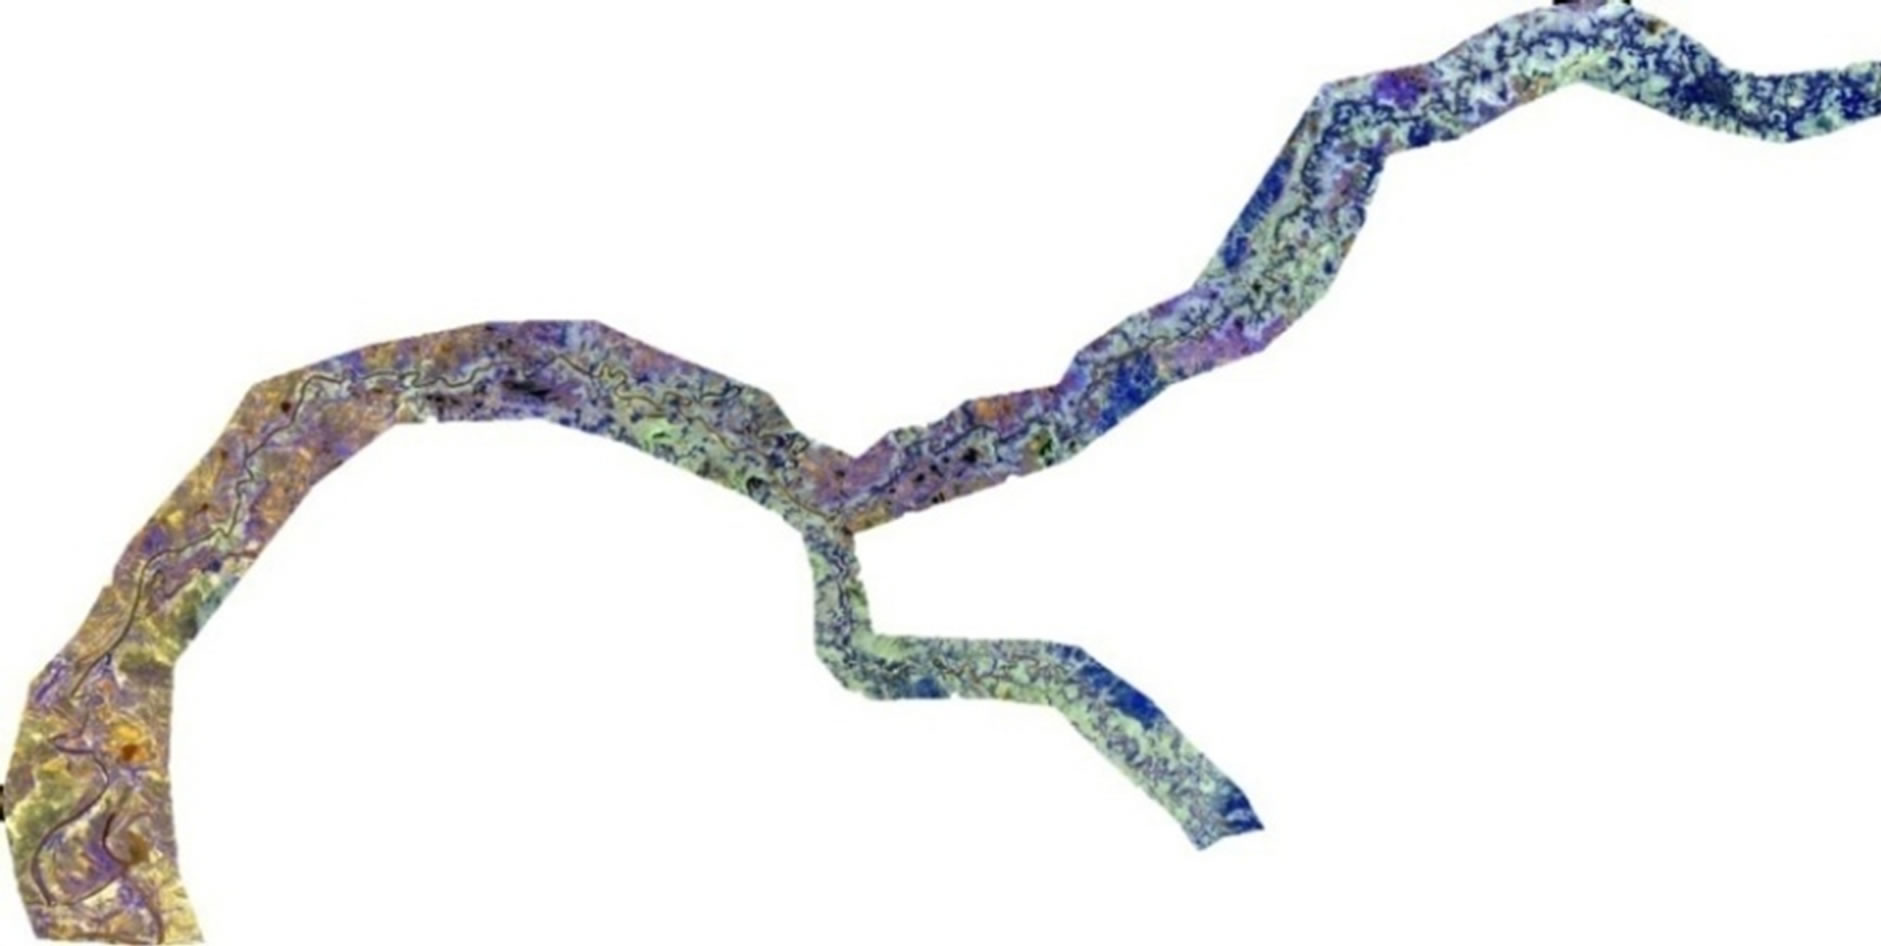
Figure 2. Landsat image of Manu River (1997).
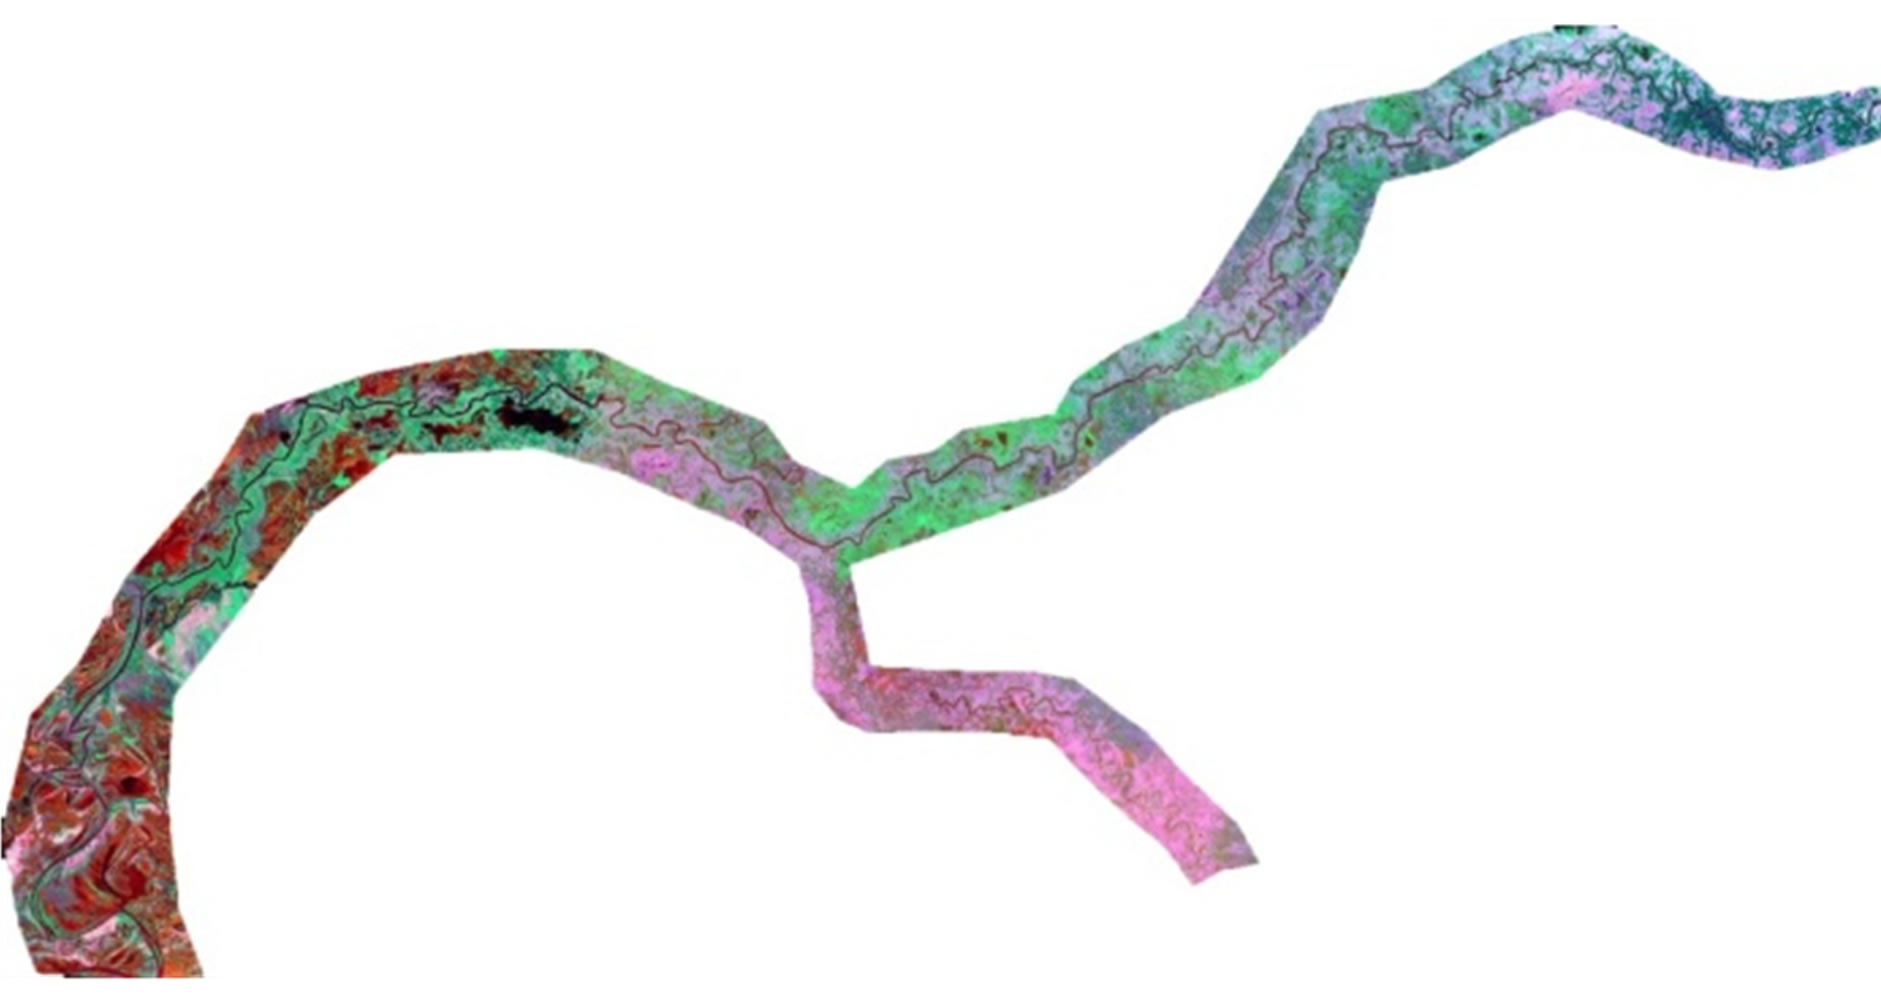
Figure 3. Landsat image of Manu River (2006).

Figure 4. Landsat image of Manu River (2010).
in different year. The wavelength varies from 550 m to 1850 m. Bend-4 at Brahman Bazar has the minimum wavelength and bend-9 at India Border has the maximum wavelength. It is remarkable that at bend-1 (Manumukh), bend-7 (Shamshernagar), bend-8 (India Border) and bend-9 (India Border) the wavelength has increased over time from 1997 to 2006 and then reduced again in 2010.
4.4. Sinuosity
The sinuosity of the bend-6 (Shamshernagar) was higher than any other bends and varied from 2.39 to 2.48 in Figure 8. On the other hand, sinuosity of bend-1, Manumukh was found lower than others bend and varied from 1.38 to 1.36. At bend-4 and bend-8 the sinuosity was increased with the year while at bend-2, bend-3, bend-5, bend-7 and bend-10 it decreased.
4.5. Meander Width
It is the distance between the outer edges of clockwise and anti-clockwise loops of the meander. From Figure 9, it has been evaluated the maximum width was 1419.43m at bend-9 (India Border) in 2006 and minimum width was 408.52 m at bend-3 (Rajnagar) in 2006.
4.6. Meander Length
It is the axial length of one meander, i.e. the tangential distance between the corresponding points of a meander. It has shown in the Figure 10 that, the maximum length was 2004.6 m at bend-9 (India Border) in 2006 and minimum length was 485.8m on bend-3 (Rajnagar) in 1997. Consequently, it was also observed that, there was no significant change at bend-2 (Rajnagar), bend-4 (Brahman Bazar), bend-5 (Munshi Bazar), bend-6 (Shamshernagar), bend-7 (Shamshernagar) and bend-10 (India Border).

Figure 5. Variation of width of the river.

Figure 6. Variation of radius of curvature.

Figure 7. Variation of meander wavelength.

Figure 8. Changes in sinuosity.
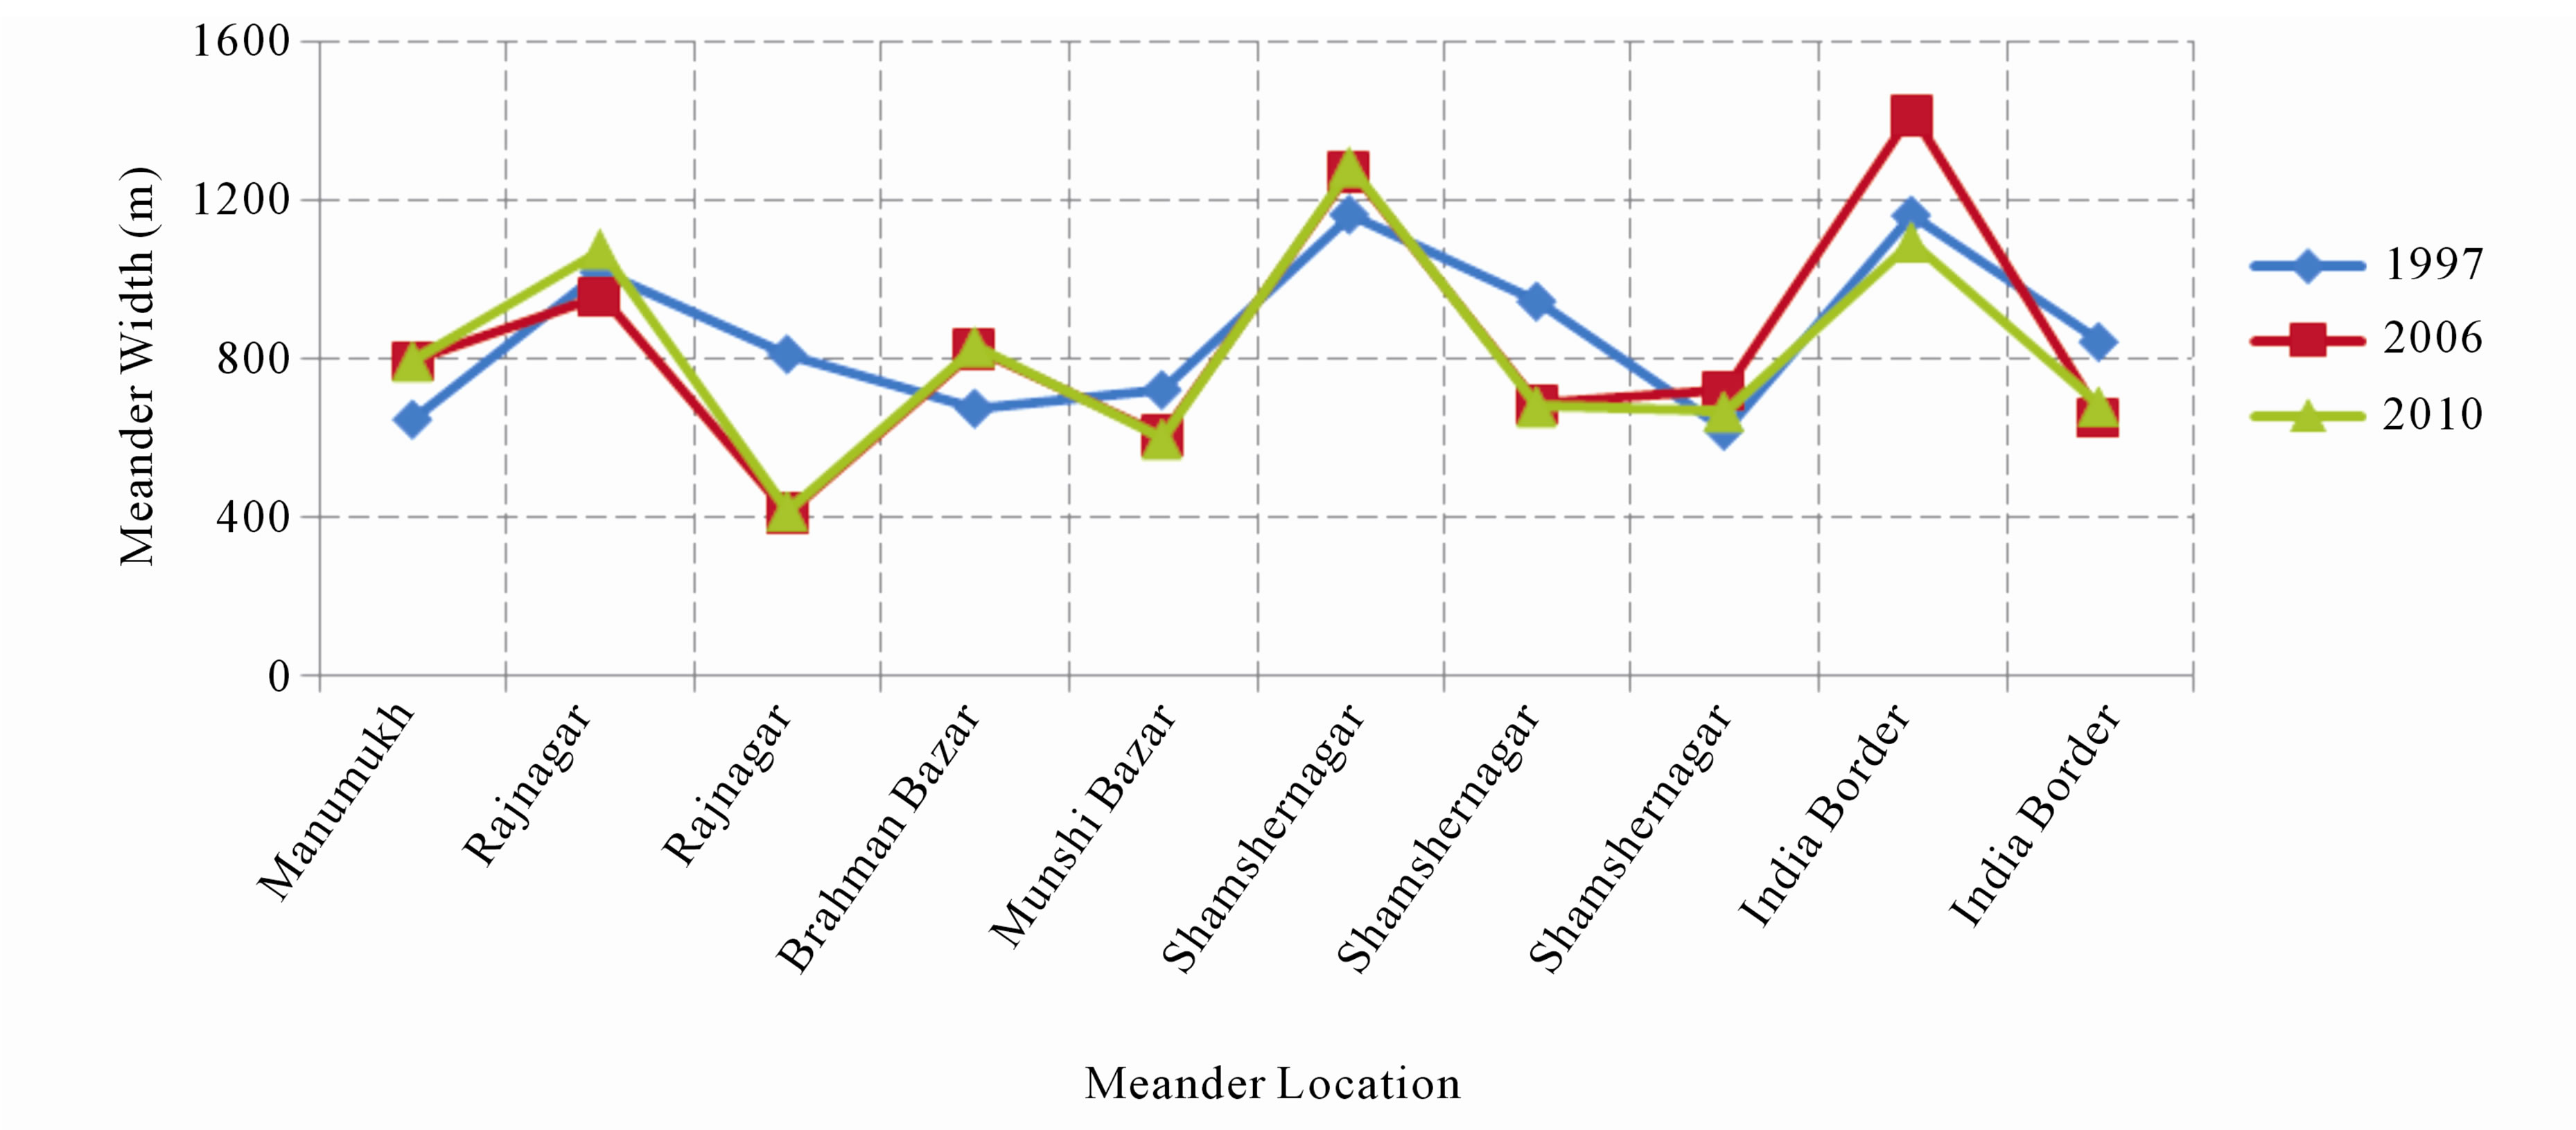
Figure 9. Variation of meander width with time.
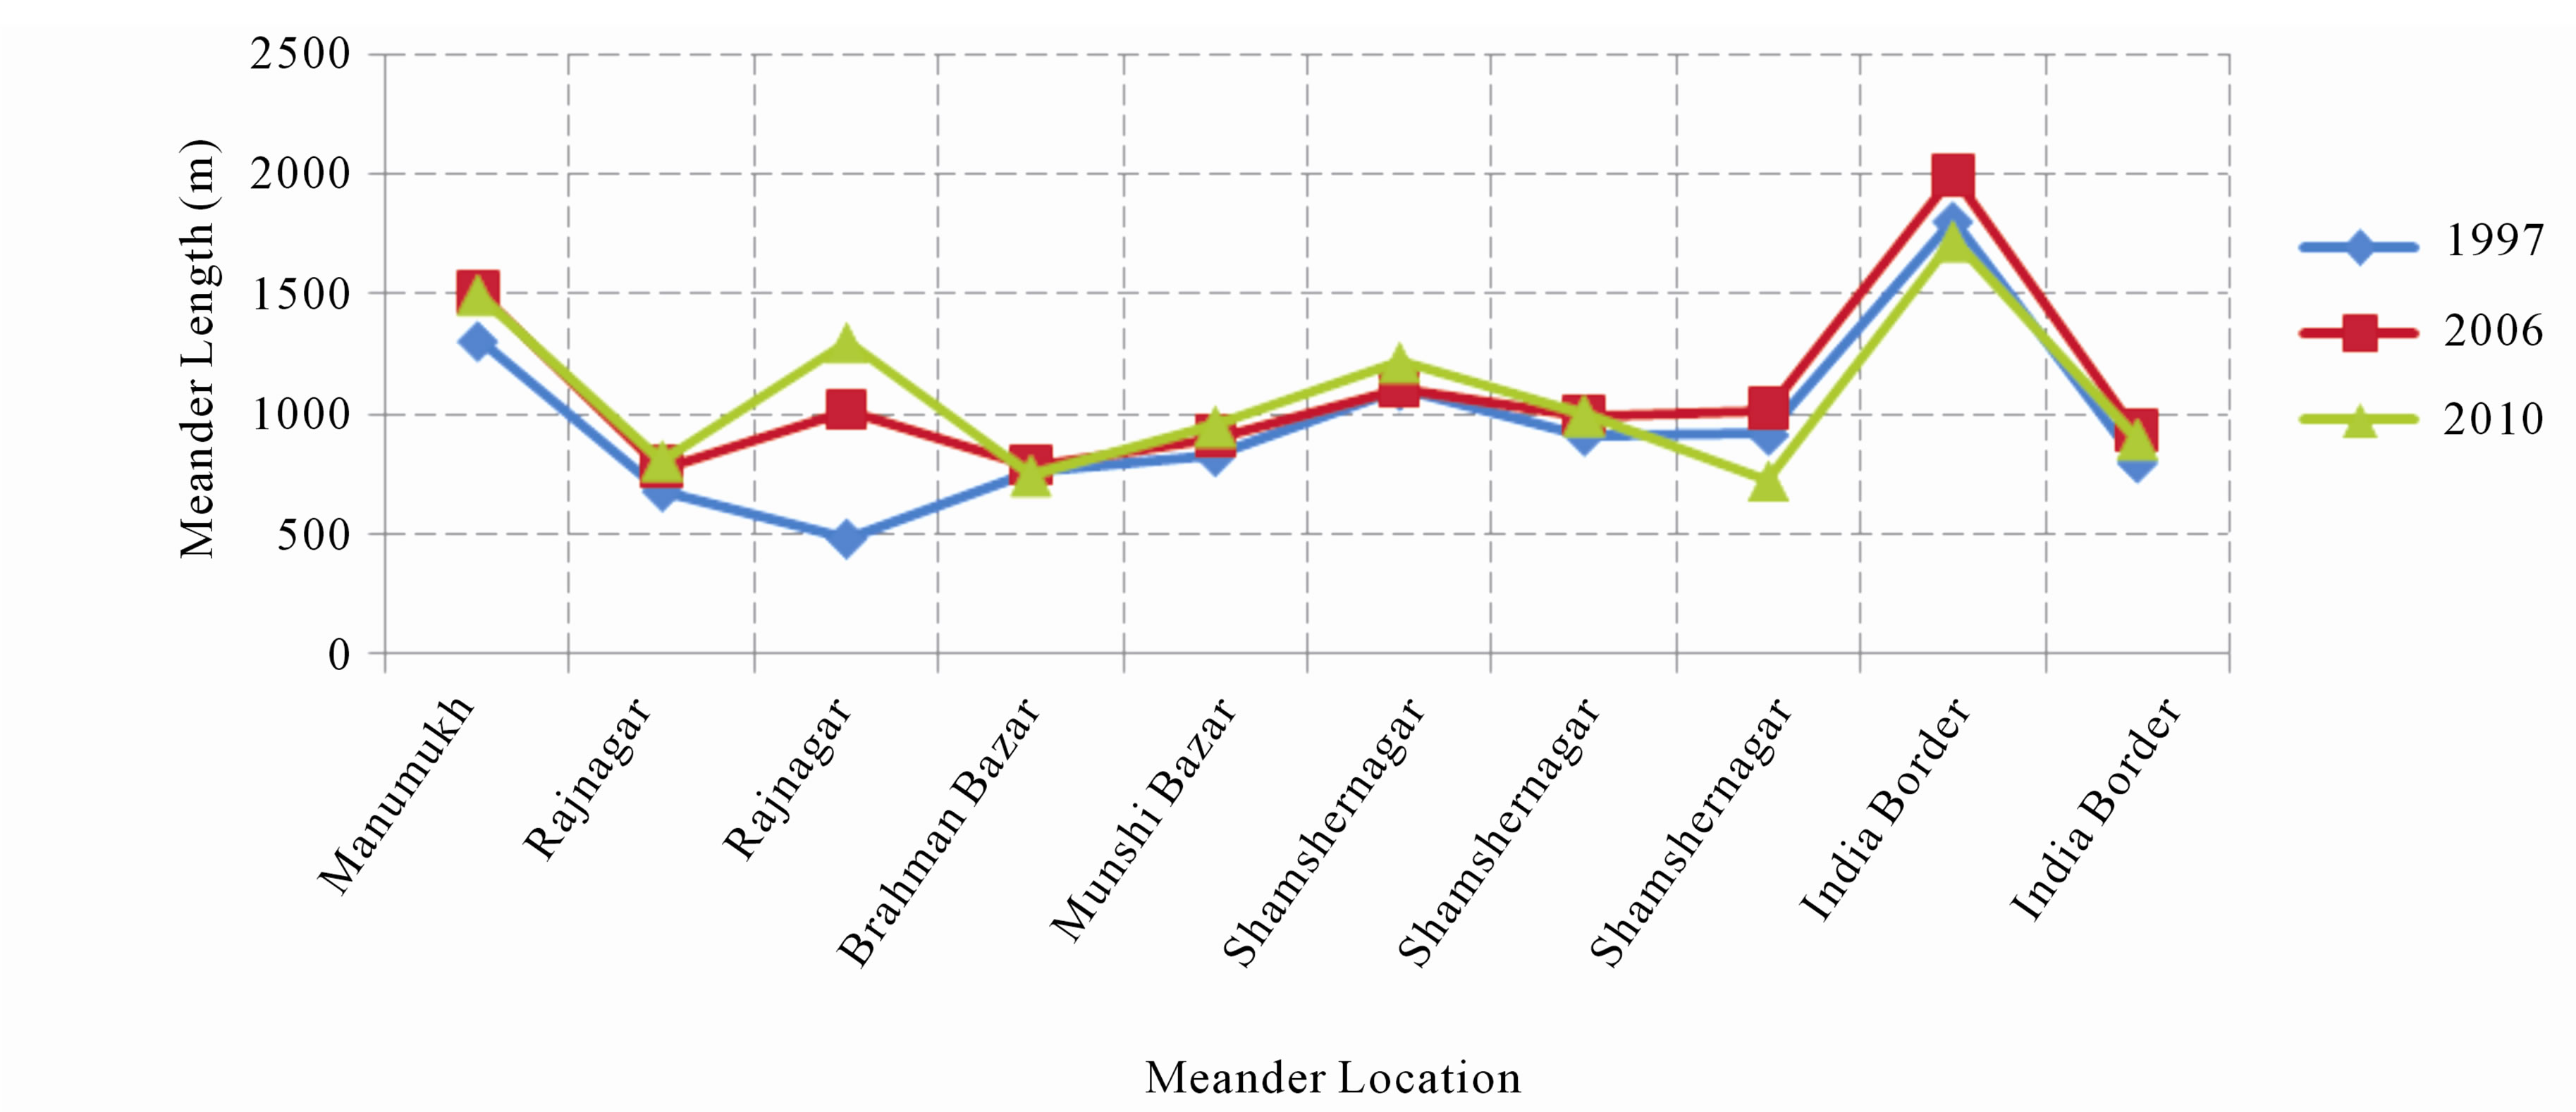
Figure 10. Variation of meander length with time.

Figure 11. Variation in meander ratio.

Figure 12. Bend migration types (G. J. Klaassen and G. Masselink, 1992).
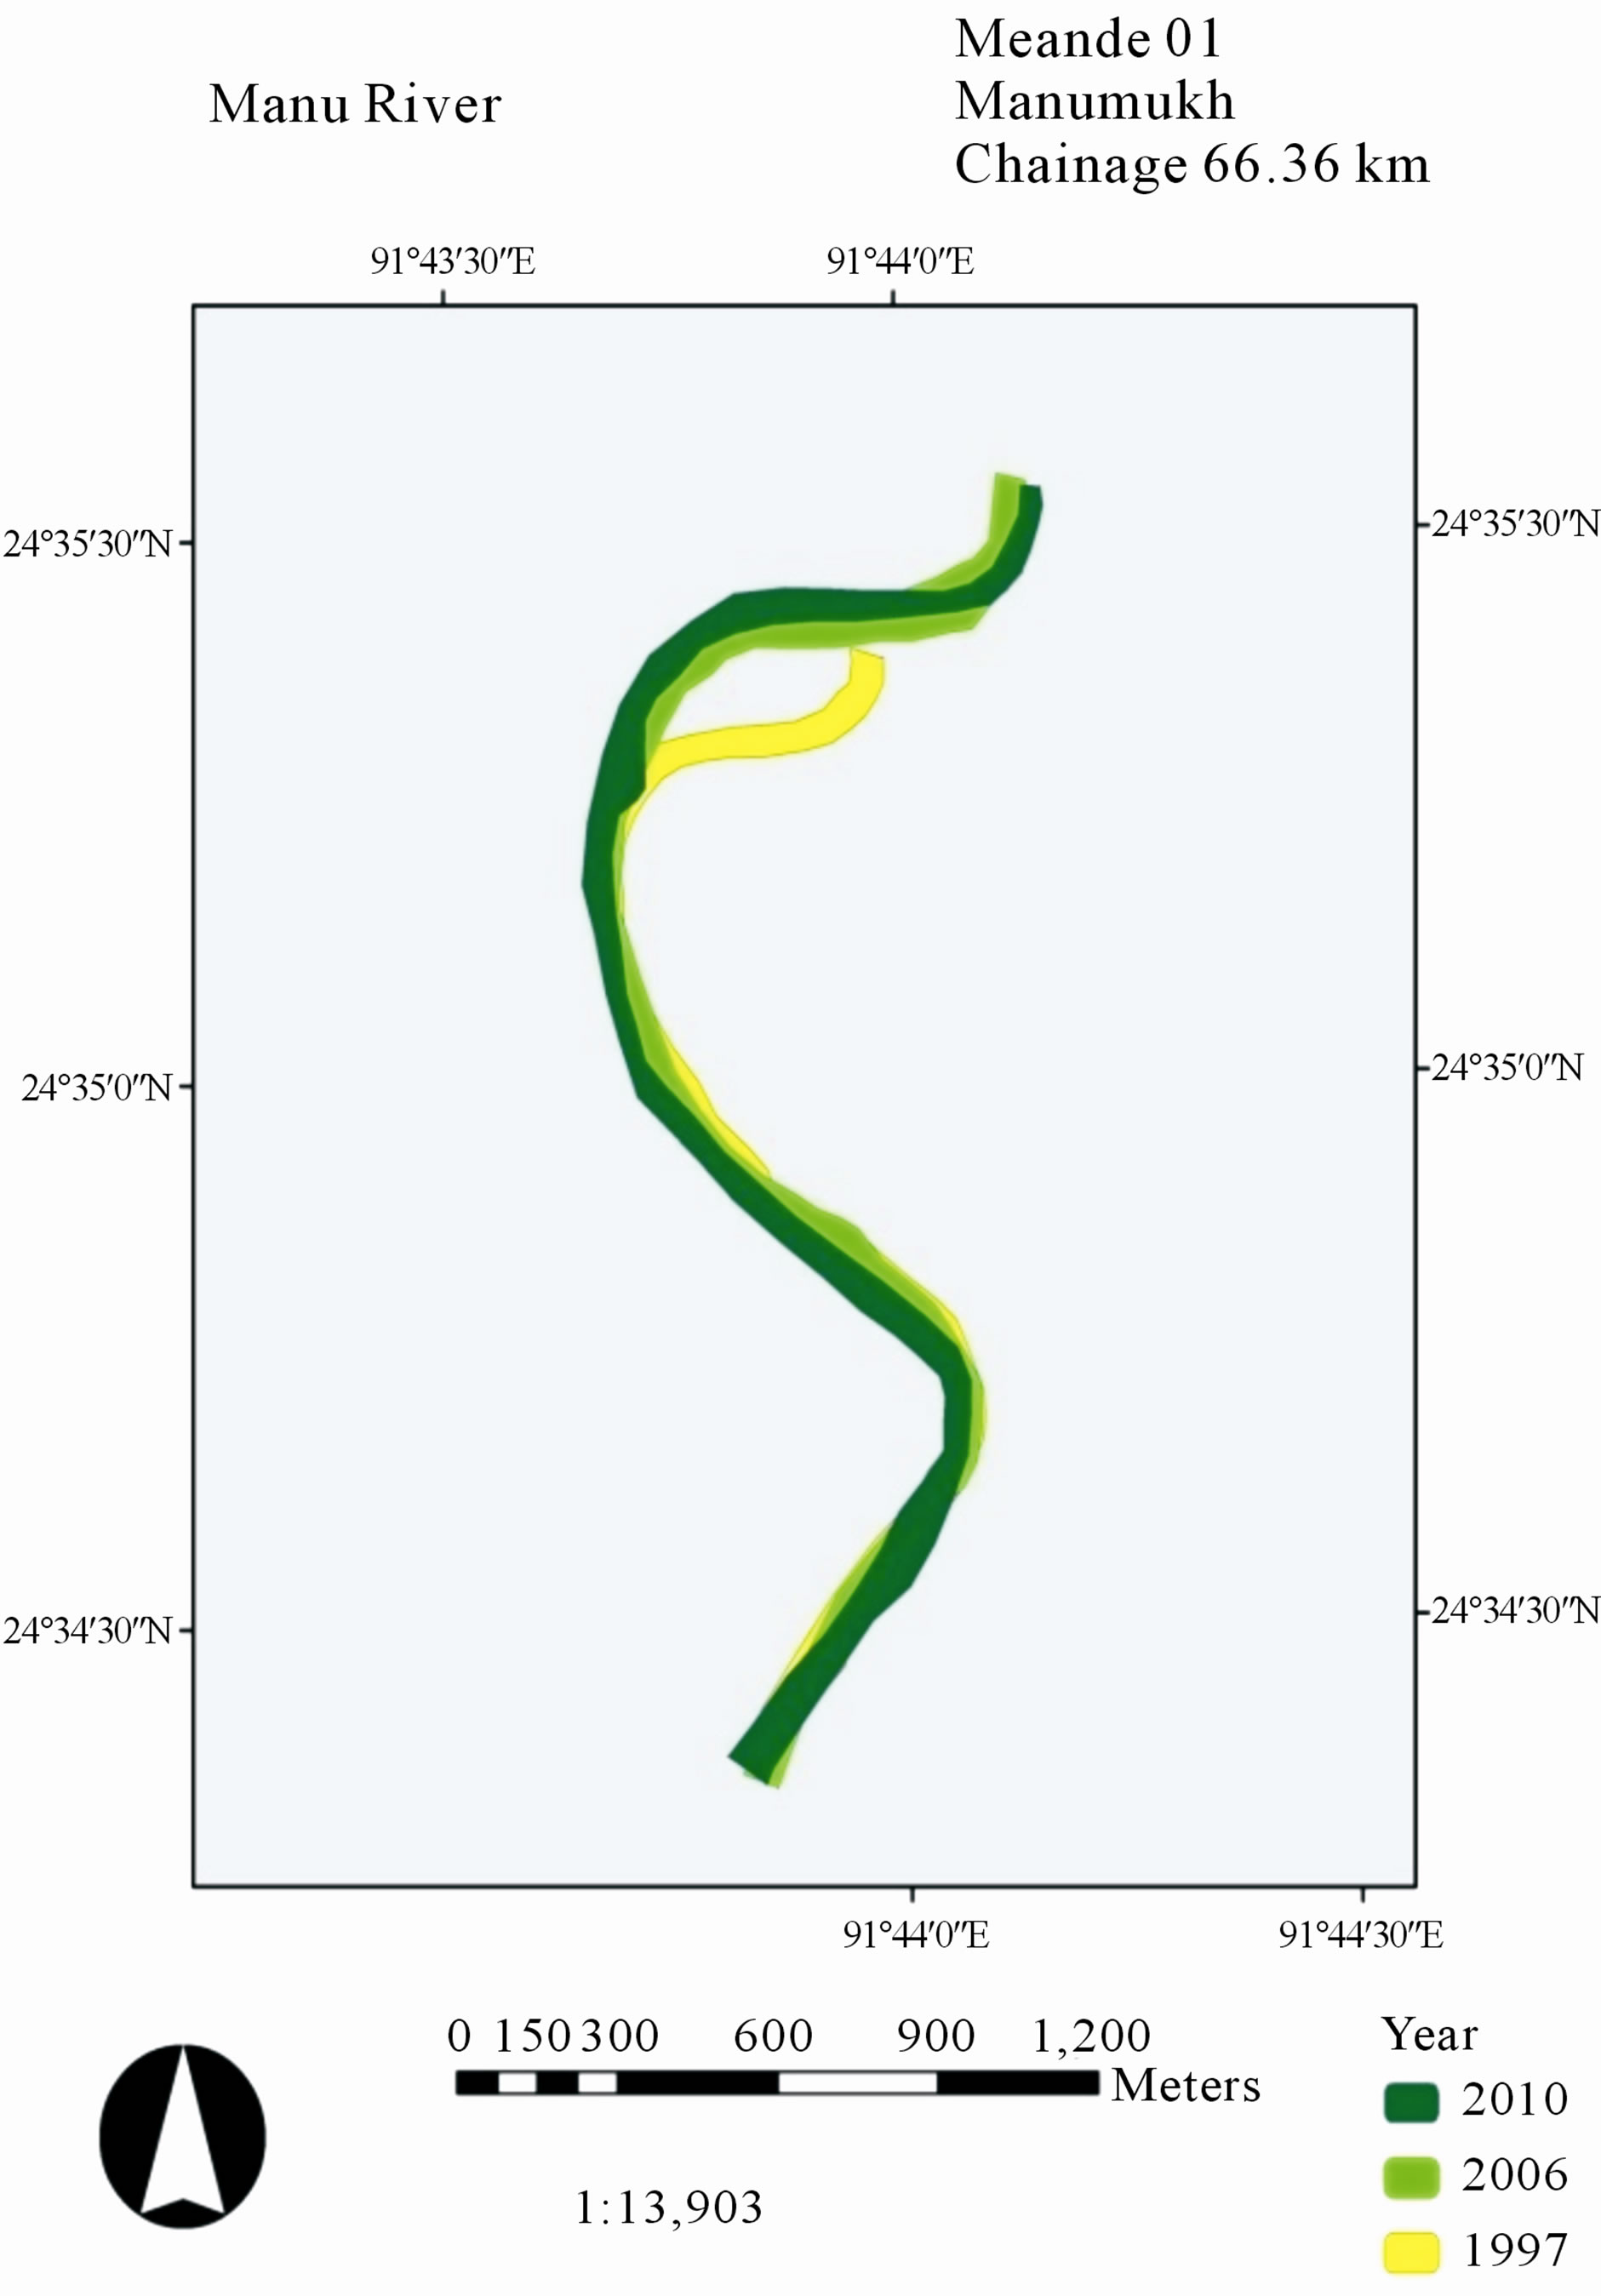
Figure 13. Bend 01 at Manumukh.
4.7. Meander Ratio
Figure 11 shows that in bend-1 (Manumukh), bend-6 (Shamshernagar) and bend-9 (India Border), the meandering ratio remained nearly the same. The maximum

Figure 14. Bend 02 at Rajnagar.
ratio was 1.67 at bend-3 (Rajnagar) in 1997 and minimum ratio was 0.32, also observed in this bend in 2010. It has been evaluated that, there was a sudden increase in bend-4 (Brahman Bazar) and bend-8 (Shamshernagar). Decrease was found in bend-3 (Rajnagar), bend-5 (Mun-

Figure 15. Bend 03 at Rajnagar.
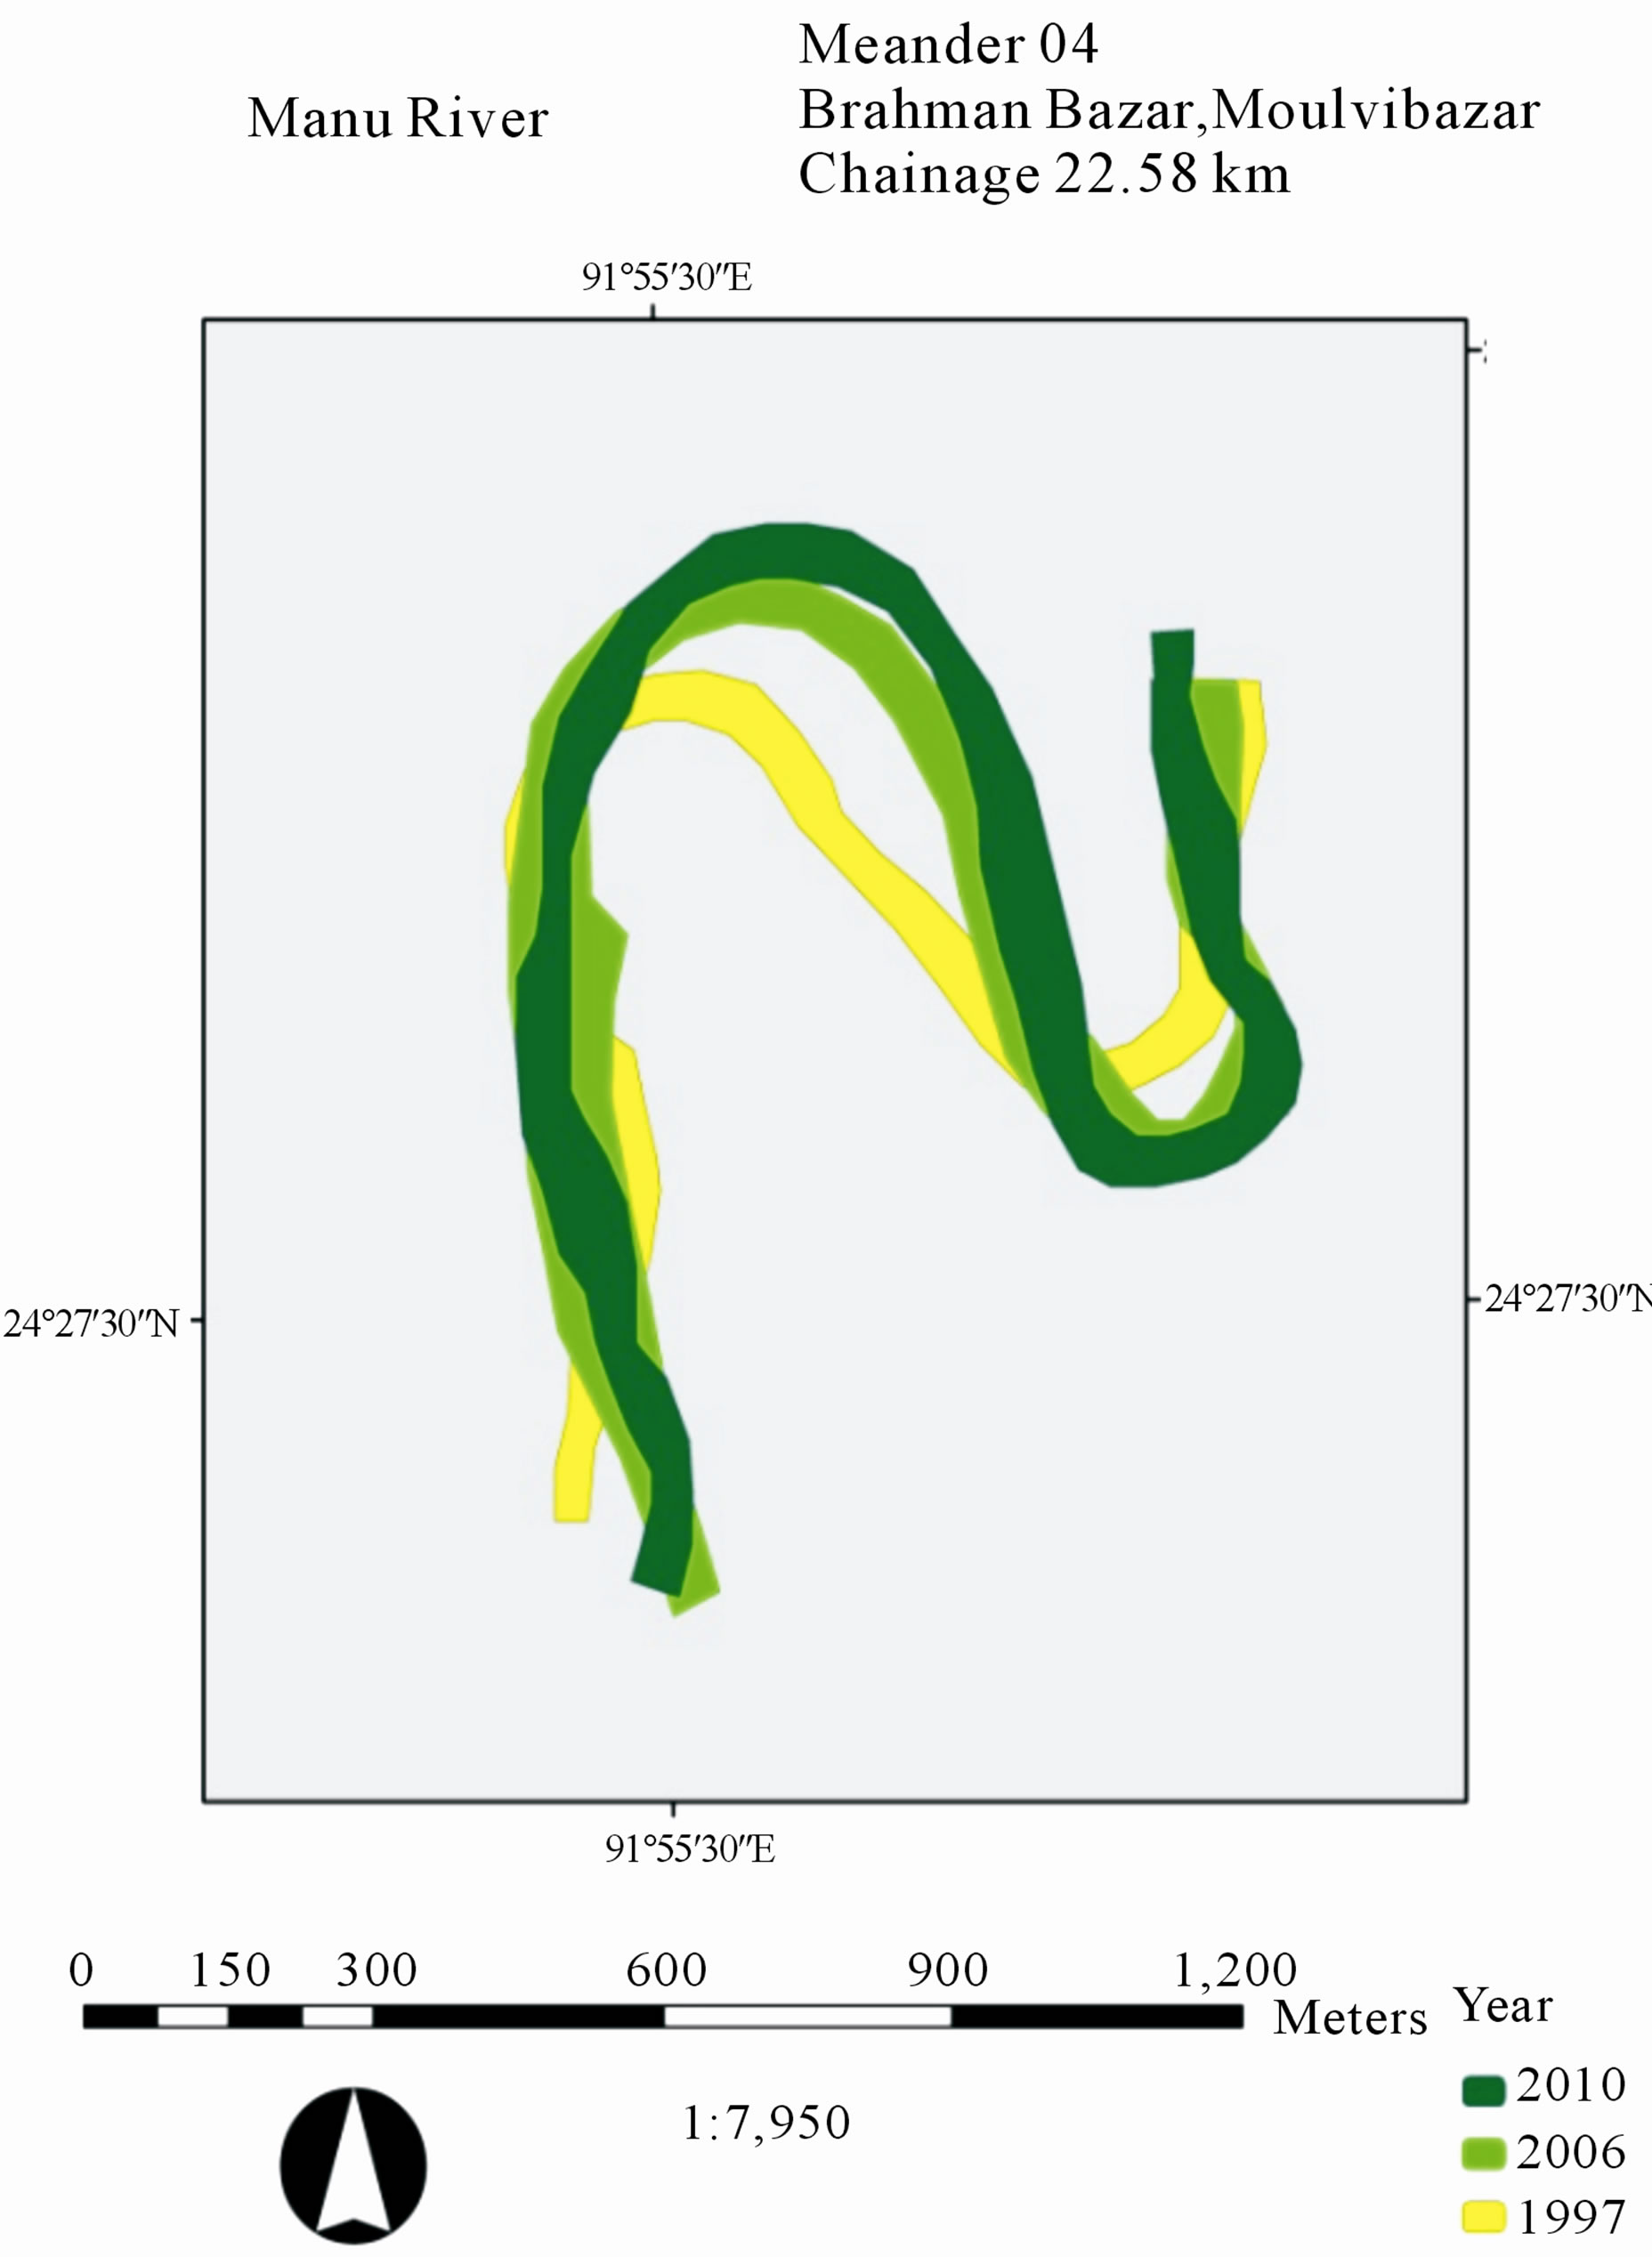
Figure 16. Bend 04 at Brahman Bazar.

Figure 17. Bend 05 at Munshi Bazar.
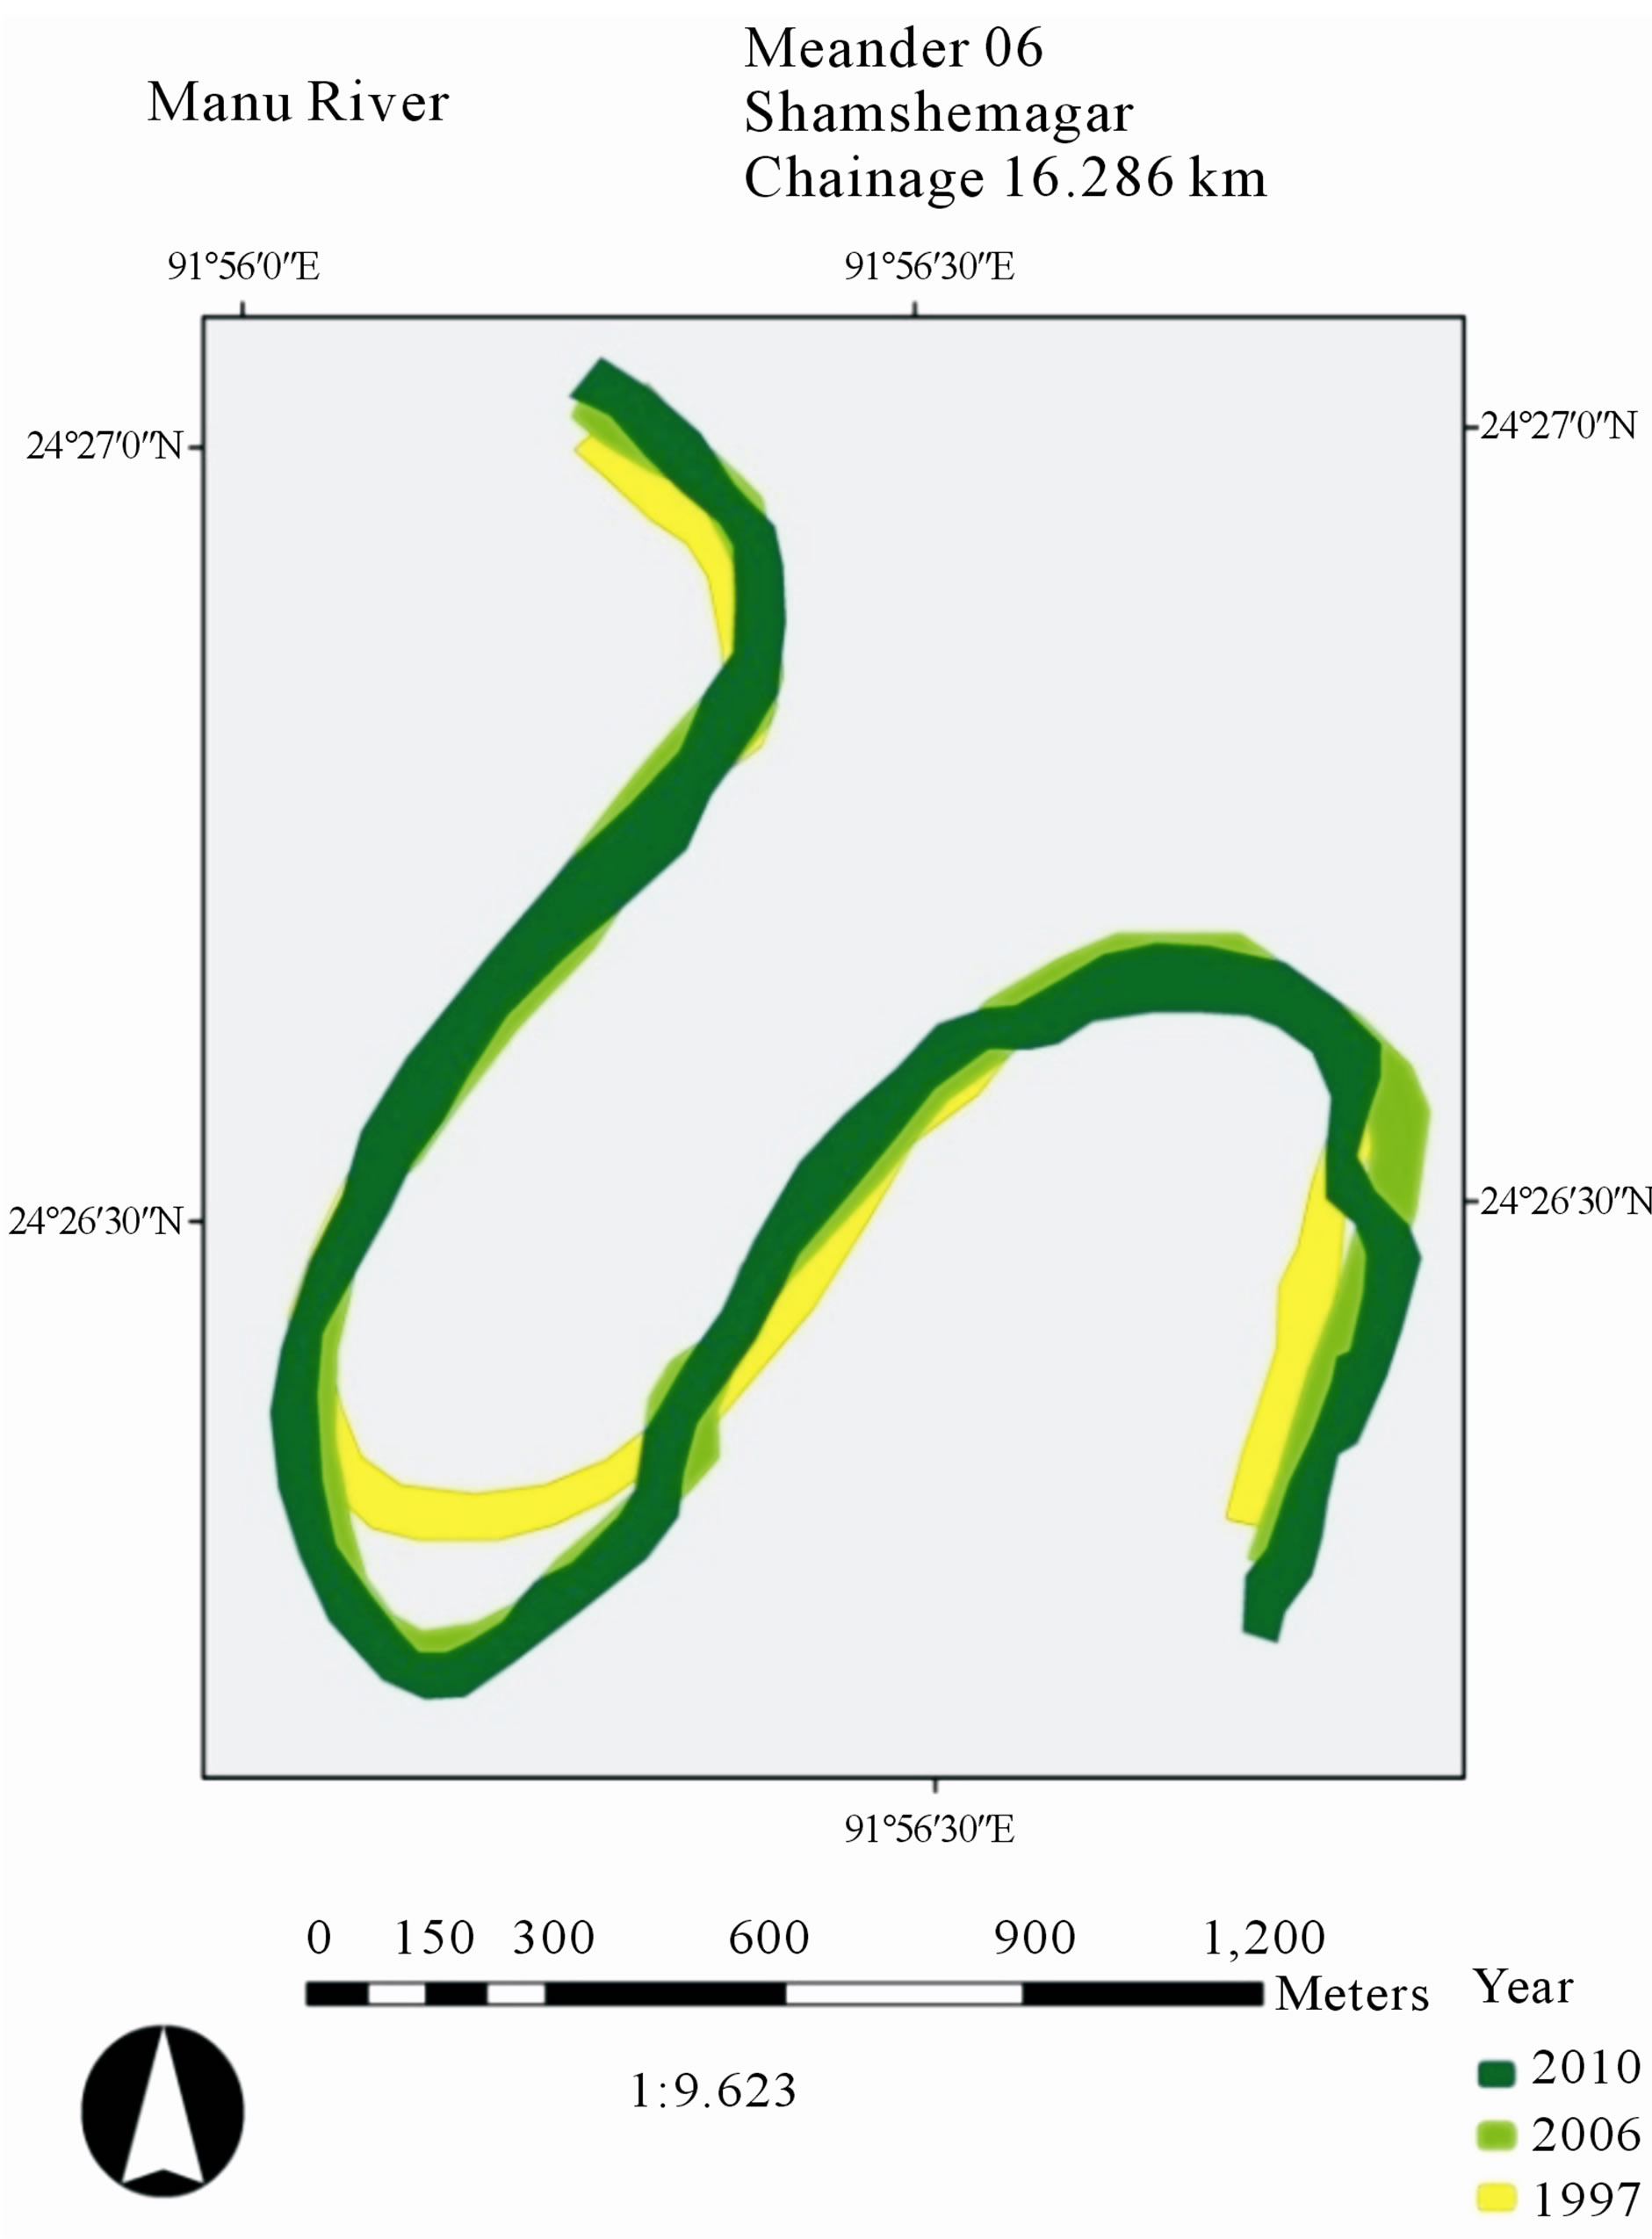
Figure 18. Bend 06 at Shamshernagar.

Figure 19. Bend 07 at Shamshernagar.

Figure 20. Bend 08 at Shamshernagar.

Figure 21. Bend 09 at India Border.

Figure 22. Bend 10 at India Border.
shi Bazar) and bend-7 (Shamshernagar). It is remarkable that at bend-2 (Rajnagar), and bend-10 (India Border), the ratio has decreased in 2006 and then increased again in 2010.
4.8. Bend Migration
To reveal how meander bends of Manu River migrated through time, satellite images of 1997, 2006 and 2010 were inspected. As we can see from figure 12, bends migrated by following expansion, extension, rotation, translation and combination process. The bend migration was determined by comparing the images of different years. From the analysis it seemed that at bend-3 (Rajnagar) the meander diminished forming an oxbow lake. Small expansions have been found in bend-1 (Manumukh) and in bend-9 (India Border). Translation with the time was evaluated in bend-2 (Rajnagar), bend-4 (Brahman Bazar) and in bend-8 (Shamshernagar). It is extended in bend-6 (shamshernagar) and rotated in bend-5 (Munshibazar) & bend-10 (India border). Combination of translation and rotation has also occurred in bend-7 (shamshernagar).
Ÿ 5. Conclusions
Ÿ From the analysis it was observed that the Manu River within the study reach is predominantly irregular meandering channels. The Manu River was found sinuous in the upstream side and less sinuous in downstream side within the study period during 1997-2010.
Ÿ It was found that the bends of Manu River was migrated inward or outward for the period during 1997- 2010. All types of bend migration (extension, rotation and translation) were observed to occur.
Ÿ Formation of oxbow lake was also found on some bends in Manu River during the study.
Ÿ From the field survey of river in Moulvibazar using GPS machine it was observed that the image data varies to a small extent with the field data. The width of the rivers in Moulvibazar found from the image of 2010 was 86 m. While, from ground survey on the same location we have found the river width is 90 m.
Ÿ Sinuosity of the Manu River was greater than 1.5 at most of the time which indicates the river highly sinuous [5]. Sinuosity of bends of the river Manu varied from 1.36 to 2.48.
REFERENCES
- D. Z. Seker, S. Kaya and N. Musaoglu, “Investigation of Meandering in Filyos River by Means of Satellite Sensor Data,” Hydrologic Processes, Vol. 19, No. 7, 2004, pp. 1497-1508.
- H. H. Stolum, “River Meandering as a Self-Organization Process,” Science, Vol. 271, No. 5256, 1996, pp. 1710- 1713. doi:10.1126/science.271.5256.1710
- Tajmunnahar, “Investigation of Morphological Changes in a Part of Kushiyara and Manu River Using Remote Sensing & Geographic Information System,” CEE, SUST, Bangladesh, 2003.
- S. K. Garg, “Irrigation Engineering and Hydraulic Structures,” 9th Edition, Khanna Publishers, Delhi, 1991.
- S. A. Akhand, “Identification of Morphological Change of Ganges and Padma River Using Remote Sensing & Geographic Information System,” WRE, BUET, Bangladesh, 2008.