Engineering
Vol. 5 No. 9 (2013) , Article ID: 36382 , 9 pages DOI:10.4236/eng.2013.59088
Enhanced Mass Transfer in Microbubble Driven Airlift Bioreactor for Microalgal Culture
1Department of Chemical and Biological Engineering, University of Sheffield, Sheffield, UK
2Department of Molecular Biology and Biotechnology, University of Sheffield, Sheffield, UK
Email: *cpp09ky@sheffield.ac.uk
Copyright © 2013 Kezhen Ying et al. This is an open access article distributed under the Creative Commons Attribution License, which permits unrestricted use, distribution, and reproduction in any medium, provided the original work is properly cited.
Received June 6, 2013; revised July 6, 2013; accepted July 13, 2013
Keywords: Microbubbles; KLa; CO2 Capture; Algal Culture
ABSTRACT
In this study, the effect of microfluidic microbubbles on overall gas-liquid mass transfer (CO2 dissolution and O2 removal) was investigated under five different flow rates. The effect of different liquid substrate on CO2 mass transfer properties was also tested. The results showed that the KLa can be enhanced by either increasing the dosing flowrate or reducing the bubble size; however, increasing the flow rate to achieve a higher KLa would ultimately lower the CO2 capture efficiency. In order to achieve both higher CO2 mass transfer rate and capture efficiency, reducing bubble size (e.g. using microbubbles) has been proved more promising than increasing flow rate. Microbubble dosing with 5% CO2 gas showed improved KLa by 30% - 100% across different flow rates, compared to fine-bubble dosing. In the real algal culture medium, there appears to be two distinct stages in terms of KLa, divided by the pH of 8.4.
1. Introduction
The cultivation of microalgae has been studied and developed for more than 40 years [1]. Two of the major limiting factors for microalgal culture are light and CO2 as they are the key participants for the “light reactions” and “dark reactions” in photosynthesis, respectively. Many researches have been carried out to study the impact of light on algal growth. Technical issues associated with light have been also well studied especially for photobioreactos, with various solutions (e.g. using an optimal mixing rate and light/dark ratio, combining artificial light with natural light, and increasing harvest frequency etc.) [2]. As regards to CO2 supply, in most microalgae cultures, CO2 is usually injected into the culture through bubbling CO2 enriched air into porous diffusers, which promises a gas transfer efficiency of 13% - 20% [3]. Additional supply of CO2 contributes many benefits to the culture. First of all, the supply of CO2 can lead to enhanced algal metabolisms, and on the other hand, it can act as buffer solution to neutralize the increased pH caused by algal growth. Secondly, supply of CO2 enhances the internal mixing of bioreactor, helping to evenly distribute nutrients and the exposure time of algal cells to light. Furthermore, accumulation of O2 in culture medium is toxic to microalgal cells and it is one of the major limiting factors for scale up of the bioreactor [4]. Introducing CO2 into culture also helps to strip accumulated oxygen and hence prevents algal cells from toxicity [5]. According to the relationship between partial pressure and Gibbs free energy (Equation (1)), it is found that the increase in the partial pressure of reactants (e.g. CO2) or the reduction of partial pressure in the products (e.g. O2) results in the value of Gibbs free energy becoming negative. Hence the reaction becomes thermodynamically favourable and moves towards to the formation of more products [6]. Such feature of performance is widely utilized for many bioprocesses to achieve a higher productivity [2,5]. Therefore by increasing the concentration of dissolved CO2 whilist reducing the accumulated O2 level can be considered as an approach towards improving productivity.
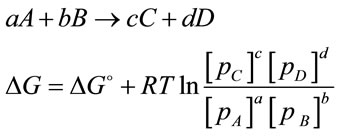 (1)
(1)
However, most existing CO2 supply techniques are relatively inefficient. Due to low interfacial surface area between gas bubbles and culture medium, the gas-liquid mass transfer is poor, which associated with CO2 loss to atmosphere [7]. Besides, additional CO2 supply increases the operational cost, which can not be balanced eventually by the algal yields enhancement due to the low CO2 mass transfer. Improving the CO2 supply efficiency and consequently enhancing the algal productivity has become a major challenge over the years. Design of bioreactor with low energy cost and particularly high gas mass transfer for both CO2 dissolution and O2 removal is hence a major consideration for cost-competitive microalgae culture.
Due to the enhanced gas-liquid mass transfer efficiency and liquid circulation etc., airlift bioreactors (ALB) are increasingly employed for microalgae culture. Many researches have been carried out on the performance of different ALBs; however, these studies were carried out all based on conventional gas supply system. There are few studies on the effects of microbubbles on ALB performance, because normally the microbubble generation systems, for instance DAF, electro-flotation, electrostatic spraying, and mechanical agitation etc, were not profitable to be applied into most bio-processes due to their high energy cost [8-12]. Recently, an innovative microbubble generation system (fluidic oscillator) with lower power consumption has been invented by Zimmerman et al. [13,14] with the benefits of energy saving and improved efficiency. The detailed information on fluidic oscillator and its microbubble generation mechanism were described in previous studies [13-15]. This study aims to investigate the effect of microbubbbles (generated by fluidic oscillator) on mass transfer under different aeration flow rates. In addition, the impact of different liquid substrate (e.g. NaHCO3 medium and algae medium) on CO2 mass transfer properties is investigated.
2. Materials and Methods
2.1. Materials
A 7L-airlift loop bioreactor based on classic ALB geometry designs [16], as shown in Figure 1 (left), was used to study the mass transfer properties of microbubbles and fine-bubbles. Besides, a smaller version (3L) of ALB, based on the similar geometry design, was applied to study the impact of different liquids on mass transfer, shown in Figure 1 (right).
2.2. Experimental Procedure
To study the mass transfer properties of microbubbles and fine-bubbles, the two inlet ports of diffusers at the bottom of bioreactor were connected to gas cylinder by PVC tubes, through a fluidic oscillator or a Y-junction.
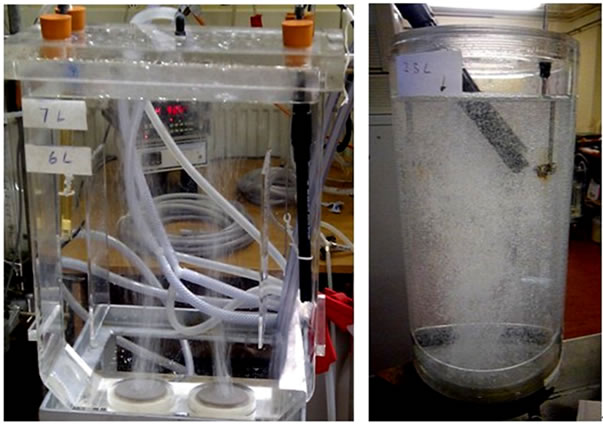
The 7 L-airlift bioreactor is made of transparent acrylic material with the dimension of 26 cm × 10 cm × 30 cm. Inside the bioreactor, two ceramic diffusers (d = 5 cm, h = 1 cm), with the pore size of 20 microns, are fixed at the bottom. Two draught baffles are suspended 3.5 cm above these diffusers, dividing the middle chamber into 3 regions which work as risers and downcomers. A static liquid height of 15 cm was employed to give the volume of 7 L. There are several holes drilled on the lid to allow pH and DO probes insert into the reactor. The 3Lairlift bioreactor is also made of acrylic material, with the dimension of 285 mm in height and 124 mm in diameter. The air lift loop design consists of a ceramic diffuser (diameter of 78 mm and pore size of 20 microns) fixed at bottom and an internal draught tube (H: 170 mm, D: 95 mm) hanged 30 mm above the diffuser.
Figure 1. 7L (left) and 3L (right)—lab scale airlift loop bioreactors (ALB).
The detailed connections for main experiments (with oscillator) and control experiments (without oscillator) are illustrated in Figure 2. A pH and DO probe (Mettler Toledo, UK) were inserted into the bioreactor via the holes on the lid. These holes were blocked by rubber bungs to prevent gas leakage. The outlet nozzle on the lid was connected to a flow meter to measure the outlet flowrate which is equal to the real inlet flowrate. For each set of experiment, 7L distilled water with the temperature 25˚C ± 1˚C were employed. Mixture gas containing 5% CO2 and 95% N2 was injected into bioreactor under certain flow rate. Five different flow rates were tested. The flow rate was measured by a flow meter which was connected to the outlet port of the bioreactor. The changes in pH and DO were monitored by pH meter and DO meter respectively. Data was recorded every 30 seconds until pH and DO readings were stable. The effect of different liquids on mass transfer was studied in the 3L-ALB with the same setup as shown in Figure 2. The mass transfer for CO2 dissolution was tested in the distilled water containing certain concentration of NaHCO3 and also in the real algal culture medium (containing algae). 7 different concentrations of NaHCO3 were tested. The algae (Dunaliella salina) used in this study was 7 days old. During the mass transfer test, 5% CO2 and 95% N2 was injected into D. Salina culture under a fixed dosing flow rate (0.7L/min), with DO and pH recorded every 30 seconds. The dissolved CO2 concentration was calculated based on Equation (2) (for water)

For microbubble dosing, the gas ejected from cylinder flowed into a fluidic oscillator, and was shot out from the two outlet terminals on oscillator. Here a flow rate of 80 L was required to drive the oscillator. Before such amount of gas injected into bioreactor, most of them were bled out via bleeding pipes with only less than 1% flowing into bioreactor, and the real inlet flow was measured by the flow meter at bioreactor output. For finebubble dosing, the area marked as red frame was placed with a Y-junction.
Figure 2. Connections for mass transfer test.
or Equation (3) (for NaHCO3 medium and algal medium) [17]. [Na+] in Equation (3) particularly means the concentration of Na+ obtained from NaHCO3. The method of mass transfer coefficient estimation was estimated as the slope of a semilog plot of 1/(1-E) versus T, which was explained in details in Chisti (1989) [16].
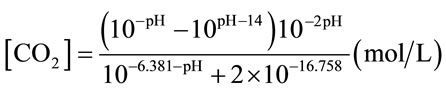 (2)
(2)
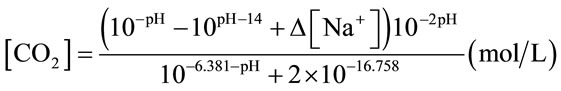 (3)
(3)
3. Results and Discussions
3.1. Mass Transfer for Microbubble Driven and Fine-Bubble Driven Reactor
The effects of microbubble dosing on mass transfer for CO2 dissolution and O2 removal were examined by dosing 5% CO2 mix-gas (balanced with 95% N2) into bioreactor (containing 7L distilled water) under 5 different bubbling flow rates, along with the control experiment (without fluidic oscillator, fine bubble dosing). The mass transfer coefficient KLa for CO2 dissolution and O2 removal under each bubbling condition were plotted in Figure 3. From Figure 3, generally KLa for either CO2 dissolution or O2 stripping increases along with gas dosing flow rate. For KLa, KL mainly depends on the gasliquid properties (e.g. density, viscosity, diffusivity and temperature etc.), and therefore is usually considered as a constant for the fixed circumstance [16]. Chisti expressed the interfacial area “a” as a function of gas holdup (ε) and bubble diameter (dB) [16], shown as:
 (4)
(4)
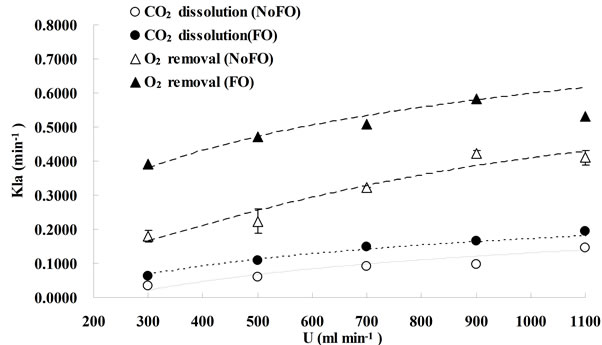
FO means “with fluidic oscillator”, representing microbubble (300 - 400 μm) dosing while NoFO stands for “without fluidic oscillator”, representing fine bubble (500 - 600 μm) dosing. Due to the lab limitations, the error bars shown in this figure was obtained from the duplication of fine bubble dosing under each flow rate (for O2 removal, NoFO).
Figure 3. Mass transfer coefficients under different dosing conditions.
For the same bubbling system (either microbubble dosing or fine bubble dosing), the bubble size can be considered as the same for different gas dosing flowrates, while the gas holdup usually increases with the bubbling flowrate, therefore, KLa was enhanced by increasing the flowrate as the total interfacial area was amplified.
As regard the comparison of mass transfer coefficients (either for CO2 dissolution or O2 removal) between microbubble dosing (FO) and fine bubble dosing (NoFO), microbubbles had a higher mass transfer coefficient under each dosing flowrate. For CO2 dissolution, the highest KLa under fine bubble dosing (0.14 min−1) was achieved at dosing flow rate of 1.1 L×min−1, while almost the same KLa value (0.15 min−1) was achieved by microbubble dosing at 0.7 L∙min−1. Similarly, for O2 removal the highest KLa (0.41 min−1) was obtained at 1.1 L∙min−1 by fine bubble dosing, which however can be achieved at only 0.3 L×min−1. The potential for energy saving, especially for large scale processes, is therefore straight forward to argue. For example, in order to dissolve more CO2 and strip off O2 accumulated in algal bioreactor, it would typically require dosing certain percentage of CO2 mixture gas at a relatively high aeration rate to achieve a desired mass transfer coefficient. But actually, under very high flow rate, most of the gas is wasted. And an intensive agitation caused by high flow rate may damage the algal cells. However, by using oscillator (microbubble dosing) the desired KLa can be obtained even at relatively low flow rate. It considerably saves gas usage and also the electricity cost.
In conclusion, for the same bubble generation method (the changes in bubble sizes are considered to be negligible across a wide range of dosing flow rate), enhancing the gas dosing flowrate (which means enhancing the gas hold up for the same liquid volume) can increase the mass transfer coefficient. For the same bubbling flowrate, reducing the bubble size can lead to an improvement on KLa as well. In another word, KLa can be enhanced by either increasing the dosing flowrate (to be more accurate, flowrate/liquid volume ratio) or reducing the bubble size.
3.2. The Improvement of KLa by Using Fluidic Oscillator
When injecting CO2/N2 mixture gas into water, CO2 dissolution happens along with O2 stripping. The improvements by using fluidic oscillator (microbubbles) on mass transfer for CO2 dissolution and O2 stripping can be simply quantified as the percentage increase in  a and
a and  a, expressed in Equation (5) and Equation (6), respectively.
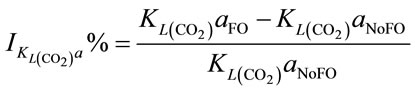 (5)
(5)
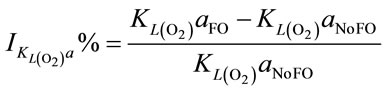 (6)
(6)
Either Equation (5) or Equation (6) can be turned into Equation (7) which indicates the percentage increase in KLa by using microbubble dosing should be the same for either CO2 dissolution or O2 removal under a fixed bubbling flowrate. The percentage improvement of KLa is therefore determined by the percentage difference of the total interfacial areas for a certain dosing flow rate. Combining Equation (7) and Equation (4), the percentage increase in KLa is correlated to bubble diameter (dB) and gas hold-up (ε), described by Equation (8).
 (7)
(7)
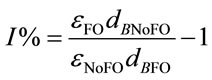 (8)
(8)
From Equation (8), the efficiency of KLa improvement (I%) therefore should be the same across different flow rates, assuming 1) the gas holdups are identical between microbubble dosing and fine bubble under the same flow rates, and 2) changing the flow rate dose not vary the average bubble size for either microbubbles or fine bubbles as long as the “bubble coalescence” does not happen. However, the experimental results are inconsistent with such speculation. Figure 4 shows the KLa percentage increase. In general, microbubble dosing enhances the KLa by 30% - 100% over a wide flow rate range, while the efficiency of the improvement decreases when increasing the flow rate. It is speculated that the microbubble size increases with the flow rate. The fluidic oscillator provides a periodical oscillating pulse to neck-off the bubbles attached to the diffuser orifice when they are still
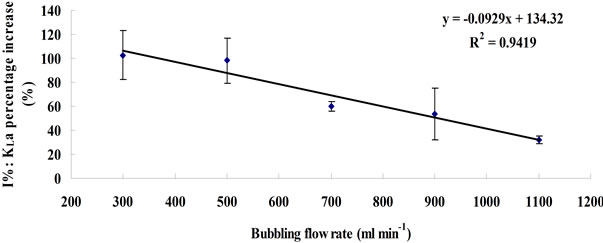
The value of I% under each flow rate was the average between the values calculated based on Equation (5) and Equation (6). The error bar represents the standard deviation between these two values.
Figure 4. Plots of KLa percentage increase versus dosing flow rate.
small. But for the same surface area of diffuser, increasing the flow rate may change the oscillating properties (e.g. the attenuation of “pulse force” due to the build up of boundary layer), and may also cause bubble coalescence, consequently weakening the efficiency of oscillator for mirobubble creation. Therefore, the microbubble size may slightly increase when the flow rate increases, resulting in a reduction of dBNoFO/dBFO ratio, which leads to the decline of KLa improvement efficiency (I%). This phenomenon also indicates a view that using fluidic oscillator to enhance mass transfer has its limitations in terms of flow rate (or to be more accurate, flow rate over liquid volume ratio).
3.3. The Relationship between Mass Transfer Coefficient and Overall Mass Transfer Rate
Knowing the mass transfer coefficient KLa helps to indicate the capability of mass transfer, while knowing the mass transfer rate gives a straight view of e.g. how rapidly the CO2 dissolve into liquid, which also helps to estimate the CO2 capture efficiency.
The instantaneous mass transfer rate (VMTR) is interpreted as the driving force multiplied by the mass transfer coefficient (KLa) [16], shown in Equation (9),
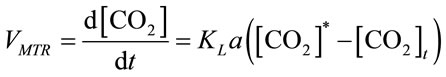 , (9)
, (9)
where KLa is the mass transfer coefficient (min−1), both [CO2]t and [CO2]* are instantaneous concentrations of CO2 and its equilibrium concentration (mol×L−1), respecttively. The average mass transfer rate  for a certain dosing time period (td) can be fairly represented as
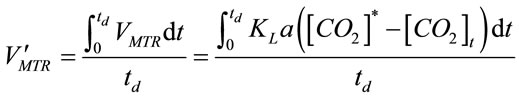 . (10)
Assuming
 , (11)
by solving Equation (10) and Equation (11), it gives:
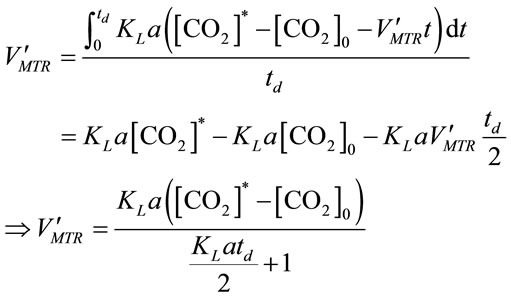 , (12)
where [CO2]0 represents the initial CO2 concentration (mol×L−1) for a selected time period.
The accuracy of Equation (12) was examined via Figure 5 which plots the experimental values of average mass transfer rates versus the calculated values by using Equation (12). Compared with examined values, most of the data calculated by Equation (12) showed only less than 10% difference.
3.4. CO2 Capture Efficiency for Microbubble Dosing and Fine-Bubble Dosing
CO2 capture efficiency is one of the most important parameter concerned by many bioprocesses with the purpose of CO2 sequestration. Since the rate of CO2 dissolving into liquid can be valuated by overall mass transfer rate using Equation (12), the CO2 capture efficiency  can be therefore simply described as the amount of CO2 been absorbed over the amount of CO2 been fed into the liquid (ms/md) within a specific dosing time period (td), shown in Equation (13).
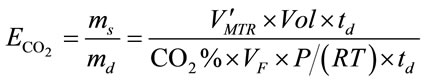 (13)
(13)
where CO2% means the percentage of CO2 in the gas supply, Vol is the volume of the liquid (m3), VF is the gas dosing flow rate (L×min−1), P is standard atmosphere pressure (101,325 Pa), R is the ideal gas law constant (8.314 J×K−1×mol−1) and T is the temperature (298 K).
The CO2 dissolving rate and the CO2 capture efficiency under different dosing conditions were plotted in Figures 6 and 7, respectively. In general, microbubble dosing by using the fluidic oscillator was found to have both higher CO2 dissolving rate (average mass transfer rate) and CO2 sequestration efficiency for a wide range of dosing flow rate, but the level of improvements were attenuated as the flow rate went up (similar to the attenuation of KLa improvement, see 3.2). Such attenuation of improvement was caused by the increase in microbubble size due to the weakening of oscillation and bubble coalescence under higher flow rate.
Apart from reducing bubble size, increasing flow rate can also achieve a higher KLa (see 3.1), it is therefore not a surprise to found that the CO2 overall mass transfer rate increases along with the flow rate (Figure 6). However,
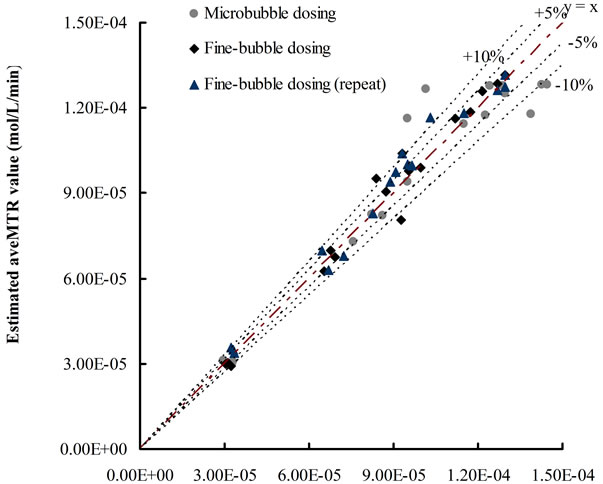

The KLa value for each condition was obtained based on selected time period (5 - 10 min), via the standard method described by Chisti [16]. For each dosing condition, the average mass transfer rates for selected time period (5 - 8 min, 5 - 10 min and 5 - 12 min) were estimated by Equation (12) (Y-axis) and examined by ([CO2]t − [CO2]0)/t (X-axis).
Figure 5. Plots of estimated average mass transfer rates versus examined values.
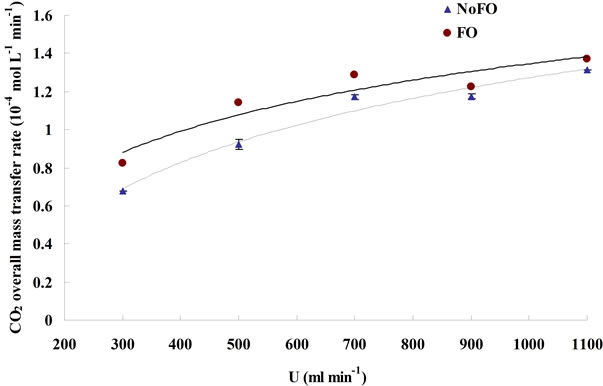
The average mass transfer rate was calculated based on Equation (12), and the time period selected for MTR’ calculation under each dosing condition was between 5 min and 10 min after starting dosing, the same time interval used for the KLa estimation.
Figure 6. The average mass transfer rate under different dosing conditions.
it is interesting that the CO2 capture efficiency actually reduces when the flow rate increases (Figure 7). Higher KLa dose mean higher CO2 overall mass transfer rate (higher CO2 dissolving rate), however, if the cost to achieve higher KLa is enhancing the dosing flow rate rather than reducing bubble size, then the amount of not dissolved CO2 (“wasted CO2”) would increase, and such increase in wasted CO2 could not be balanced by the increase in dissolved CO2, which ultimately lowers the CO2 capture efficiency. Therefore, in order to achieve both higher CO2 mass transfer rate and capture efficiency, reducing bubble size (e.g. using microbubbles) is more promising than increasing flow rate.

The CO2 capture efficiency for each dosing condition was calculated based on Equation (13), and the time period selected for each calculation under different dosing conditions is the same as for overall mass transfer rate calculation.
Figure 7. The plots of CO2 capture efficiency versus gas dosing flowrate.
3.5. Effect of NaHCO3 on Equilibrium pH and CO2 Mass Transfer Rate in Water
In microalgae culture, CO2 is injected into the culture medium (usually containing NaHCO3) rather than pure water. When adding NaHCO3 into water, NaHCO3 dissociates into sodium (Na+) and bicarbonate  ions, and these
  ions neutralize some of the H+ ions present in the medium to form the dissolved CO2 and so increase the pH. So the concentration of NaHCO3 clearly has an effect on pH, it is worth finding out whether the culture medium containing NaHCO3 could affect the CO2 mass transfer. Therefore, a separate experiment was carried out in a smaller version but the same design of airlift bioreactor (2.5 L).
Keeping other parameter constant (flow rate, temperature etc.), higher concentrations of NaHCO3 added into distilled water should theoretically raise the minimal pH (equilibrium pH, pH*) reached after CO2 dosing. According to Henry’s law and Two-film theory, the equilibrium concentration of dissolved CO2 ([CO2]*) should only depend on the CO2 partial pressure in the gas phase for a fixed gas/liquid properties and temperature (assuming the changes in liquid physical properties by adding different amount of NaHCO3 to the water, e.g. viscosity, are negligible, as long as the concentration of NaHCO3 is low). Therefore, different concentrations of NaHCO3 in the water should not affect the [CO2]*. On the other hand, the CO2 concentration is correlated to pH by Equation (3). Since the concentration of Na+ varies for different concentration of NaHCO3, while the [CO2]* does not change, it is therefore reasonable that pH* changes for the water containing various NaHCO3 concentration. Indeed, this hypothesis was proved correct, in Figure 8, a log-linear trend was observed in the equilibrium pH values as the concentration of NaHCO3 was increased. Besides, all the
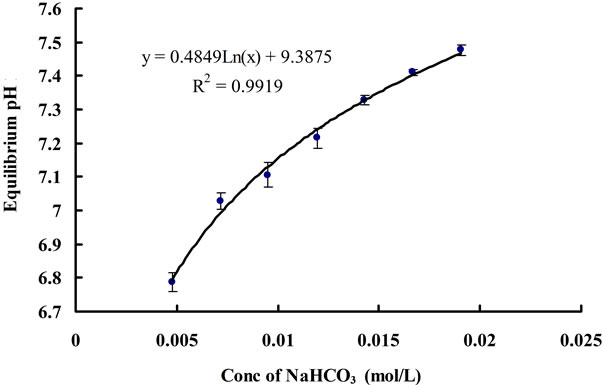
Figure 8. Change in equilibrium (final) pH for different concentration of NaHCO3.
equilibrium concentrations of CO2 corresponding to each equilibrium pH value under different concentrations of NaHCO3 were found to be the same, which is approximately 0.0017 ± 0.0001 mol∙L−1. In terms of mass transfer for CO2 dissolution, it can be seen that changing the concentration of NaHCO3 does not have much of an effect on the mass transfer coefficient (Figure 9). Hence, NaHCO3 could be used to control the equilibrium (minimal) pH of the medium without affecting the [CO2]* and KLa. The pH region can also be altered depending on the particular strain of microalgae being cultured, as different algae prefer different pH.
3.6. CO2 Mass Transfer in Microalgae Culture
In order to test the effect of real microalgae culture on CO2 mass transfer, 5% CO2 was dosed into a healthy D. Salina culture (containing 0.012 mol/L of NaHCO3) under a fixed flow rate (0.7 L/min) for 30 min, with pH recorded every 30 seconds. The results showed that there appears to be two distinct stages in terms of KLa, see Figure 10 for example. The calculations leading to the determination of the KLa mass transfer coefficients from the slopes seen in Figure 10 are given in Table A1 (See Appendix).
From the calculations in Table A1, for the first 4.5 minutes of gas supply, the concentration of CO2 dissolved and the resultant mass transfer is of different magnitudes when the pH is greater than 8.4. Once the pH is less than 8.4, the KLa is much higher in comparison. This was observed for each mass transfer test in culture medium with the threshold pH value of 8.4 seen each time. It is speculated that slower mass transfer at the start when pH is higher than 8.4 could be due to the chemical reactions taking place within the culture medium the gas is being bubbled through. Considering the dissociation of water into hydrogen (H+) and hydroxyl (OH-) ions, when the pH is over 8.4, the concentration of hydroxyl ions will be much greater than that of the hydrogen ions . The [H+] produced when CO2 dis-
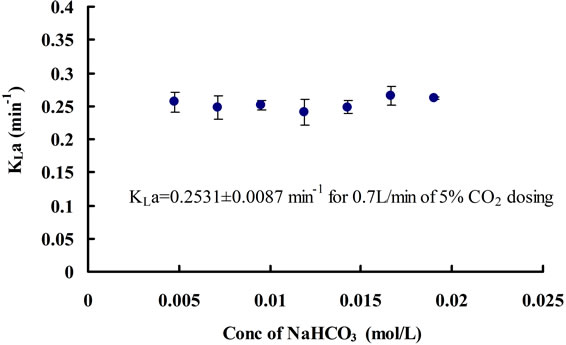
Figure 9. Changes in CO2 mass transfer coefficients for different concentrations of NaHCO3.
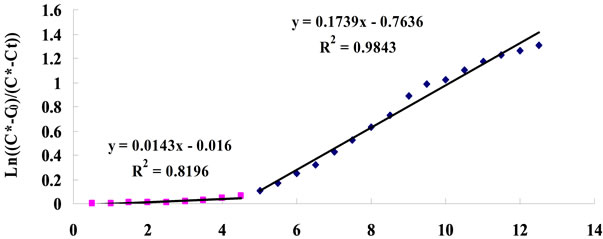

The slop of straight line indicates mass transfer coefficient KLa (min−1).
Figure 10. Typical plot for KLa estimation (for 0.7 L∙min−1 dosing).
solves will be neutralized by [OH−] present in the medium. Considering the carbonate equilibrium system (Equation (14)) [18], this will result in less dissolved CO2 and instead, more . Hence, it is argued that the mass transfer for dissolved CO2 will be low at relatively high pH as most of the supplied CO2 will react to form the bicarbonate species rather than the desired dissolved CO2. At less alkaline pH values, this transfer will be less significant and dissolved CO2 concentration will increase faster. This theory is also applicable to the mass transfer within a medium without microalgae, but such alkaline pH values were not encountered in the experiments conducted. Stemler (1980) also noted the effect of pH on the amount of dissolved CO2 and discusses the effect of pH on the relative levels of CO2 and
  present within a solution [19]. He found that in going from pH 8.0 to 7.3, the amount of
  changed very little while the concentration of CO2, on the other hand, increased more than 4-fold.
 (14)
(14)
In total, the CO2 mass transfer coefficient in the D. salina culture with 0.7 L∙min−1 of 5% CO2 gas dosing was found to be 0.0164 ± 0.0046 min−1 at pH > 8.4 and 0.1776 ± 0.0064 min−1 at pH < 8.4. For clarification purpose, at pH > 8.4 the KLa for dissolved CO2 is relatively low, but it dose not mean less CO2 from gas supply has been transferred into liquid. Actually, most of the CO2 been transferred into culture was converted into  and
and  when pH > 8.4. Therefore, when calculating the CO2 capture efficiency in future, the changes in the amount of total carbon (CT) should be considered rather than the amount of dissolved CO2 when pH > 8.4. But if the pH is less than 8.4, the changes in the amount of total carbon almost come from the changes in dissolved CO2, so it is fair to use the KLa of dissolved CO2 for CO2 capture efficiency estimation.
Comparing both CO2 mass transfer (when pH < 8.4) under 0.7 L∙min−1 of dosing for water containing NaHCO3 and the culture medium including microalgae (with the same concentration of NaHCO3), the KLa in water (0.2531 min−1) was found to be greater than the one in the presence of D. salina (0.1776 min−1). That may be because the cells in the medium increased its viscosity, which could have reduced the diffusivity of CO2 from liquid film to liquid phase plus part of dissolved CO2 could be consumed due to D. salina growth. Hence the rate of CO2 diffusion into the culture was slowed down, whilst without D. salina present the CO2 could diffuse much easier through the medium and without being consumed. Also, because of the changes in liquid properties, the CO2 equilibrium concentration [CO2]* was slightly smaller in the culture (0.0011 ± 0.0001 mol∙L−1) than that in the NaHCO3 medium (0.0017 ± 0.0001 mol∙L−1).
4. Conclusions
For the same bubble generation method, enhancing the gas dosing flowrate can increase the mass transfer coefficient. For the same bubbling flowrate, reducing the bubble size can lead to an improvement on KLa as well. Compared with fine-bubble dosing, microbubbles dosing of 5% CO2 gas by using fluidic oscillator has been proved to enhance the KLa for both CO2 dissolution and O2 removal by 30% - 100% across different flow rate. Despite KLa can be enhanced by either increasing the dosing flowrate (to be more accurate, flowrate/liquid volume ratio) or reducing the bubble size, increasing flow rate to achieve a higher KLa would also raise the amount of CO2 being wasted (not dissolved) which would ultimately lower the CO2 capture efficiency. Therefore, in order to achieve both higher CO2 mass transfer rate and capture efficiency for the improvement of microalgal growth and CO2 sequestration, reducing bubble size (e.g. using microbubbles) is more promising than increasing flow rate.
The KLa for CO2 dissolution was not affected by the presence of NaHCO3, and NaHCO3 could be used to control the equilibrium pH of the medium without affecting the [CO2]* and KLa. The pH region can also be altered depending on the particular strain of microalgae being cultured, as different algae prefer different pH. In the real algal culture, there appears to be two distinct stages in terms of KLa, divided by the pH of 8.4. When pH < 8.4, due to the changes in liquid properties and carbon system equilibrium relations, the KLa as well as [CO2]* was found slightly reduced than the ones in the water.
Future works need to be done to test the effect of different percentage of CO2 in the gas supply on mass transfer. And a mathematical model correlating mass transfer to bubble size, flow rate/liquid volume ratio and percentage of CO2 in the gas supply etc. is expected to be established, which could facilitate the estimation of CO2 dosing time for microalgae culture.
5. Acknowledgements
We acknowledge support for microbubble dynamics from EPSRC. WZ would like to thank the Royal Society for a Brain Mercer Innovation Award. DJG would like to acknowledge support from Carbon Trust.
REFERENCES
- L. Xu, P. J. Weathers, X.-R. Xiong and C.-Z. Liu, “Microalgal Bioreactors: Challenges and Opportunities,” Engineering in Life Sciences, Vol. 9, No. 3, 2009, pp. 178- 189. doi:10.1002/elsc.200800111
- A. Richmond, “CRC Handbook of Microalgal Mass Culture. Boca Raton,” CRC Press, Florida, 1986.
- A. P. Carvalho, L. A. Meireles and F. X. Malcata, “Microalgal Reactors: A Review of Enclosed Systems Design and Performance,” Biotechnology Progress, Vol. 22, No. 6, 2006, pp. 1490-1506. doi:10.1021/bp060065r
- A. Richmond, “Handbook of Microalgal Culture: Biotechnology and Applied Phycology,” Wiley-Blackwell, New York, 2008.
- O. Pulz, “Photobioreactors: Production Systems for Phototrophic Microorganisms,” Applied Microbiology and Biotechnology, Vol. 57, No. 3, 2001, pp. 287-293. doi:10.1007/s002530100702
- R. K. Gary, “The Concentration Dependence of the ∆S Term in the Gibbs Free Energy Function: Application to Reversible Reactions in Biochemistry,” Journal of Chemical Education, Vol. 81, No. 11, 2004, pp. 1599-1604. doi:10.1021/ed081p1599
- A. P. Carvalho and F. X. Malcata, “Transfer of Carbon Dioxide within Cultures of Microalgae: Plain Bubbling Versus Hollow-Fiber Modules,” Biotechnology Progress, Vol. 17, No. 2, 2001, pp. 265-272. doi:10.1021/bp000157v
- D. R. Ketkar, R. Mallikarjunan and S. Venkatachalam, “Electroflotation of Quartz Fines,” International Journal of Mineral Processing, Vol. 31, No. 1, 1991, pp. 127-138. doi:10.1016/0301-7516(91)90009-8
- J. K. Edzwald, J. P. Walsh, G. S. Kaminski and H. J. Dunn, “Flocculation and Air Requirements for Dissolved Air Flotation,” American Water Works Association, Vol. 84, No. 3, 1992, pp. 92-100.
- S. E. Rijk and J. G. Blanken, “Bubble Size in Flotation Thickening,” Water Research, Vol. 28, No. 2, 1994, pp. 465-473. doi:10.1016/0043-1354(94)90284-4
- C. Tsouris, D. W. DePaoli, J. Q. Feng and T. C. Scott, “Experimental Investigation of Electrostatic Dispersion of Nonconductive Fluids into Conductive Fluids,” Industrial and Engineering Chemistry Research, Vol. 34, No. 4, 1995, pp.1394-1403. doi:10.1021/ie00043a047
- L. A. Féris and J. Rubio, “Dissolved Air Flotation (DAF) Performance at Low Saturation Pressures,” Filtration & separation, Vol. 36, No. 9, 1999, pp. 61-65. doi:10.1016/S0015-1882(99)80223-7
- W. B. Zimmerman, V. Tesar, S. Butler and H. C. H. Bandalusena, “Microbubble Generation,” Recent Patents on Engineering, Vol. 2, No. 1, 2008, pp. 1-8. doi:10.2174/187221208783478598
- W. B. Zimmerman, B. N. Hewakanadamby, V. Tesar, H. C. H. Bandulasena and O. A. Omotowa, “On the Design and Simulation of Airlift Loop Bioreactor with Microbubble Generation by Fluidic Oscillation,” Food and Bioproducts Processing, Vol. 87, No. 10, 2009, pp. 215-227. doi:10.1016/j.fbp.2009.03.006
- W. B. Zimmerman, M. Zandi, H. C. H. Bandulasena, V. Tesař, D. J. Gilmour and K. Ying, “Design of an Airlift Loop Bioreactor and Pilot Scales Studies with Fluidic Oscillator Induced Microbubbles for Growth of a Microalgae Dunaliella salina,” Applied Energy, Vo. 88, No. 10, 2011, pp. 3357-3369. doi:10.1016/j.fbp.2009.03.006
- M. Y. Chisti, “Airlift Bioreactors,” Elsevier Applied Science, London, 1989.
- K. Ying, D. J. Gilmour, Y. Shi and W. B. Zimmerman, “Growth Enhancement of Dunaliella salina by Microbubble Induced Airlift Loop Bioreactor (ALB)—The Relation between Mass Transfer and Growth Rate,” Journal of Biomaterials and Nanobiotechnology, No. 4, 2013, pp. 1-9. doi:10.4236/jbnb.2013.42A001
- R. Corfield, “The Carbon Cycle,” In: C. Cockell, Ed., An Introduction to the Earth-Life System, Cambridge University Press, Cambridge, 2008, pp. 61-93.
- A. Stemler, “Forms of Dissolved Carbon Dioxide Required for Photosystem II Activity in Chloroplast Membranes,” Plant Physiology, Vol. 65, No. 6, 1980, pp. 1160-1165. doi:10.1104/pp.65.6.1160
Appendix

Table A1. An example of calculations leading to the CO2 mass transfer coefficient (for 0.7 L∙min−1 dosing)
NOTES
*Corresponding author.