Journal of Environmental Protection
Vol.3 No.11(2012), Article ID:25021,11 pages DOI:10.4236/jep.2012.311166
Indoor Air Quality Measurement with the Installation of a Rooftop Turbine Ventilator
![]()
School of Mechanical and Manufacturing Engineering, University of New South Wales, Kensington, Australia.
Email: lien1122@hotmail.com
Received July 13th, 2012; revised August 11th, 2012; accepted September 12th, 2012
Keywords: Indoor Air Quality; Rooftop Turbine Ventilator; Computational Analysis
ABSTRACT
The present paper presents a numerical analysis of the difference in comfort level inside a room of a residential building when roof top turbine ventilator is installed. This analysis simulates various comfort factors which includes the indoor air movement, room temperature, Predicted Mean Vote (PMV) and Predicted Percentage of Dissatisfied (PPD). Various test cases of ventilator exhaust rate were examined. The results showed that general comfort satisfying international standards in building can be achieved. This study also presents a qualitative and quantitative study of indoor air temperature and overall indoor air flow pattern. A promising conclusion that can be drawn from this study is that wind driven ventilators can play an important role in the design of a cost effective and energy efficient ventilation system inside a building.
1. Introduction
Inadequate ventilation in a building can result in problems with moisture, unpleasant smell, lack of oxygen, and unacceptable content of poisons gases such as CO. Contaminants such as formaldehyde or radon can also accumulate in poorly ventilated homes, causing health problems. However, since resistance to pollutant varies from person to person, it is hard to accurately quantify the impact of ventilation on human beings. Various methods have been proposed based on the consideration of factors such as direct medical costs and lost earnings due to major illness as well as increased employee sickness days and lost productivities while on the job. From such studies, the productivity loss in the United States of America attributed directly to indoor air quality (IAQ) has been estimated to be approximately 14 minutes per day [1] or 1 to 1.5 billion of euro per year or equivalent of 250 to 350 euro per inhabitant in Norway [2]. Other studies suggest that the potential economic impact of indoor air pollution on a country, such as on Finland, can run into tens of billions of dollars per calendar year [3].
The last century has seen tremendous progress in technological development that is underpinning the progress of the modern day human civilization. The focus on these developments has been placed on energy efficiency and sustainable buildings for most governments around the world. Moreover, recent price hike in fossil and energy accelerates people’s awareness and attention in focusing the use of more sustainable solutions other than relying on fossil fuel. As a result, natural ventilation has become an increasingly attractive way of reducing energy consumption and cost in recent decades.
Engineers have exhausted ideas to evaluate the most cost effectiveness measures to achieve a renewable and sustainable goal. The Aerodynamic Research team at the University of New South Wales over the last decade has been actively applying novel aerodynamic concepts [4- 12] to harness the benefit of renewable energy by developing various methodologies and techniques [13-26] for cost effective environmental friendly devices.
Most of the measures applied on buildings sector have aimed to improve performance across all the metrics that include: saving building energy consumption, water efficiency, green house gas emissions reduction, indoor environmental quality improvement and stewardship of resources and sensitivity of their impacts [27]. Under such concern, assisted natural ventilation devices such as turbine ventilators became more favorable and viable solution in providing suitable indoor environment for many building designs.
Typical wind driven turbine ventilators as shown in Figure 1, consist of a base and a top in the form of a rotor, which acting like a turbine, extracts mechanical work from the wind to produce its rotation. Using of these devices can greatly assist to improve the indoor air quality when strategically placed [28].
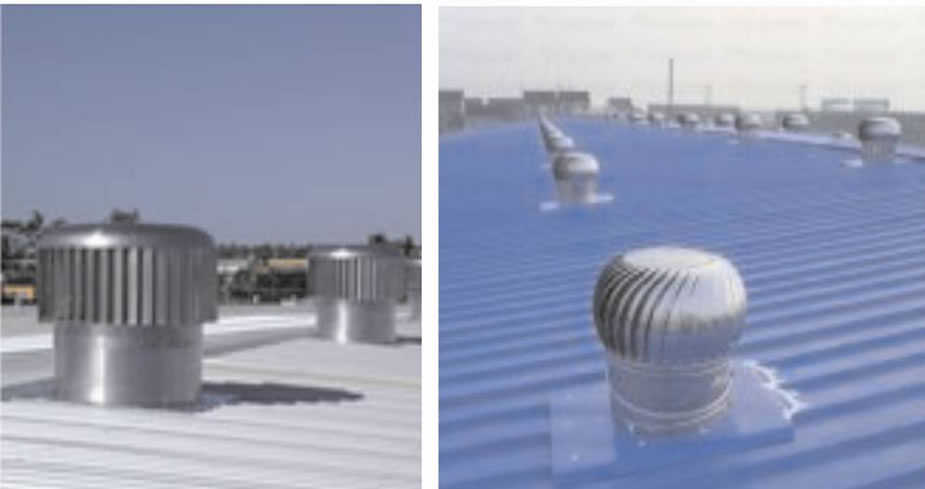
Figure 1. Rooftop turbine ventilators installations.
Experimental studies and CFD models have been applied to evaluate various indoor environments, such as apartments, offices, classrooms and factories [29-32]. The fundamental aerodynamic behaviour of rotating ventilator has been analysed in both numerically and experimentally [33]. During the design phase, the process often involves determination of the optimal conditions of ventilation system, such as air velocity and temperature, location of air inlet and exhaust outlet. Hence, computational fluid dynamics (CFD) simulation method would become an efficient and economical tool to control and examined indoor environment [34].
The present paper extends the previous studies of Lien and Ahmed [33], focusing on the comfort level difference inside a typical residual house room when roof top turbine ventilator is installed. The main comfort factors studied includes the indoor air movement, room temperature, Predicted Mean Vote (PMV) and Predicted Percentage of Dissatisfied (PPD).
2. Numerical Model
2.1. The Computation Code
Commercial CFD packages are frequently used for indoor environment simulations and calculations [35-37].
In the present work the latest version of FLUENT is used. The equations for the conservation of mass, momentum and turbulence scales are solved in FLUENT using the control volume method in a three-dimensional bodycoordinate system. Recognising the results of CFD studies largely depend on the meshing quality, turbulence models, boundary conditions and difference schemes, a brief outline of them as used in the present modelling is summarised here.
2.2. Boundary Conditions
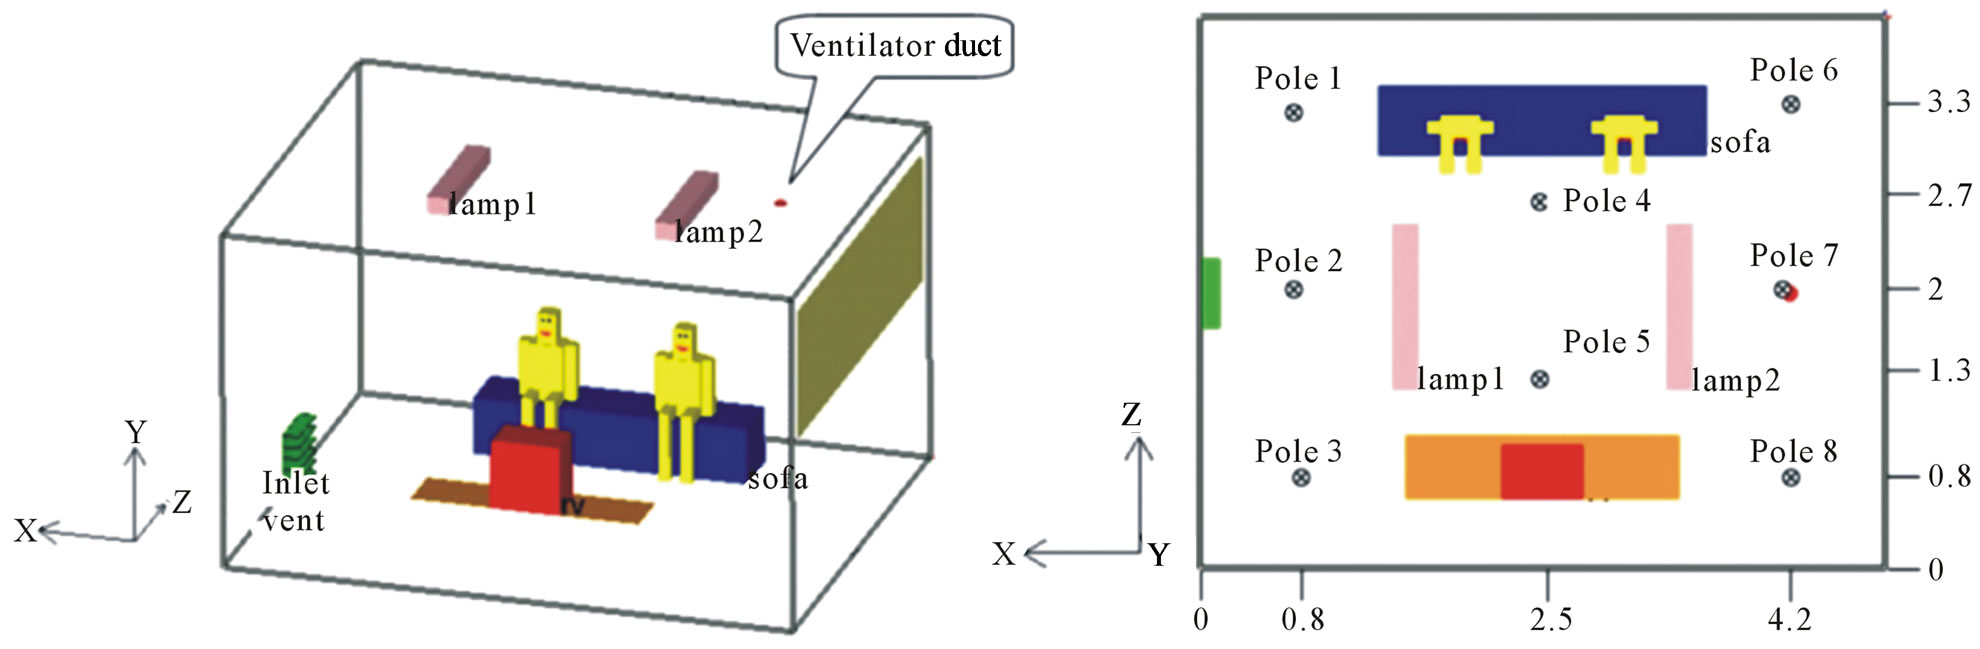
A model house living room with dimension of 5 m long × 4 m wide × 3 m height was simulated in this study and is shown in Figure 2(a). A ventilator duct was installed on top ceiling (11 cm diameter). An air inlet vent (0.5 × 0.5 m) was also installed on the left wall to supply fresh air. The air supply temperature is set to 23˚C to simulate a typical Sydney day temperature. This simulation models the natural ventilation mechanism hence no inlet velocity property was assigned. The ventilator exhaust rate was controlled by using CFD software to observe the indoor comfort variables change. Eight testing points are employed to collect steady state condition. The locations of these test points are shown in Figure 2(b). The final total number of grids used in the present simulation was determined to be approximately 800,000. Mesh quality was checked to ensure the skewness of the three dimensional grids is less than 0.8.
The accuracy of CFD simulations relies on the appropriate setting of physical boundary conditions. The controlled boundary conditions of the present work includes: the outside ambient condition, indoor heat sources generation, ventilator exhaust rate (air outlet), vent air inlet, humidity and radiation. The amount of heat generated by occupants and electrical appliances are represented by heat fluxes. Assumption of these heat fluxes are applied, i.e. the occupant metabolic rate is 70 W/m2, each lamps
 (a) (b)
Figure 2. (a) Schematic of the model room; (b) Testing pole locations.
generates 34 W of heat and 300 W for the Television unit. Atmospheric pressure was applied on the inlet and outlet condition. The air humidity set to at 50%.
2.3. The Choice of Turbulence Model
The standard k-e model has been widely used in the industrial sector for its effectiveness in various engineering applications. For many cases, the choice of standard k-e was a good compromise except for natural ventilation with significant indoor thermal loads [38]. However, the standard k-e turbulence model has suffered from deficiencies for areas with very low velocities, particularly near wall regions. A basic characteristic of the RNG k-e turbulence model is that the analytically derived differential formula accounts for low Reynold number effects. Hence for near wall regions, the RNG k-e turbulence model are expected to be more effective [31].
In the present work, RNG k-e based model is used to predict airflow velocity and temperatures in the model house room.
2.4. Standard Regulation Criteria
Following ISO 7730 [38], the parameters which defines the thermal environment are temperature, humidity, air velocity, and personal parameters such as clothing with activity level. For a comfort indoor environment (80% acceptance), the benchmark values are summarised below:
• Local indoor air velocity < 0.25 m/s.
• Desired range of room temperature 24˚C - 26˚C.
• Predicted Mean Vote (PMV) margin –0.5 - 0.5.
• Predicted Percentage of Dissatisfied (PPD) ≤ 10%.
These comfort variables are monitored at all testing pole and compared with the benchmark values.
3. Results and Observations
Four different ventilation exhaust rate of were 1 m/s, 1.5 m/s, 2 m/s, 3 m/s were simulated. For the purpose of observation, the exhaust rate was set at 1.5 m/s and the various flow pattern and temperature contour were plotted at three cut planes (z = 0.8 m, 2 m, 3.3 m) along the XY and YZ direction
3.1. Flow Field and Temperature Observations
The ventilated flows at three cut-planes were calculated and shown in Figures 3 and 4. The flow pattern results agree well with the experimental and numerical work by Stamou and Katsiris, 2006 [31] where an office room was modelled. Four distinct flows regions can be characterised as follows:
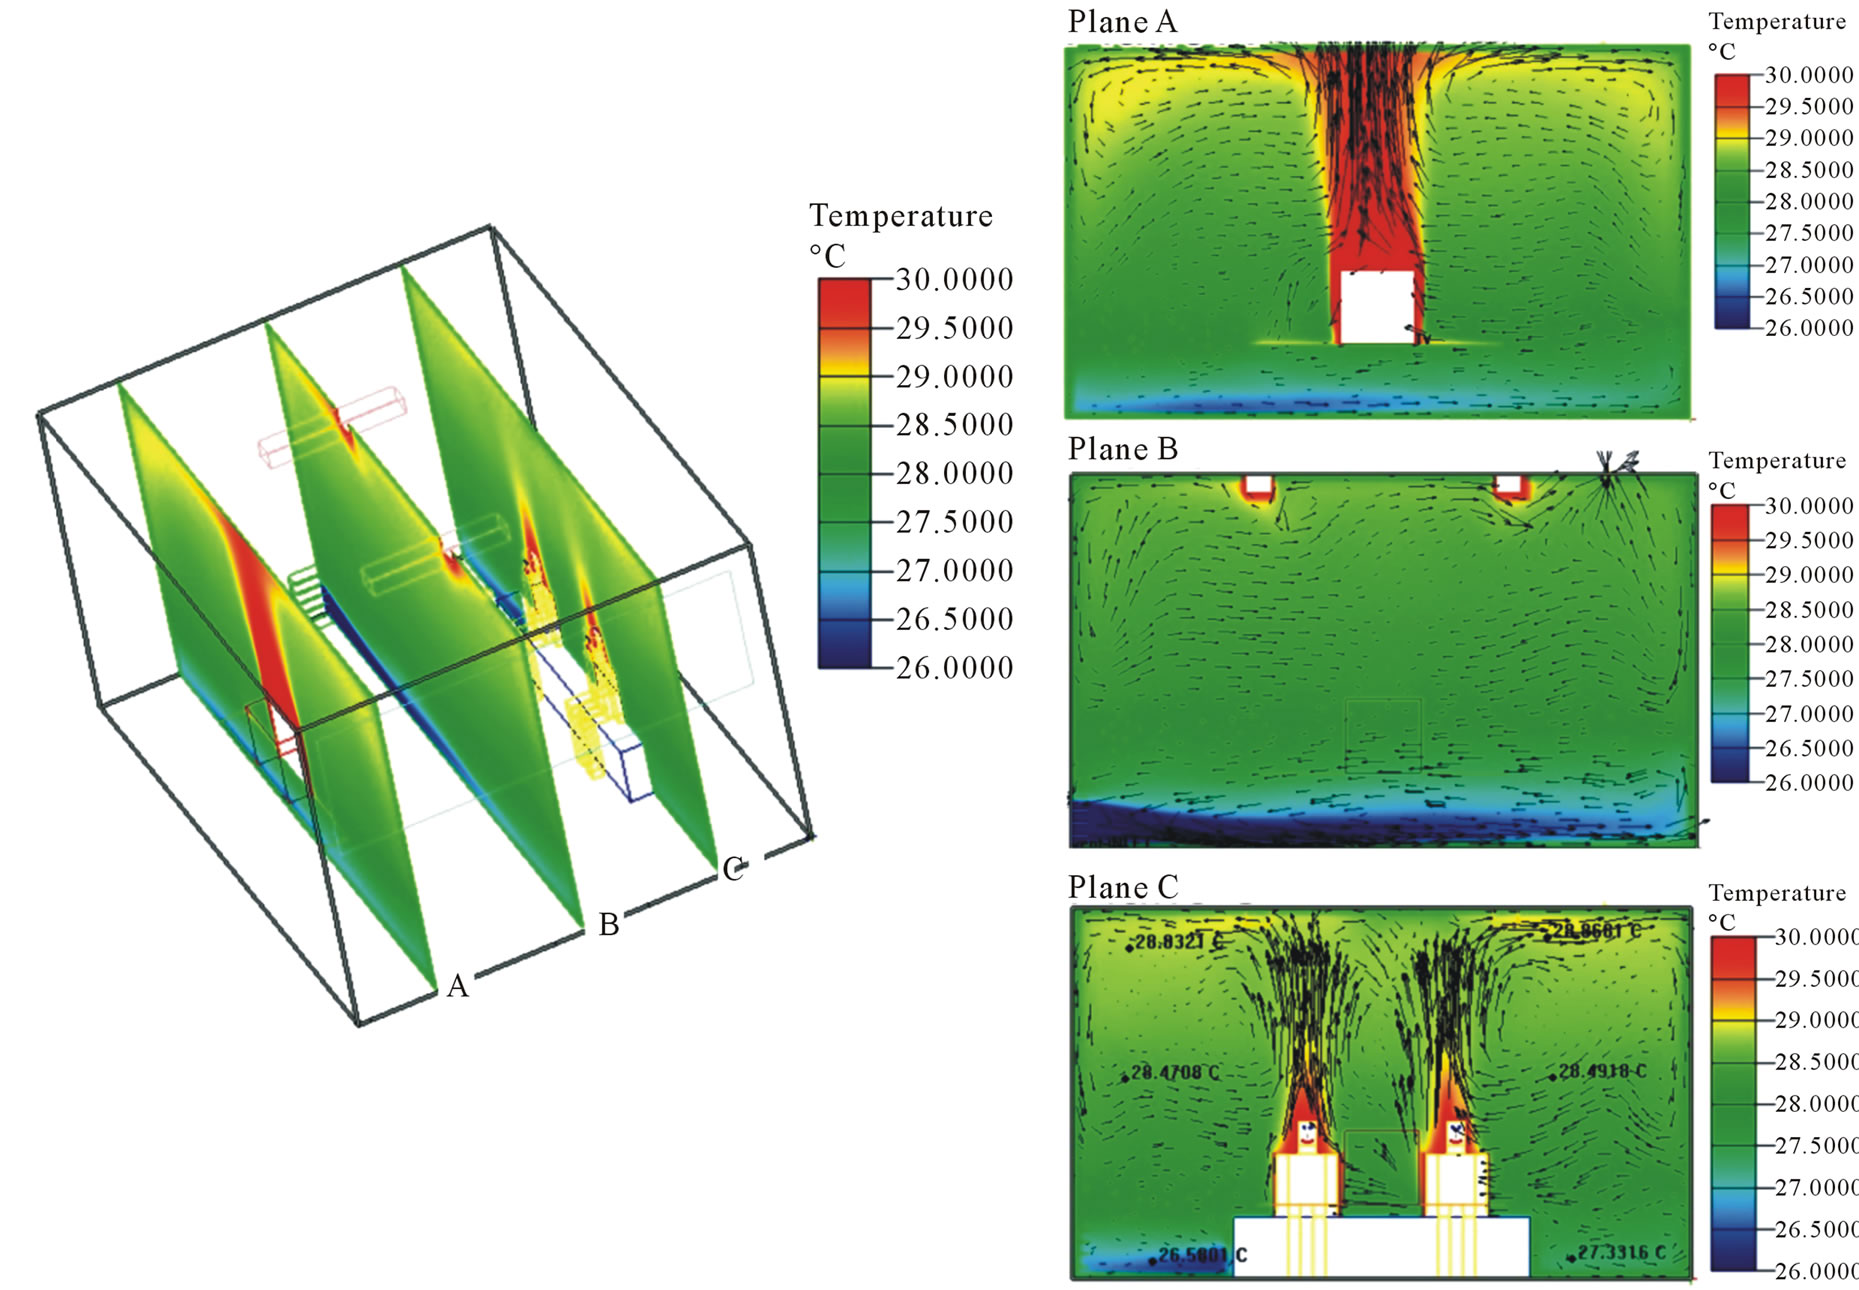
Figure 3. Airflow pattern and room temperature contour plot.
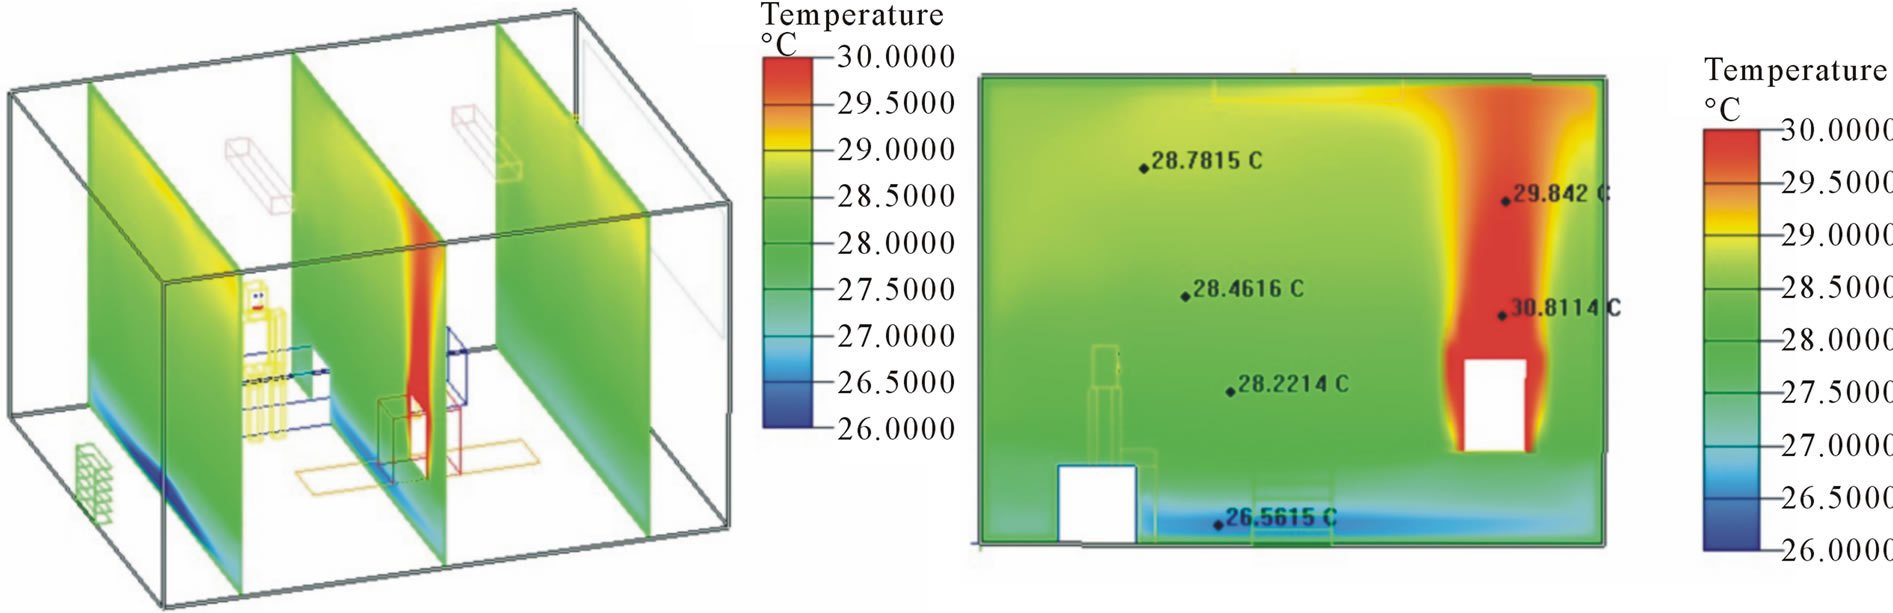
Figure 4. Temperature contour plot in YZ plane.
1) The floor layer and incoming flow region The incoming flow (23˚C) through the vent is cooler than the room temperature (approximately 26˚C to 30˚C). A floor layer is formed as the cool air enters the room via the inlet, bends downwards due to buoyancy force.
2) The buoyant plumes region Large buoyant vertical plumes are formed, see Figures 3 and 4. These are originated from the heat sources; the occupant, the television unit, and the lights.
3) The ceiling layer and the outlet flow region The plumes from the heat sources travelled upwards until struck the ceiling and flowing along towards all directions. This phenomenon is shown in Figures 3 and 4 (Cut planes A and C).
4) The exit flow and re-circulation region The ventilator draws exhaust flow to exit from the ventilation duct and this creates a re-circulation region in the centre of the room. Other re-circulation regions were observed near the heat sources, largely caused by the buoyant plumes. The temperature profiles generally increases with the room vertical height. Higher temperature is observed in the region of the buoyant jets and the ceiling layer. The room temperature, except the buoyant plumes region, can be divided into three main zones: the cooler, the intermediate and the warmer. The results also indicate that the horizontal temperature variation is considerably less than the vertical profiles.
3.2. Results at the Testing Pole
After analysed the flow field, the comfort level in the occupied zone is evaluated. Environment variables i.e. air temperature, air velocity and mean radiant temperature were calculated at 8 testing poles as shown in Figure 2. The data were collected from the floor up to a height of 2.5 meters under steady-state condition. The variations of room temperature, air velocity and PMV with height were plotted at each pole as shown in Figures 5-7 respectively. The exhaust rate is defined at 1.5 m/s.
The temperature plots indicated that the temperature showed an increasing trend with the height. The overall room temperature varied from 26.3˚C to 28.8˚C, except a low region of 24.7˚C, which was near the air inlet vent of 23˚C. Due to the fact that the overall flow pattern strongly depends on temperature change, the temperature gradient needs to be observed. From the results, it can be concluded that all temperature curves showed the gradient with three stages:
1) From floor to approximately 0.5 m At this range the temperature changed relatively rapid due to the heat convection between the bottom ground cold air and the hot air inside the room.
2) From 0.5 to 1.4 m in height The decreasing change of temperature gradient was observed. This indicated that the air temperature in the middle layer of the room varied very small; finally.
3) From 1.4 to 2.5 m in height The temperature gradient in this section is relatively smaller compare to the previous sections. The main flow driving force in this section is the buoyancy effect.
The air velocity variation plots indicate that peak air movement occurred near both ground and ceiling regions. The region between these two peaks has air velocity less than 0.05 m/s. It is noted that, areas with high air movement is at the bottom region of pole 2 and the top region of pole 7 which correspond well with the boundary conditions as they were located near the air inlet and outlet. The minimum air velocity movement region was around 0.5 m except for pole 4. This coincides with the observations of the flow pattern described in the previous section as the interaction of two bottom layer flow in opposite directions.
The PMV value largely depend on temperature, hence the trend of PMV plot as shown in Figure 6 is similar to temperature plots. The PMV values of all 8 testing poles within 2.5 m height are less than 0.5.
After observing the trend of the interested comfort variables, the mean values of variable are recalculated for
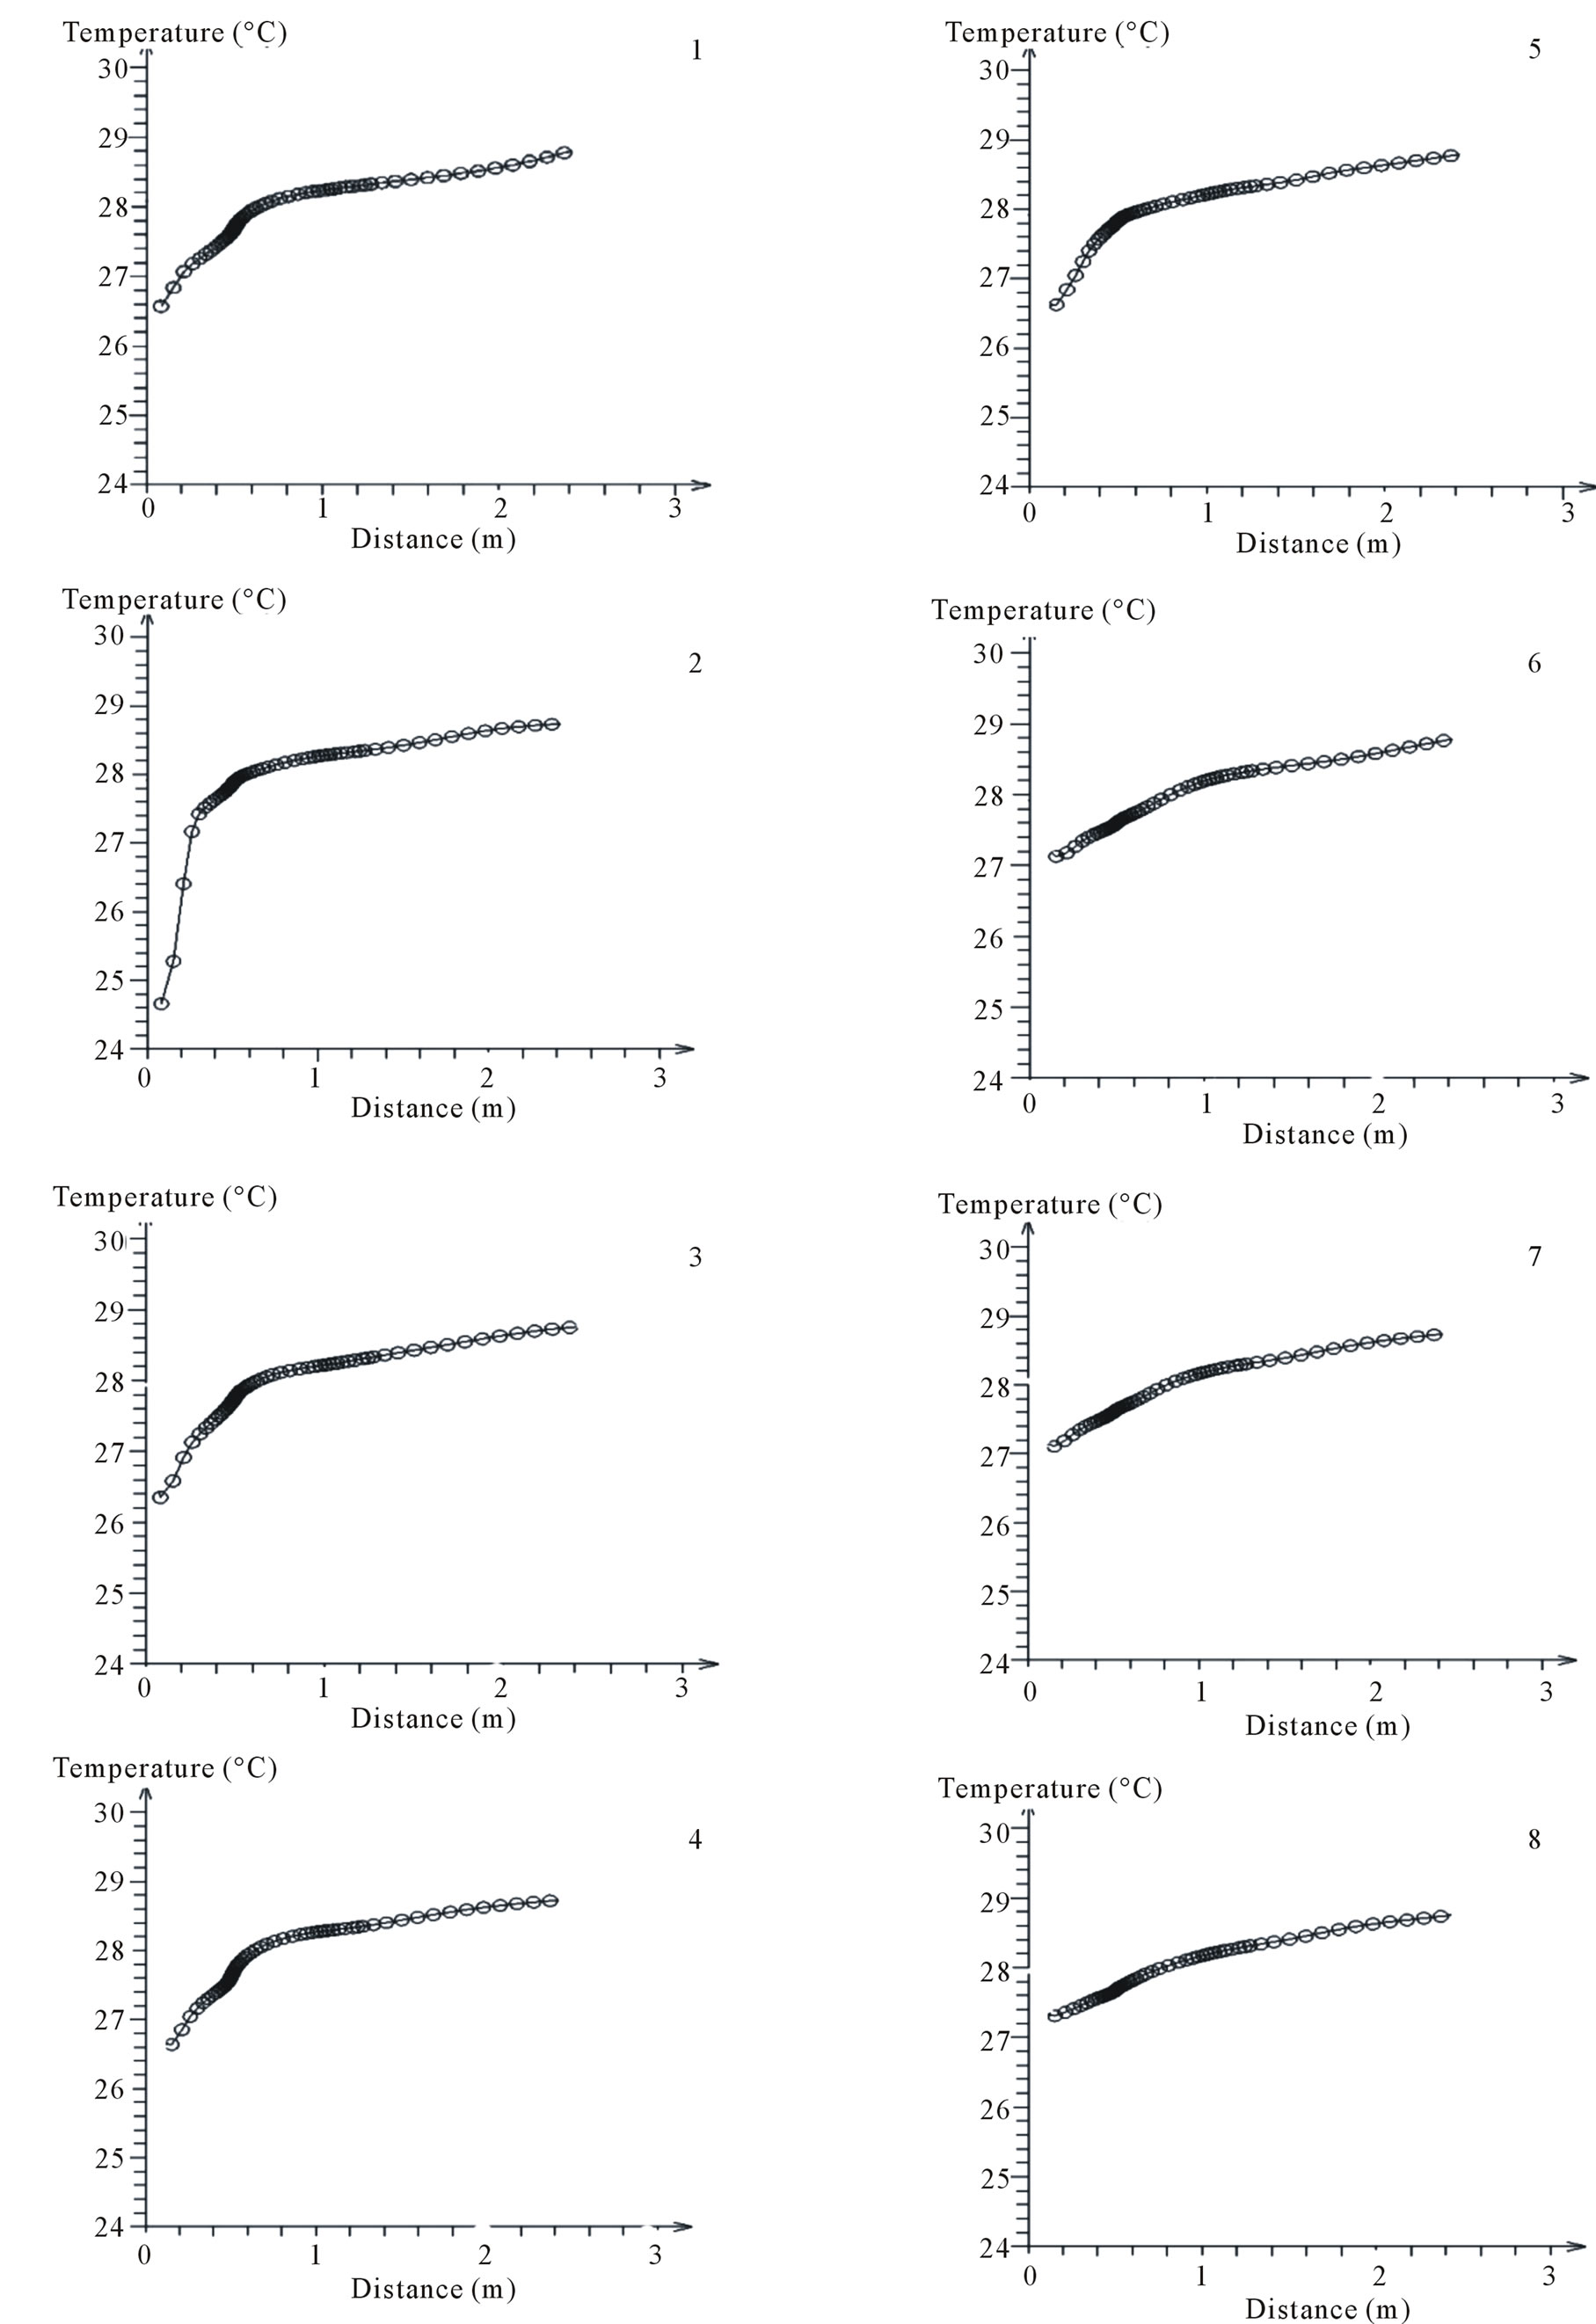
Figure 5. Temperature variation for testing poles 1-8.
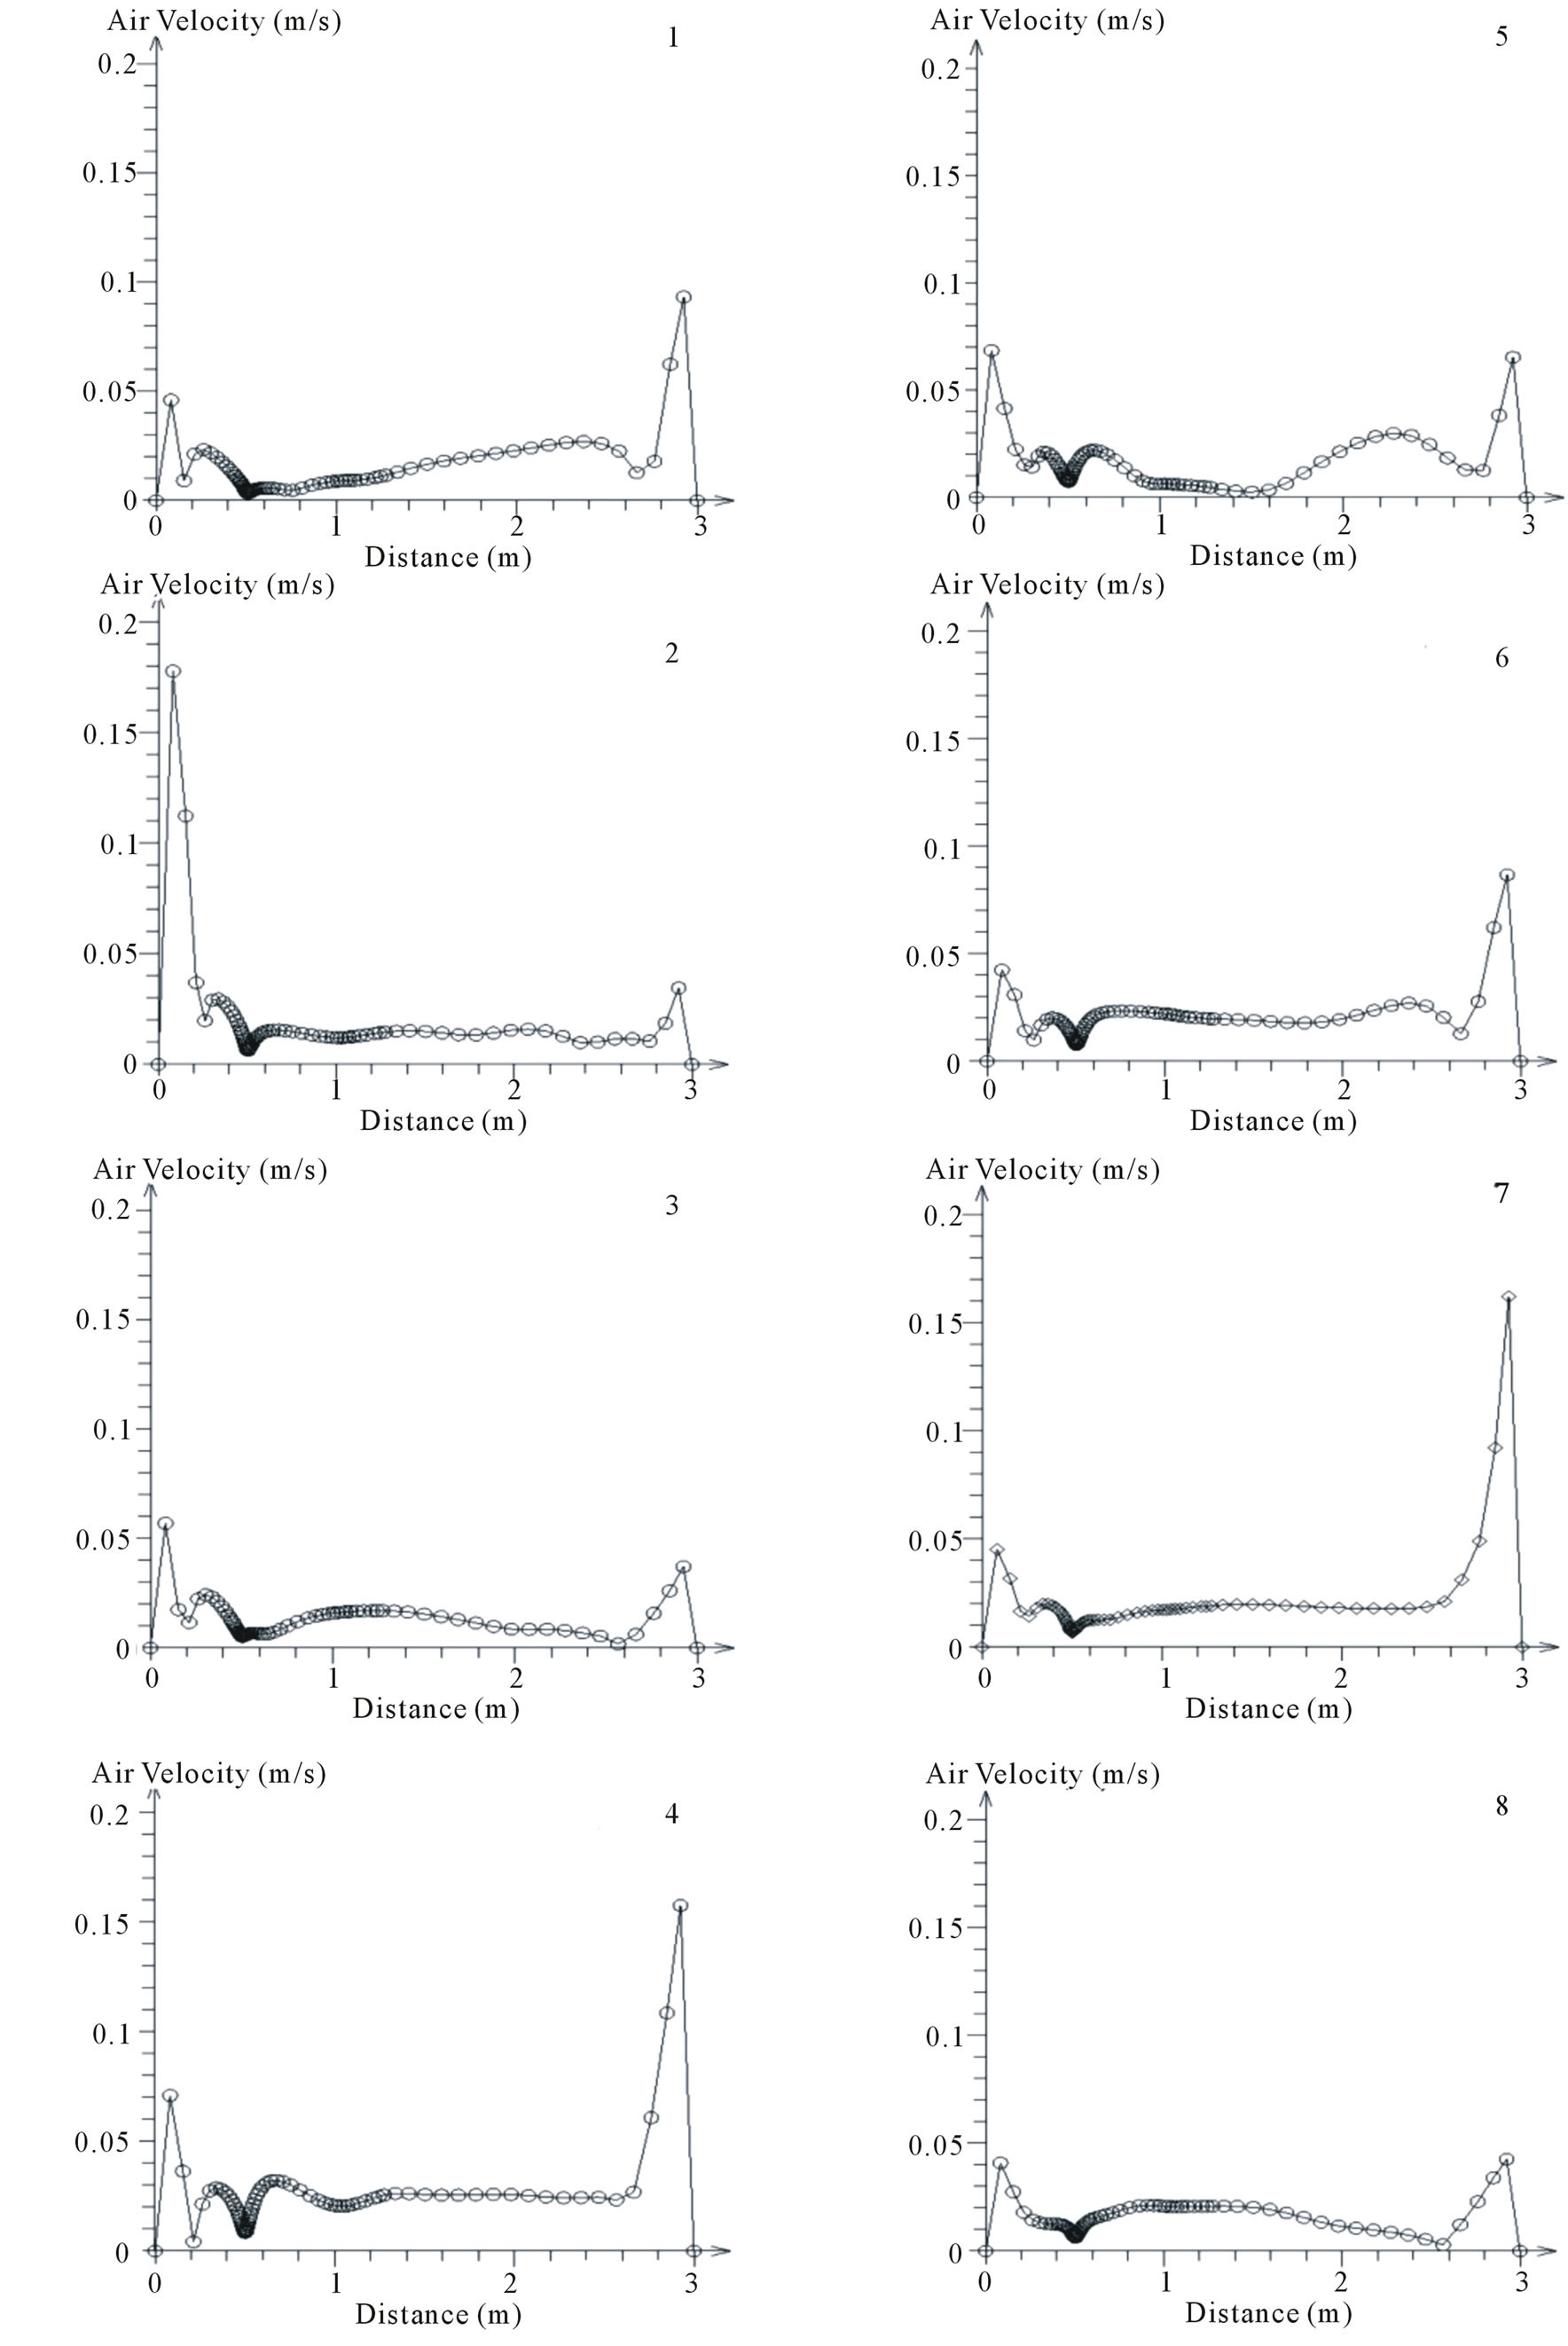
Figure 6. Air velocity variation for testing poles 1-8.
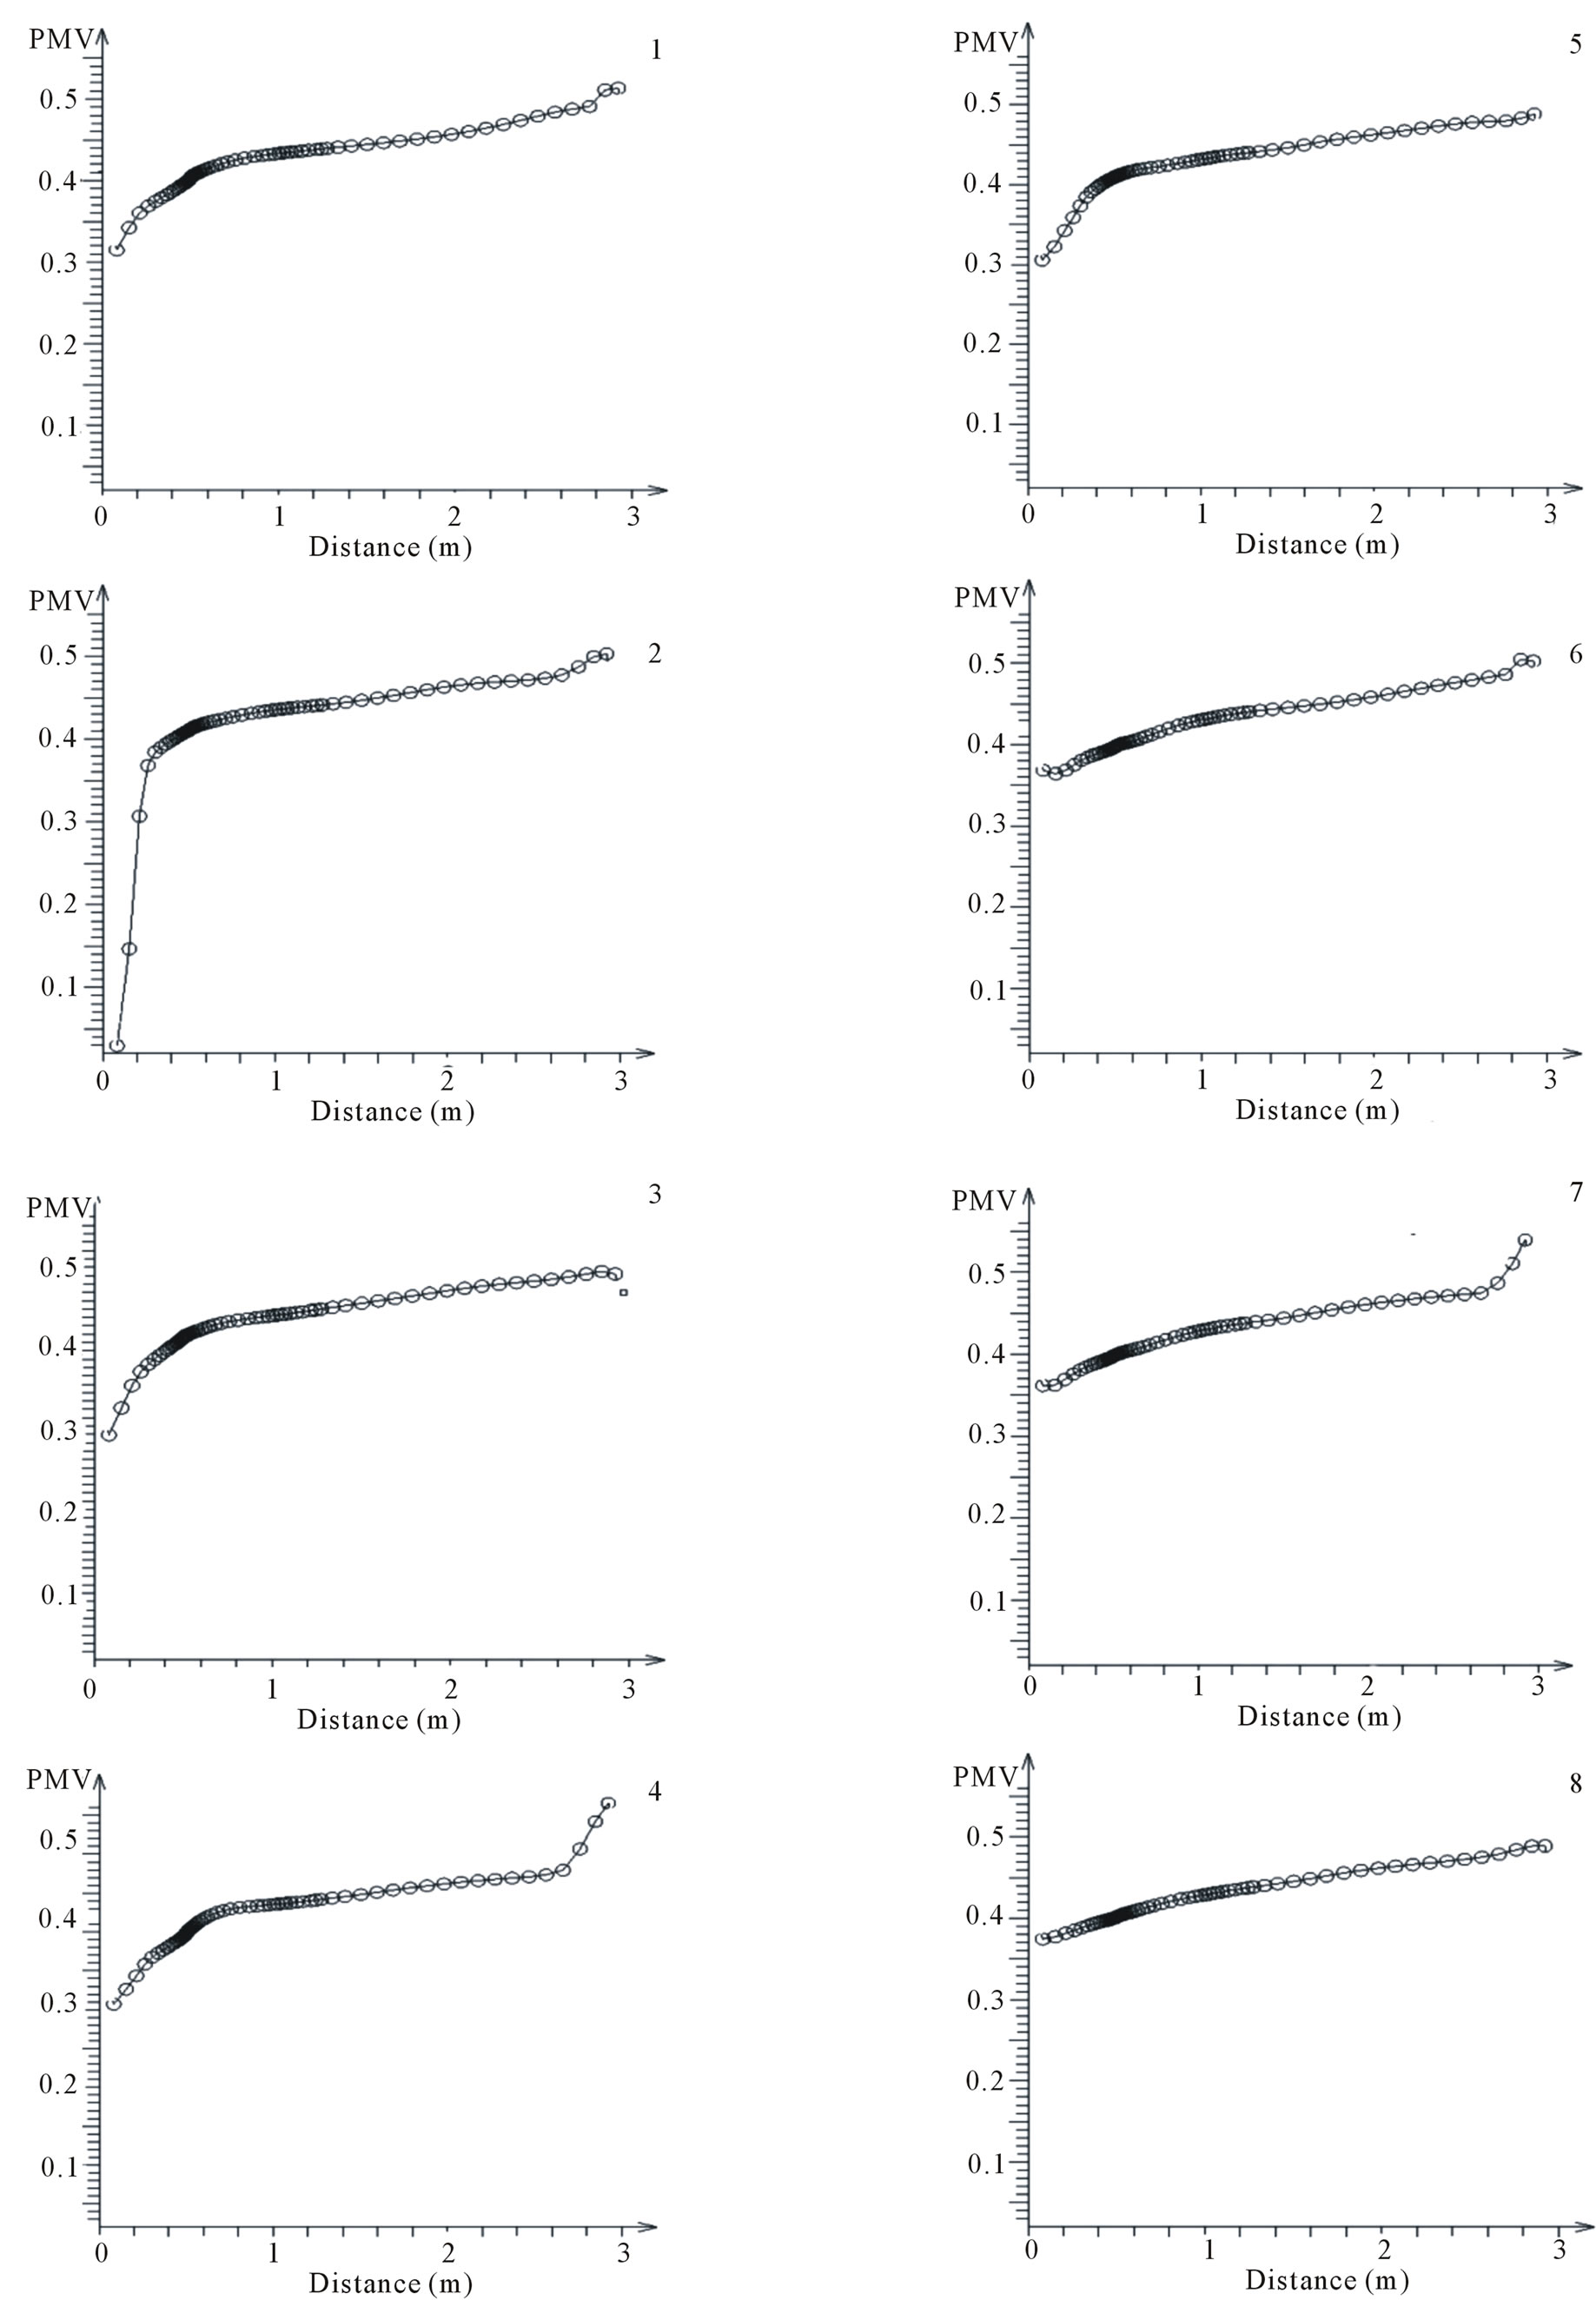
Figure 7. PMV variation for testing poles 1-8.
the regions of 0 to 2.5 m height with different ventilator exhaust rate (1, 1.5, 2 and 3 m/s). The results are shown in tabulated form where the temperature and air velocity are shown in Table 1 and the PMV and PPD values are shown in Table 2.
4. Discussion of Indoor Comfort Level
This study focused on the study of indoor air quality and comfort level when the turbine ventilator is installed. Four major comfort qualities: air velocity, temperature, PMV and PPD are evaluated and compared with ISO Standard 7730. Each of these aspects is discussed in this section.
4.1. Air Movement
The simulated results of the four exhaust rate indicate that air movement velocity at all test poles are within the range of 0.04 - 0.21 m/s. The highest air velocity was observed at the region near the inlet vent and the lowest one located at pole 8. According to ISO Standard 7730, the modelled air velocities are well within the comfort criteria of 0.25 m/s.
4.2. Temperature
The results in Table 1 indicate that the mean temperature at all test poles reduced from 27.71˚C to 27.26˚C as the ventilator exhaust rate increased from 1 m/s to 3 m/s. However this is slightly higher than the desired range of temperature of 24˚C - 26˚C as indicated by ISO Standard 7730.
4.3. Predicted Mean Vote (PMV) and Predicted Percentage Dissatisfied (PPD)
The acceptance to climate change for each individual is different, hence the evaluation process for comfort level is a very subjective task [38]. During the past decade,
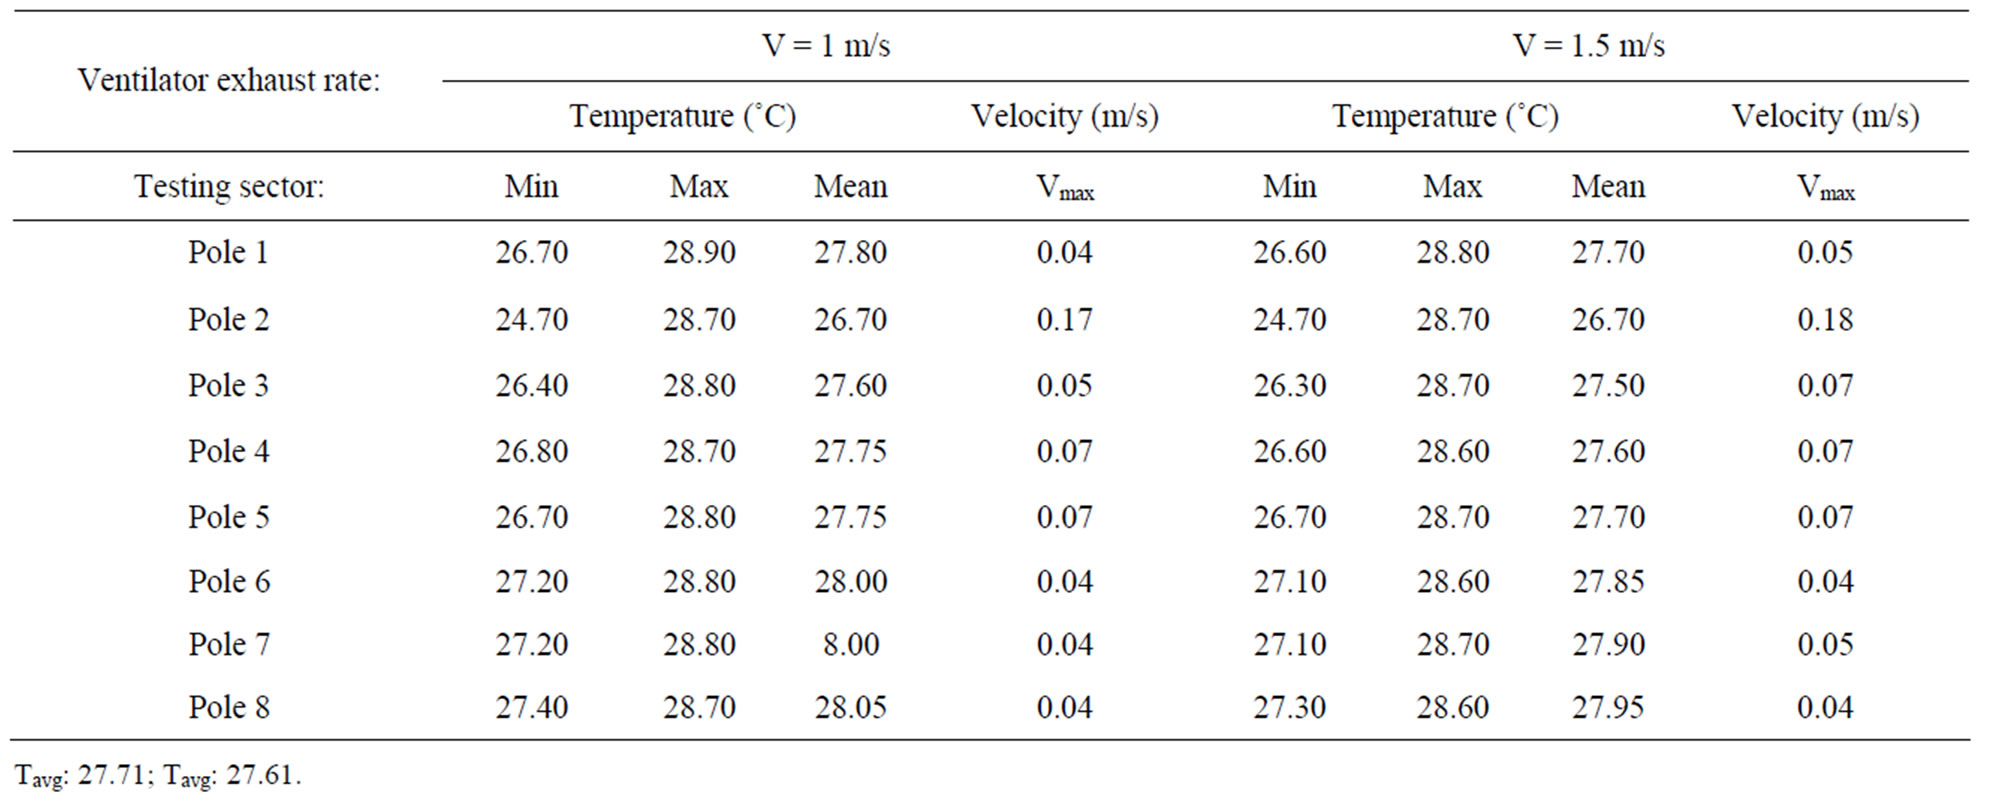
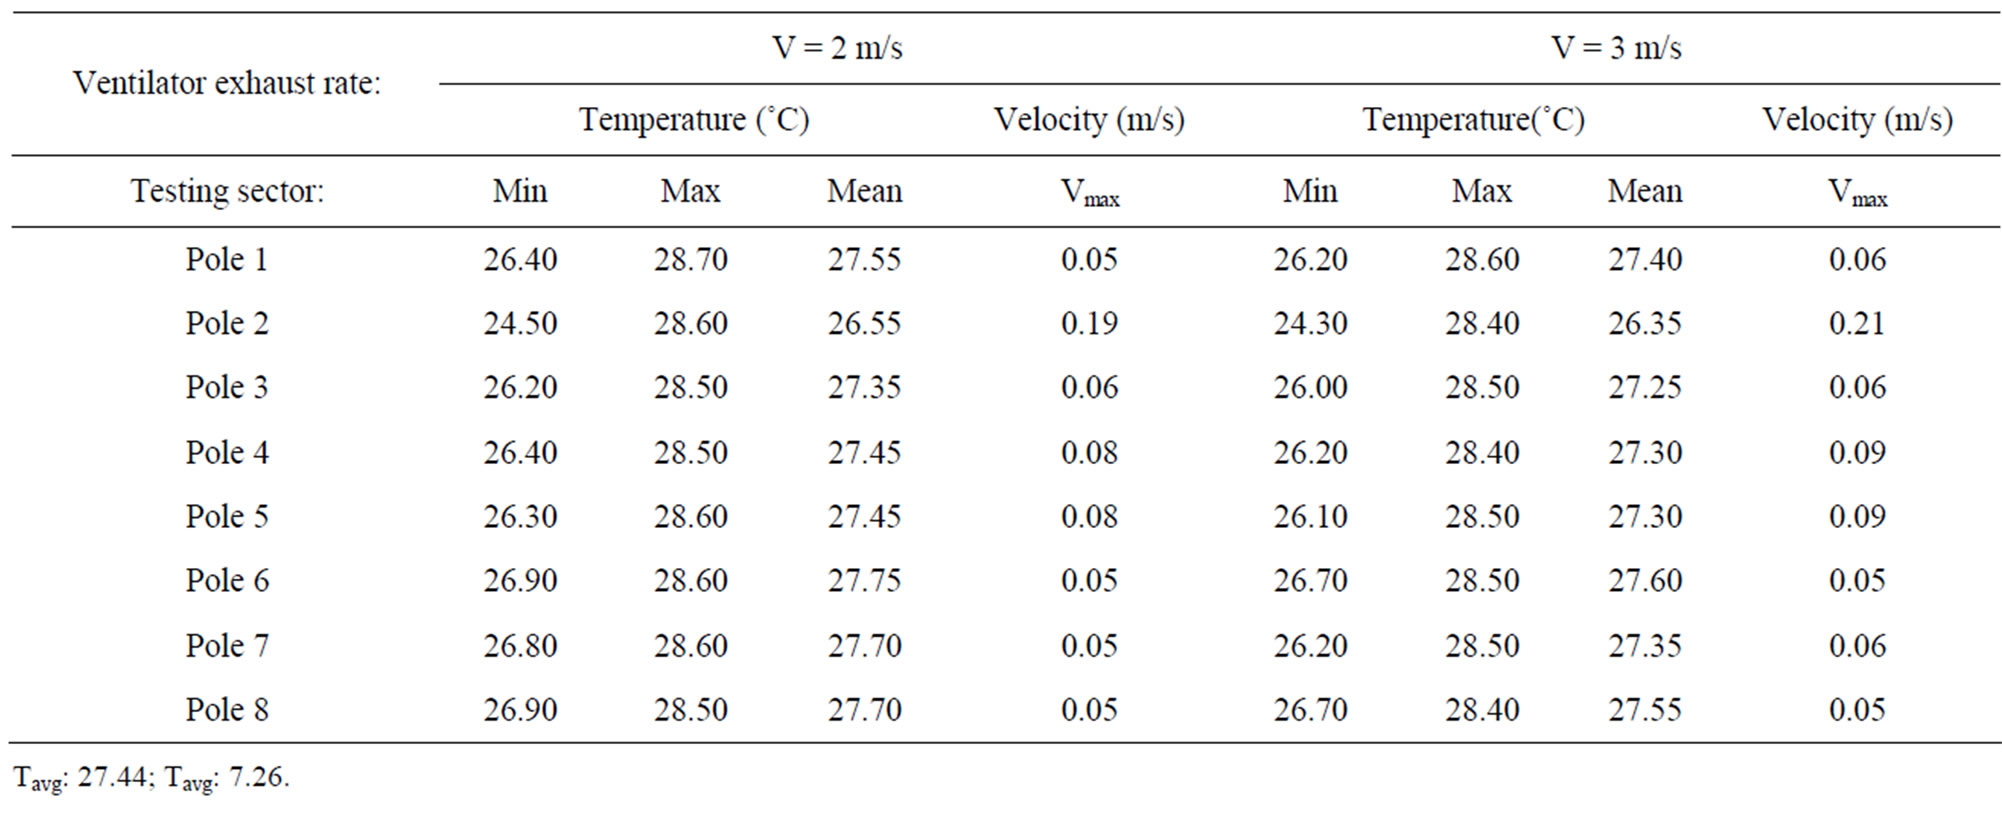
Table 1. Calculated air velocity and temperature for 0 - 2.5 m vertical height.
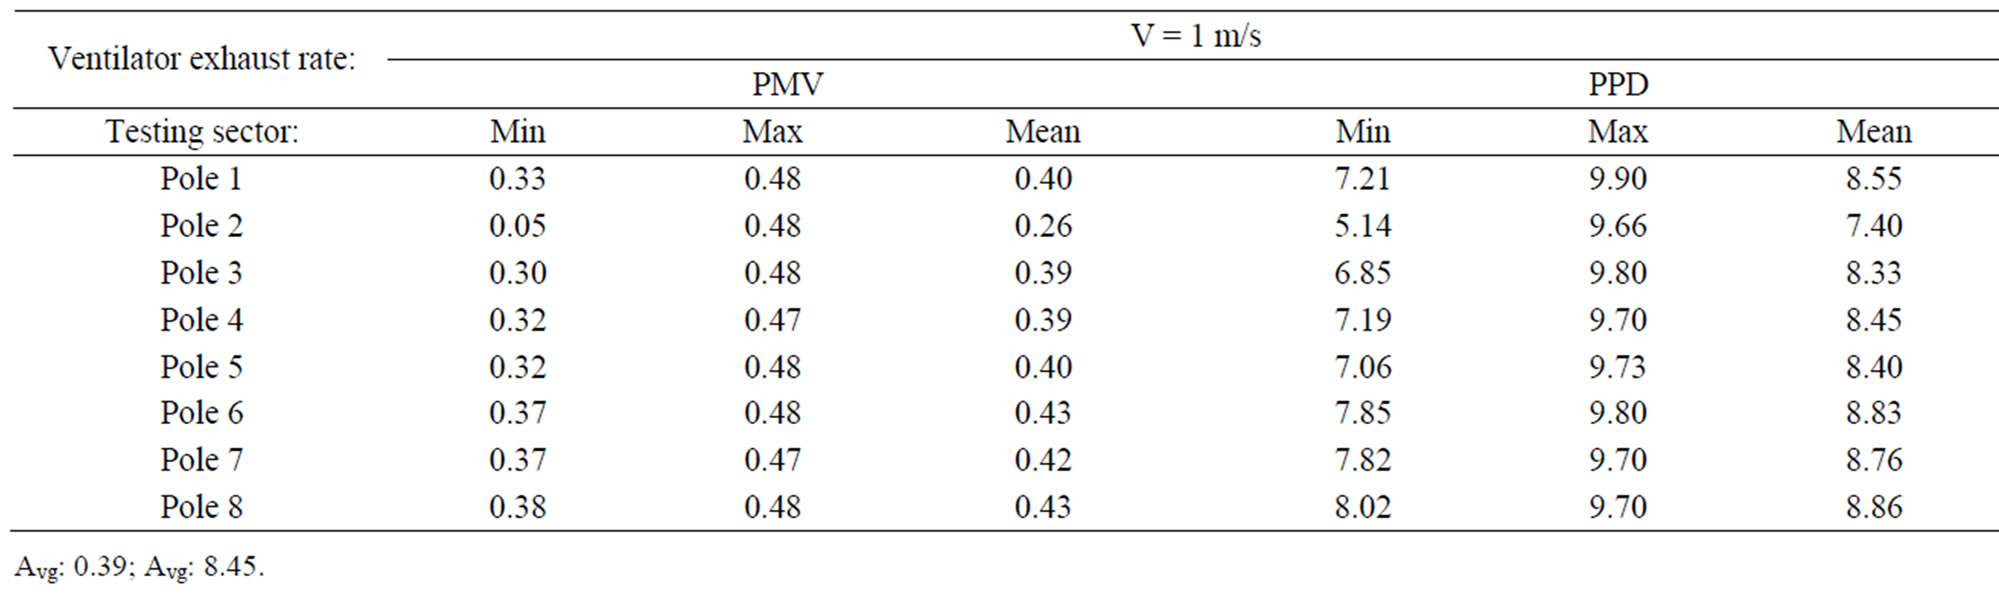
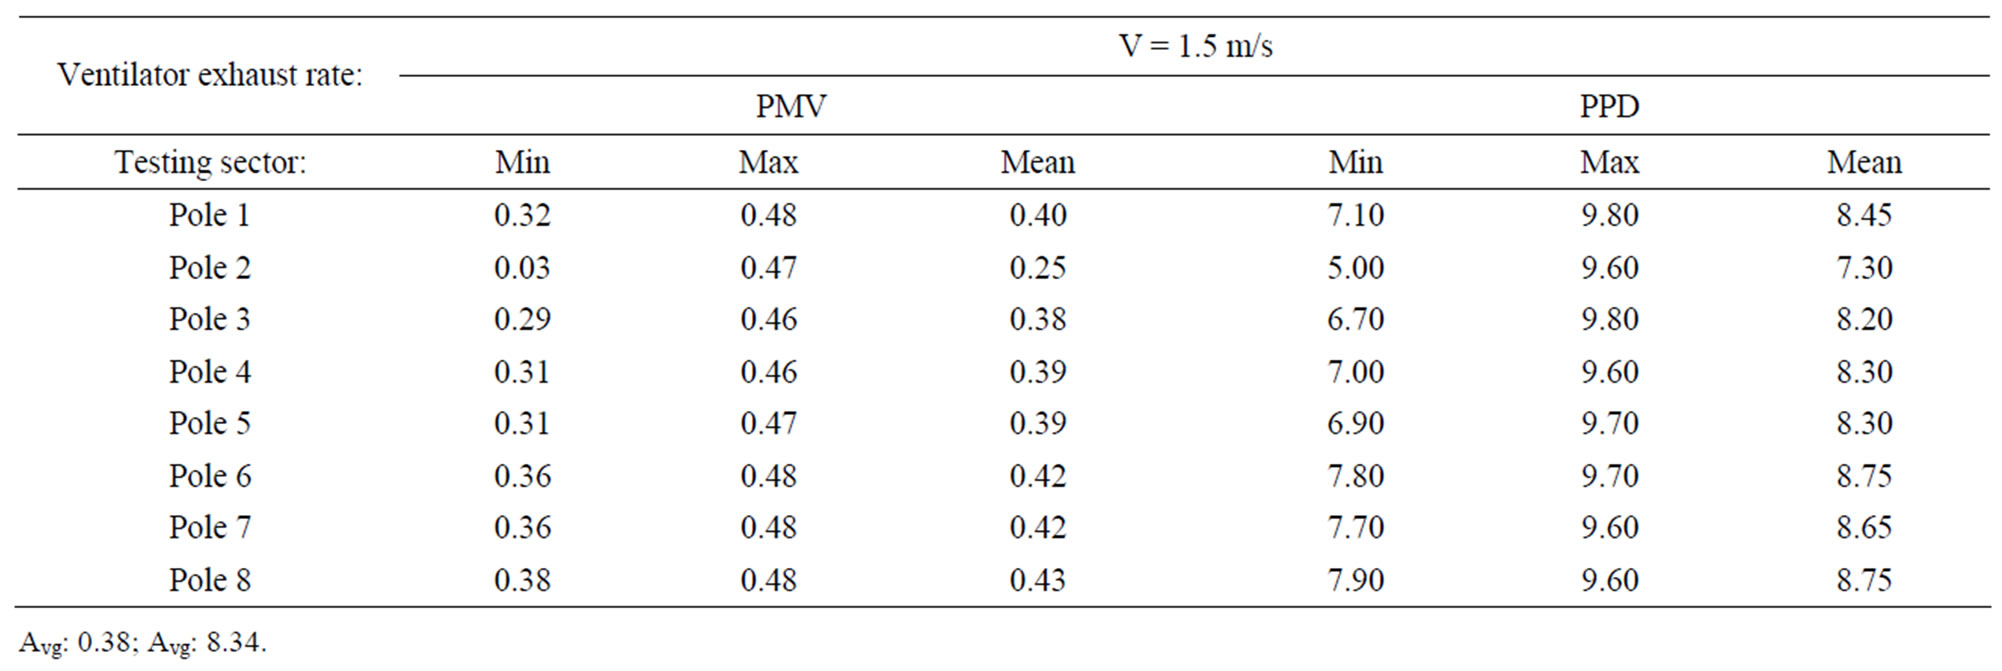
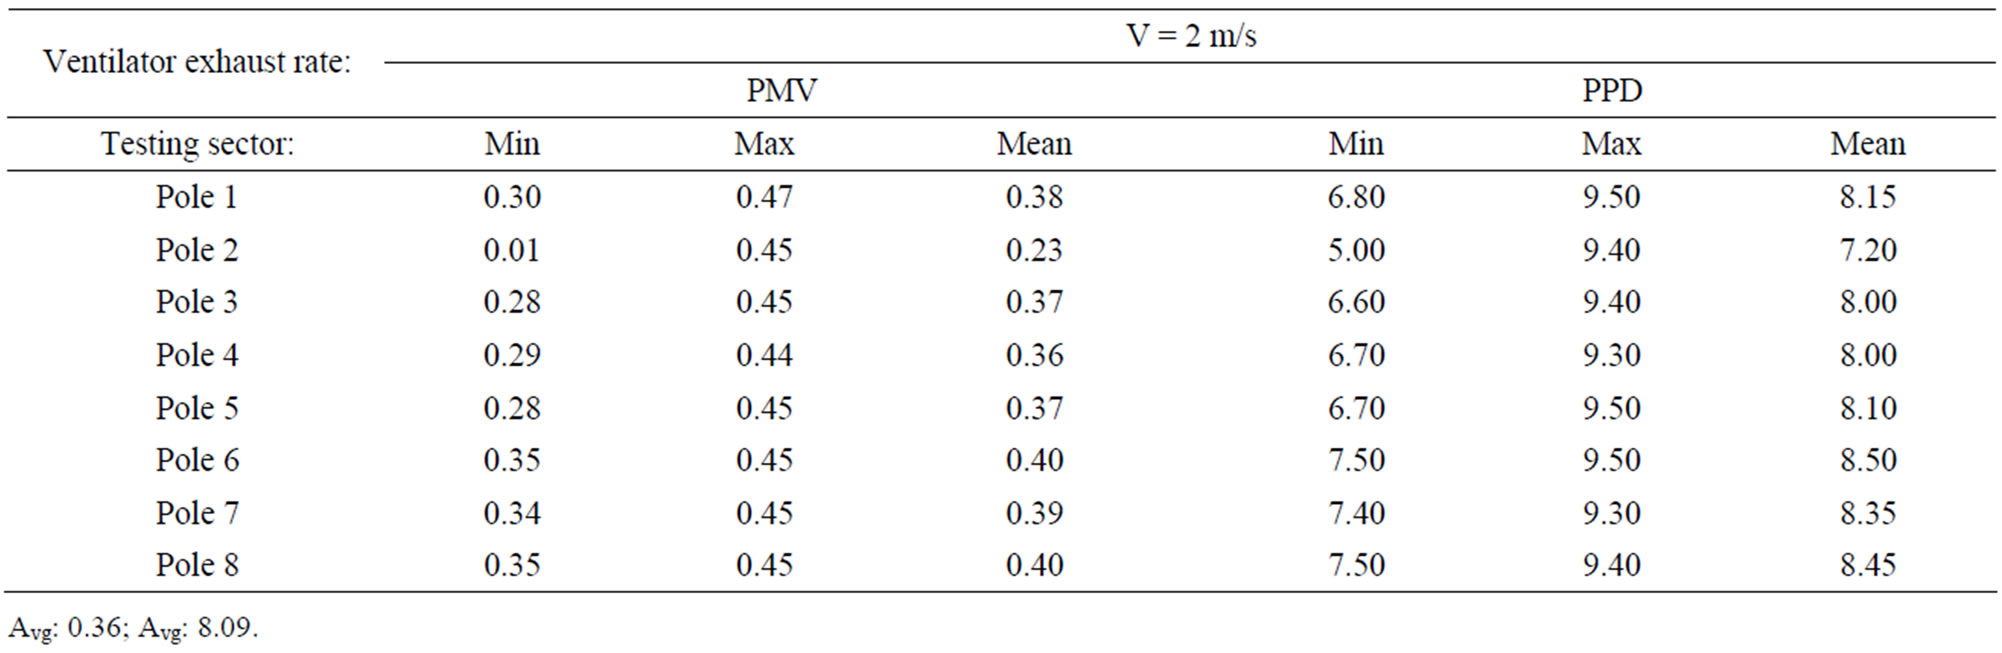
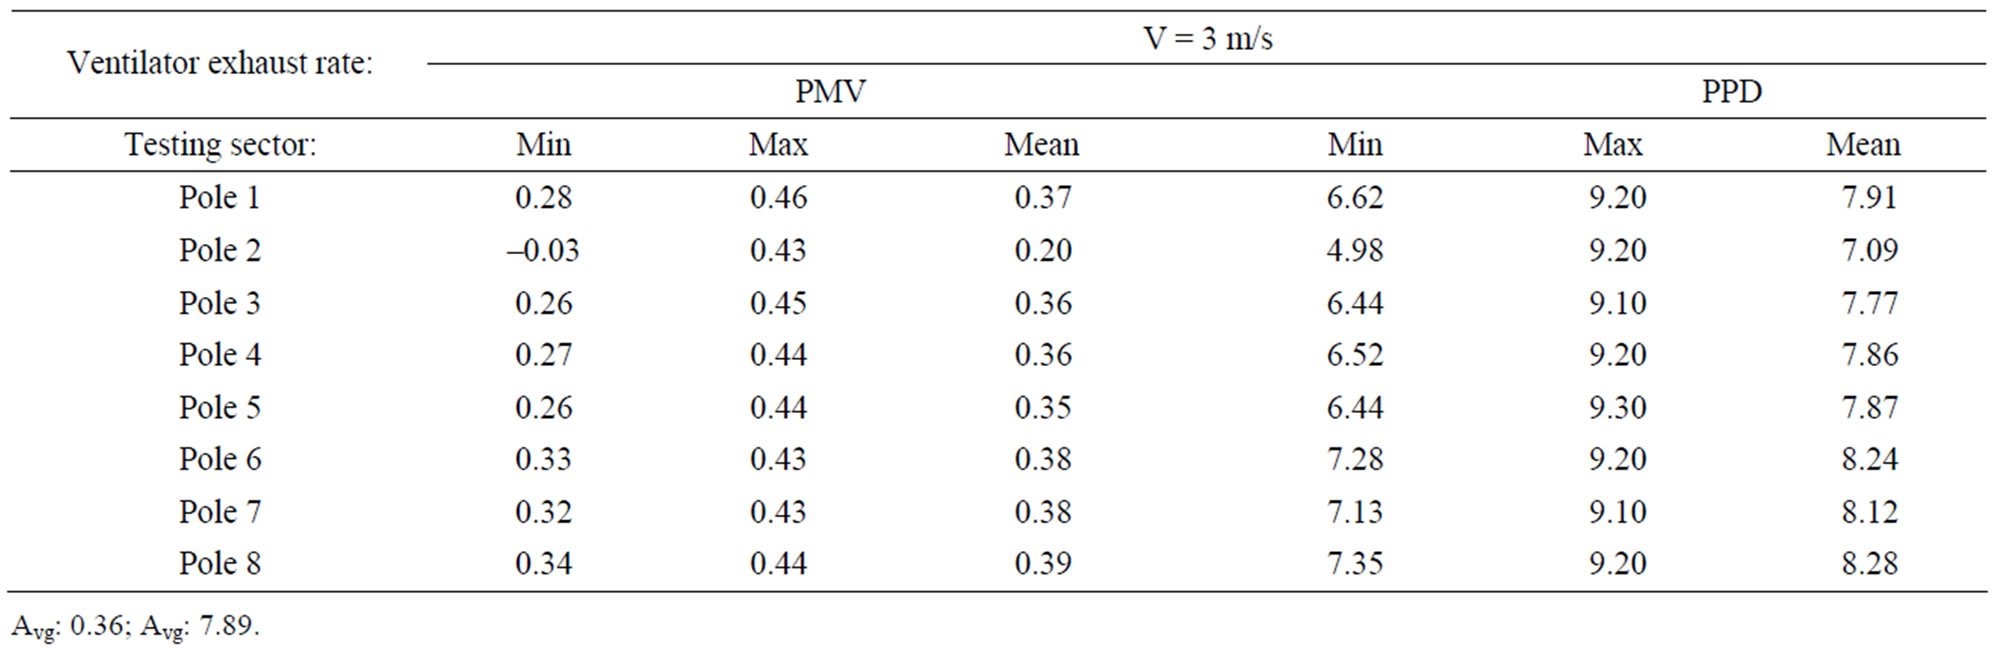
Table 2. Calculated PMV and PPD for 0 - 2.5 m vertical height.
efforts by researchers have been spent to develop the international standards for maintaining comfortable indoor environment. The common used standards are ASHRAE [39] and ISO 7730 [38]. In both standard, the PMV model uses a steady-state heat balance for the human body and it is related to 7 thermal sensation levels of the occupants who exposed to a certain environment. The PMV levels usually range between –3 and +3, where the negative levels stand for cold feeling and the positive values for hot feeling, 0 being a neutral or optimum level. PPD value indicates the variance in the thermal sensation of the occupants exposed to the same condition with dissatisfaction or discomfort. The ISO standard defines that an acceptable indoor thermal environment for general comfort is: –0.5 < PMV < 0.5 and PPD < 10% for a space where occupants have activity levels with metabolic rates between 1.0 and 1.3 and the thermal insulation worn is between 0.5 and 1.0 clo.
The present study defines the value for the metabolic or activity rate in present study was set at 1.2 met (70 W/m2) and clothes thermal resistance was taken equal to 0.55 clo (0.085 W/m2). Based on the data obtained from the various exhaust rate, the corresponding range of PMV and PPD vales are 0.39 - 0.35 and 8.45% - 7.89%, respectively. The calculated PMV-PPD index indicates that the indoor air quality is satisfactory for thermal comfort. The positive value of PMV shows the indoor environment is slightly warmer than the ideal condition but still within the acceptable range.
4.4. Improvement and Optimization
From the analysis it can be concluded that the installation of ventilator improves the indoor comfort level for all test cases. The standard room comfort requirement as per set out by ISO 7730 can be achieved. However the indoor temperature is still slightly warmer than the optimum condition. The result of this investigation also implies that to further enhance the room temperature for the optimum condition, higher exhaust rate are required. This can be done through a larger capacity ventilator or a hybrid roof top ventilator. Recent experiment investigation by Lai [40] reported a hybrid roof top ventilator that combines a small DC fan powered by PV cells can provide extra performance boost in the case of low wind speed but high sunlight.
5. Conclusion
The indoor air quality of a model house living room with installation of a rooftop turbine ventilator was simulated using CFD analysis. The results indicate that with the presence of the rooftop ventilator, the indoor air quality can meet the general requirements for comfort standards in various building codes. The results also showed that the comfort level increases with the exhaust rate induced by the turbine ventilator. This study presents a quantitative as well as qualitative study for indoor air quality that offered further scope to investigate the indoor air flow pattern inside a room. Thus a promising conclusion that can be drawn from this study is that CFD analysis could be used as a cost effective aid to future optimize the indoor air quality within a room.
REFERENCES
- B. O. Brooks and W. F. Davis, “Understanding Indoor Air Quality,” CRC Press Inc., Boca Raton, 1992.
- G. Pillgram Larsen, “300000 pa Skolebenken for a Bedre Innemijoet,” Statens Bygningstekniske Etat, Oslo, 1991.
- O. Seppanen and J. Palonen, “The Effects of Indoor Climate on National Economy in Finland in Billoon FIM,” FISIAW, SIY Rapportti 10, 1998.
- A. Pissasale and N. A. Ahmed, “Theoretical Calibration of a Five Hole Probe for Highly Three Dimensional Flow,” International Journal of Measurement Science and Technology, Vol. 13, 2002, pp. 1100-1107.
- A. Pissasale and N. A. Ahmed, “Examining the Effect of Flow Reversal on Seven-Hole Probe Measurements,” AIAA Journal, Vol. 41, No. 12, 2003, pp. 2460-2467. doi:10.2514/2.6845
- A. Pissasale and N. A. Ahmed, “A Novel Method of Extending the Calibration Range of Five Hole Probe for Highly Three Dimensional Flows,” Journal of Flow Measurement and Instrumentation, Vol. 13, No. 1-2, 2002, pp. 23-30.
- A. Pissasale and N. A. Ahmed, “Development of a Functional Relationship between Port Pressures and Flow Properties for the Calibration and Application of MultiHole Probes to Highly Three-Dimensional Flows,” Experiments in Fluids, Vol. 36, No. 3, March, 2004, pp. 422-436. doi:10.1007/s00348-003-0740-8
- S. Shun and N. A. Ahmed, “Utilizing Wind and Solar Energy as Power Sources for a Hybrid Building Ventilation Device,” Renewable Energy, Vol. 33, No. 6, 2008, pp. 1392-1397. doi:10.1016/j.renene.2007.07.017
- S. Shun and N. A. Ahmed, “Airfoil Separation Control Using Multiple Orifice Air Jet Vortex Generators,” AIAA Journal of Aircraft, Vol. 48, No. 6, 2011, pp. 1994-2002.
- N. Findanis and N. A. Ahmed, “The Interaction of an Asymmetrical Localised Synthetic Jet on a Side Supported Sphere,” Journal of Fluids and Structures, Vol. 24, No. 7, 2008, pp. 1006-1020. doi:10.1016/j.jfluidstructs.2008.02.002
- N. Findanis and N. A. Ahmed, “Three-Dimensional Flow Reversal and Wake Characterisation of a Sphere Modified with Active Flow Control Using Synthetic Jet,” Advances and Applications in Fluid Mechanics, Vol. 9, No. 1, 2011, pp. 17-76.
- N. A. Ahmed, “Wind Driven Natural-Solar/Electric Hybrid Ventilators,” Wind Power, Section D: The Environmental Issues, In-Tech Organization, Austria, 2010.
- J. Lien and N. A. Ahmed, “Wind Driven Ventilation for Enhanced Indoor Air Quality,” Chemistry, Emission, Control, Radiaoactive Pollution and Indoor Air Quality, In-Tech Organization, Austria, 2011.
- N. Findanis and N. A. Ahmed, “Wind Tunnel ‘Concept of Proof’ Investigations in the Development of Novel Fluid Mechanical Methodologies and Devices,” Wind Tunnels and Experimental Fluid Dynamics Research, In-Tech Organization, Austria, 2011.
- C. Wu and N. A. Ahmed, “Numerical Study of Transient Aircraft Cabin Flowfield with Unsteady Air Supply,” AIAA Journal of Aircraft, Vol. 48, No. 6, 2011, pp. 1994- 2002.
- N. A. Ahmed, R. L. Elder, C. P. Foster and J. D. C. Jones, “A Novel 3D Laser Anemometer for Boundary Layer Studies,” 3rd International Symposium on Laser Anemometry, The Fluids Engineering Division, Vol. 55, pp. 175-178.
- N. A. Ahmed, R. L. Elder, C. P. Foster and J. D. C. Jones, “Miniature Laser Anemometer for 3D Measurements,” Journal of Measurement Science and Technology, Vol. 1, No. 3, 1990, pp. 272-276. doi:10.1088/0957-0233/1/3/012
- N. A. Ahmed and D. J. Wagner, “Vortex Shedding and Transition Frequencies Associated with Flow around a Circular Cylinder,” AIAA Journal, Vol. 41, No. 3, 2003, pp. 542-544. doi:10.2514/2.1979
- N. A. Ahmed, S. Hamid, R. L. Elder, C. P. Foster, J. D. C. Jones and R. Tatum, “Fibre Optic Laser Anemometry for Turbo Machinery Applications,” Optics and Lasers in Engineering, Vol. 15, No. 2-3, 1992, pp. 193-205.
- R. G. Simpson, N. A. Ahmed and R. D. Archer, “Near Field Study of Vortex Attenuation Using Wing Tip Blowing,” The Aeronautical Journal, Vol. 102, 2002, pp. 117- 200.
- R. G. Simpson, N. A. Ahmed and R. D. Archer, “Improvement of a Wing Performance Using Coanda Tip Jets,” AIAA Journal of Aircraft, Vol. 37, No. 1, 2000, pp. 183-184. doi:10.2514/2.2579
- A. Gatto, N. A. Ahmed and R. D. Archer, “Investigation of the Upstream End Effect of the Flow Characteristics of a Yawed Circular Cylinder,” The RAeS Aeronautical Journal, Vol. 104, No. 1033, 2000, pp 253-256.
- N. A. Ahmed and R. D. Archer, “Testing of a Highly Loaded Horizonatal Axis Wind Turbines Designed for Optimum Performance,” International Journal of Renewable Energy, Vol. 25, No. 4, 2002, pp. 613-618. doi:10.1016/S0960-1481(01)00079-9
- N. A. Ahmed and R. D. Archer, “Performance Improvement of a Bi-Plane with Endplates,” AIAA Journal of Aircraft, Vol. 38, No. 2, 2001, pp. 398-400. doi:10.2514/2.2777
- N. A. Ahmed and J. Goonaratne, “Lift Augmentation of a Low Aspect Ratio Thick Wing at a Very Low Angle of Incidence Operating in Ground Effect,” AIAA Journal of Aircraft, Vol. 39, No. 2, 2002, pp. 381-384.
- J. Yen and N. A. Ahmed, “Parametric Study of Dynamic Stall Flow Field with Synthetic Jet Actuation,” Journal of Fluids Engineering, Transactions of the ASME, Vol. 134, No. 7, 2012, Article ID: 071106.
- Leadership in Energy & Environmental Design (LEED), Update December 2009.
- S. J. Lien and N. A. Ahmed, “Effect of Inclined Roof on the Airflow Associated with a Wind Driven Turbine Ventilator,” Energy and Building, Vol. 43, No. 2-3, 2011, pp. 358-365.
- M. Bojic, F. Yik and T. Y. Lo, “Locating Air-Conditioners and Furniture inside Residential Flats to Obtain Good Thermal Comfort,” Energy and Buildings, Vol. 34, No. 7, 2002, pp. 745-751. doi:10.1016/S0378-7788(01)00143-8
- W. N. Hien, W. Liping, A. N. Chandra, A. R. Pandey and X. L. Wei, “Effects of Double Glazed Facade on Energy Consumption, Thermal Comfort and Condensation for a Typical Office Building in Singapore,” Energy and Buildings, Vol. 37, No. 6, 2005, pp. 563-572. doi:10.1016/j.enbuild.2004.08.004
- A. Stamou and I. Katsiris, “Verification and Application of a CFD Model for the Evaluation of Thermal Comfort in Office Spaces,” Building and Environment, Vol. 41, No. 9, 2006, pp. 1171-1181. doi:10.1016/j.buildenv.2005.06.029
- T. Karimipanah, H. B. Awbi, M. Sandberg and C. Blomqvist, “Investigation of Air Quality, Comfort Parameters and Effectiveness for Two Floorlevel Air Supply Systems in Classrooms,” Building and Environment, Vol. 42, No. 2, 2007, pp. 647-655. doi:10.1016/j.buildenv.2005.10.016
- S. J. Lien and N. A. Ahmed, “Numerical Simulation of Rooftop Ventilator Flow,” Building and Environment, Vol. 45, No. 8, 2012, pp. 1808-1815.
- Q. Chen, “Performance Prediction for Buildings: A Method Overview and Recent Applications,” Building and Environment, Vol. 44, No. 4, 2009, pp. 848-858. doi:10.1016/j.buildenv.2008.05.025
- “PHOENICS 3.2 Software Package,” CHAM, London, 1999.
- “AEA Technology,” CFX-5.5.1 User Guide, 8.19, Harwell, Didcot, Oxfordshire, OX110RA, 2002.
- “Fluent User’s Guide,” Version 6.3, Fluent Inc., Lebanon, 2004.
- Barbason and Reiter, “2010 ISO International Standard 7730. Moderate Thermal Environment: Determination of the PMV and PPD Indices and Specifications of the Condition for Thermal Comfort,” International Organization for Standardization, Geneva, 2005.
- ASHRAE, “ASHRAE Handbook Fundamentals,” American Society of Heating Refrigerating and Air Conditioning engineers, Atlanta, 1997.
- C. Lai, “Prototype Development of the Rooftop Turbine Ventilator Powered by Hybrid Wind and Photovoltaic Energy,” Energy & Buildings, Vol. 38, No. 3, 2006, pp. 174-180. doi:10.1016/j.enbuild.2005.06.004