Atmospheric and Climate Sciences
Vol.4 No.2(2014), Article ID:44670,12 pages DOI:10.4236/acs.2014.42023
Extremely Cold and Warm Days in the Spanish Central Plateau: Analysis of Its Evolution from 1961 to 2010
Angel L. Labajo1, Quintín Martín2, Juan Labajo3, Moises Egido1*, José L. Labajo1
1Departamento de Física General y de la Atmósfera, Universidad de Salamanca, Salamanca, Spain
2Departamento de Estadística, Universidad de Salamanca, Salamanca, Spain
3Grupo Geoclima, Universidad Autónoma de Madrid, Madrid, Spain
Email: *moi95@usal.es
Copyright © 2014 by authors and Scientific Research Publishing Inc.
This work is licensed under the Creative Commons Attribution International License (CC BY).
http://creativecommons.org/licenses/by/4.0/


Received 22 January 2014; revised 20 February 2014; accepted 27 February 2014
Abstract
From anomalies of daily data of maximum and minimum temperatures, that have been obtained as difference between the real data of every day and the average data of the corresponding day of the year in each of the 14 observatories of the Spanish Central Plateau (8 in North subplateau and 6 in the South subplateau) between 1961-2010, the extremely cold and warm days are determined, throughout all the year, in all the study area and the two different sub areas. We consider a day as an extremely cold day (ECD) if achieves simultaneously the following conditions: the anomaly of minimum temperature of the day is lower than the value of the P05 percentile of the series of daily anomalies of minimum temperature, and the value of the anomaly of daily maximum temperature is lower, as well, than the P05 percentile of the corresponding series of anomalies. The values of the thresholds determined by these percentiles are obtained considering the complete anomalies daily series of temperature for all the study regions. In order to establish the extremely warm days the methodology is the same but the conditions are: the anomaly of minimum temperature of the day is greater than the value of the P95 percentile of the series of daily anomalies of minimum temperature, and the value of the anomaly of daily maximum temperature is greater as well than the P95 percentile of the corresponding anomalies series. Once the extremely warm and cold days are determined, throughout the year in the period of time considered, for each zone, the corresponding series of annual frequencies are obtained. The analysis of tendency of these series indicates that in all the cases the tendency of the frequency of the extremely cold days is decreasing. Considering a linear model for the temporary behavior of the frequency, the reduce is of the order of 1 day every 10 years. In the case of the extremely warm days its annual frequency presents an increasing tendency, which indicates that the number of extremely warm days per year has been increased during the studied time interval. In agreement with the linear model of behavior, the increase is, approximately, of the order of 1 day per decade.
Keywords:Cold Day; Warm Day; Frequency; Trend; Linear Model

1. Introduction
Extreme weather events like hurricanes, heavy rains that cause serious floods, the extremely high and extremely low values of temperature have taken place in all the times, having a negative effect on the normal development of human activities. These events are responsible, in many cases, of dangerous situations that cause very important damages in different fields, affecting the security of people that could even cause the loss of human lives. This indicates the need to establish the temporary evolution of the frequency of these events related with the extreme values of climatic variables. In the last decades researches has been developed to establish the annual and monthly average behavior models of the climatic variables that more affect the human activity [1] -[6] . The results of the investigations clarify that in the last half of 20th century, and in the first years of the 21th century, is detected, at a global scale, an increase in the value of the average temperature of the air, that is also reflected on regional scale [6] .
The report of the Intergubernamental Panel of Climatic Change on the evaluation of the Climate Change [7] indicates the need to study the behavior of the extreme events of the climate different elements to establish its possible incidence in the observed average values time evolution. In that sense studies have been develop in order to try to establish the contribution of these extreme events to the global modification of the Earth climate [8] -[12] .
In the case of the temperature, as the study of the behavior of the extreme warm and cold events has an especial importance concerning to the environments in which the human activity is developed, the incidence of the extreme events of temperature could be established by the temporary evolution of the annual frequency of daily maximum and minimum temperatures. In this sense, several researches have been developed on different space scales [13] -[18] .
Generally, in the bibliography considered, the studies of behavior of the different climatic variables, in the extreme events cases, are developed at a certain time for the corresponding variable (pressure, precipitation, temperature, wind speed, etc.). In particular for the case of the temperature the highest extreme events are studied in the warm period, and lowest in the cold period, based on the observation data, because it is relatively difficult to determine the highest events at the cold time of the year and the lowest at the warm time of the year, since this would require to establish a unique criterion in exclusive function of the maximum or minimum temperatures.
However, using anomalies (difference, day to day, between the observed value and the calculated average value for the day of the corresponding year) instead of observation data, it is possible to establish a criterion to determine those extreme events in general throughout all the year with no need to determine per seasons, since this would require, in the case of considering the data directly observed, to establish conditions for the threshold values of the variables. Considering the anomalies the threshold values for the complete year and for each season of the year are nearly equal. So it is not necessary to work out those thresholds.
In this work we will try to establish, by using maximum and minimum temperature anomalies, the annual frequency trend of the extremely cold and warm days obtained in the Spanish Central Plateau between 1961 and 2010.
2. Data and Methodology
In previous works [13] -[16] [19] [20] the temporal behavior of the highest annual frequency of daily maximum and minimum temperatures has been analyzed. In this work we are going to study the temporary evolution of the annual frequency of situations of extreme cold and heat, for which it is necessary to define what is understood by extremely cold day (ECD) and extremely warm day (EWD).
The temperature thresholds, from which the values are considered as extreme, can be worked out in different ways. Normally researchers have adopted the criterion of percentiles to define them, as much in the case of the temperature and for determining the thresholds of extreme values of other climatic variables [10] -[15] [19] [21] .
In general, days considered very cold are those in which the difference between minimum temperature and the average are lower than the threshold indicated by the P10 percentile, P05 percentile or, in the more demanding analyses, P01 percentile. In the same way days considered very warm are those in which the difference between maximum temperature and the average are greater than the threshold marked by the P90 percentile, P95 percentile or, in the more demanding analyses, P99 percentile [16] . However, to define these days more exactly it seems that is not enough that the maximum and minimum temperatures fulfill the requirements that have just been explained. In the case of EWD minimum temperature values should be greater also than the thresholds established by the same percentiles for the maximum temperature, and in the case of ECD the minimum temperature values will have to be also lower than the thresholds established for the same percentiles for the maximum temperature.
In this work the data series used are the anomalies for maximum daily temperature (ATMAD) and minimum daily temperature (ATMID). These series are obtained from the temperature daily measurements, as a difference between its daily extreme values and the corresponding average values for each day of the year, worked out in the interval 1961-1990:

So the seasonal variation and the altitude difference of the observatories, where initial data series has been obtained, are filtered. The quality and homogeneity of the data has been checked in their origin in previous works. Moreover, using anomalies, the inherent errors, due to some false data not detected in the observation series, are minimized.
The criterion we have chosen for a extremely cold day (ECD) is that the corresponding values of ATMID and ATMAD should be lower than the thresholds established by the P05 percentile for both data series, and we consider a day as extremely warm when the corresponding values of ATMAD and ATMID are greater than the thresholds established by the P95 percentile. The reason for choosing these threshold values, as is indicated in previous works [10] -[12] , is the definition of the triaverage statistical parameter. This is an average obtained with the series values, once the values under the threshold established by the P05 percentile and the values greater than the threshold established by the P95, are removed. So we remove the strong influence the extreme values have in the average than will not be influenced by this effect. That allows considering the excluded values as extreme values.
The area under study is the Spanish Central Plateau. This zone covers an area between the latitudes 38˚01´N and 43˚14´N and the lengths 0˚54´W and 06˚07´W (figure 1).
The initial data used for that work, provided by the State Agency of Spanish Meteorology (AEMET), are the maximum and minimum daily temperature data obtained in the weather stations of Ávila, Burgos, León, Salamanca (Matacán), Segovia, Soria, Valladolid (Villanubla), Zamora, Los Llanos (Albacete), Ciudad Real, Cuenca, Toledo, Madrid (Retiro) and Barajas (Madrid). From that data base, according with the previous definition, daily anomalies of Maximum temperature (ATMAD) and daily of minimum temperature (ATMID) are obtained.
From these anomalies series the regional series ATMAD and ATMID are going to be worked out for the Spanish Central Plateau and each sub plateau, as mean values series of each weather station, according to the inverse distance method (Jones y Hulme, 1996).
From the ATMAD and ATMID data series the P05 and P95 thresholds are established in each period of time, cold (November, December, January and February) and warm (June, July, August and September). The results are shown in table 1.
The data shown in table 1 allow us to establish that the differences between the ATMAD and ATMID thresholds in each season of the year and the whole year are small, of the order of 0.1˚C.
That determine, for establishing ECD and EWD in the central Plateau and in each sub plateau, we can consider the thresholds obtained for the complete data series. These values are shown in table 2.
3. Results
From the thresholds obtained before and those corresponding to regional series of daily anomalies of maximum and minimum temperatures, ATMAD and ATMID, in the Spanish Central Plateau and in each sub plateau, the extremely cold days and warm days series are obtained in each zone.

Figure 1. Study zone.

Table 1. ATMAD and ATMI thresholds, determined by P05 and P95 percentiles, in each area and sub area, in each period of time and the whole year.
Table 2. Values of thresholds of the extreme highest and lowest in ATMAD and ATMID throughout the year for the period 1961-2010.
The EWD series are obtained with the cases in which the ATMAD and ATMID values are greater than the P95 threshold. In the Spanish Central Plateau ATMAD > 6.03˚C and ATMID > 4.64˚C, in the north sub plateau ATMAD > 6.51˚C and ATMID > 5.07˚C and in the south sub plateau ATMAD > 5.93˚C and ATMID > 4.69˚C.
In the same way ECD series are obtained with the cases in which, simultaneously, both values of ATMAD and ATMID series are lower than the P05 threshold. In the Central Plateau ATMAD < −6.11˚C and ATMID < −4.73˚C, in the north sub plateau ATMAD < −6.28˚C and ATMID < −5.02˚C and in the south sub plateau ATMAD < −6.10˚C and ATMID < −4.75˚C.
EWDs and ECDs series analysis indicates that these extreme days are observed throughout the whole year. The total numbers of extremely warm and extremely cold days in each of the months of the year, between 1961- 2010, are shown in table 3.
The data displayed in table 3 indicate that nearly throughout the entire year can be seen days that accomplish the conditions to be considered as EWDs and ECDs. The months with more EWDs in the Central Plateau are May and June (56 and 39 days). In the North and South subplateau the months with more EWDs are the same with 46 and 34 days and 40 and 34 days respectively.
In the case of the ECDs, the data that appear in table 3 indicate that the number of days throughout the year fluctuate much less than the EWDs. In the Central Plateau the number of ECDs ranges from 9 days in July to 28 days in February, in the North subplateau ranges from 11 days in November to 29 days in January, and in the South subplateau between 5 days in November and 26 in March.
On the other hand, the years with the largest number of EWDs in the Central Plateau are 1964 (18 days); 2005 (14 days), 2003-2006 (13 days); 2001-2009 (10 days). The years with more EWDs in the North subplateau are 2003 (16 days); 1987 (13 days); 1964-2005 (11 days); 2001-2006 (10 days). In the South subplateau the years with more days of extreme heat are 2009 (16 days); 2005 (14 days); 2006 (10 days).
In the case of the ECDs, the years with more of ECDs in the Central Plateau and in the period under study, are 1971 (16 days), 1984 (14 days), 1965 (12 days), 1983 and 1985 (10 days). In the North subplateau are 1971 (17 days), 1984 (13 days), 1974, 1978, 1983 and 2010 (11 days), 1965, 1969 and 1977 (10 days), and in the South subplateau the years with the largest number of extremely cold days are 1971 (19 days), 1965, 1984 and 1985 (10 days).
After that the annual frequency of extremely warm days (FEWD) and cold days (FECD) series are obtained for the whole year and in the cold and warm season, in the central plateau and in each sub plateau. Figure 2 and Figure 3 show the temporal evolution of FEWD y FECD per year.
The EWDs number, during the time period considered is 179 in the central plateau, 208 in the north sub plateau and 129 in the south sub plateau. The months with higher EWDs frequency are May, more than 40 cases, and June, more than 30. In the North subplateau the years with higher number of EWDs are 2003 (16 days) and 1987 (13 days), in the South subplateau are 2009 (16 days) and 2005 (14 days), and in the Central Plateau 1964 (18 days) and 2005 (14 days). The number of years without EWDs is higher in the south sub plateau (14 years) than in the north sub plateau (8 years).
In the case of the ECDs, when the whole year is considered, the total number in the Central Plateau during the period of time considered (1961-2010), is 234, in the North sub plateau is 266, and in the South sub plateau 203. The years with higher ECDs number in the North subplateau are 1971 (17 days) and 1984 (13 days) that are the same in the Central Plateau. In the South sub plateau the higher ECDs frequencies corresponds to 1971 (19 days) and 1965, 1984 and 1985 (10 days). The number of years without ECD, throughout the complete period of time, is similar in both sub areas, in the North sub plateau are 5 and 7 in the South sub plateau.
Figure 4 and Figure 5shows the FEWD and FECD temporal evolution during the period of time considered, in the warm season (June, July, August and September).
In the warm season (from the 1st of June to 30th of September) the total number of EWDs is 131 in the North sub plateau, 113 in the South sub plateau and 116 in the complete studied area. The year with higher EWDs frequency in the North subplateau is 2003 with 17 cases. In the South subplateau the higher frequency corresponds to 2005 (14 cases) and 2003 (13 cases). In the central plateau the year with higher EWDs frequency is 2003 (15 cases) and 2005 (11 cases). There are years without EWDs in the three areas, but is much more frequent in the South subplateau.
In the warm season ECDs can also be found in a relatively high number, but always lower than EWDs in the areas considered. In the North subplateau the ECDs number is 76, in the South subplateau 80 and in the Central Plateau 80. The higher ECDs frequency is detected in the same year, 1977, in the central plateau (CP) and the
Table 3 . Total EWDs and ECDs in each of the months of the year, in the study period.

Figure 2. Temporal evolution of the extremely warm days detected in the year, during the considered period of time and in each area. The straight line is the trend.
North subplateau (NS) and South subplateau (SS). In the NS the frequency is 8 cases, in the SS 14 and in the CP 9.
Figure 6 and Figure 7 show the FEWDs and FECDs temporal behavior during the period of time considered and in the cold period (January, February, November and December).
In the cold season, the EWDs are also relatively high. During the period of time studied the total number of these days is 65 in the NS, 26 in the SS and 41 in the CP. The years with higher EWDs frequency are 1986 (7 days) followed by 1990 and 2003 (6 days) in the NS. In the SS and CP, the higher EWD frequency corresponds to 1996 (7 days).
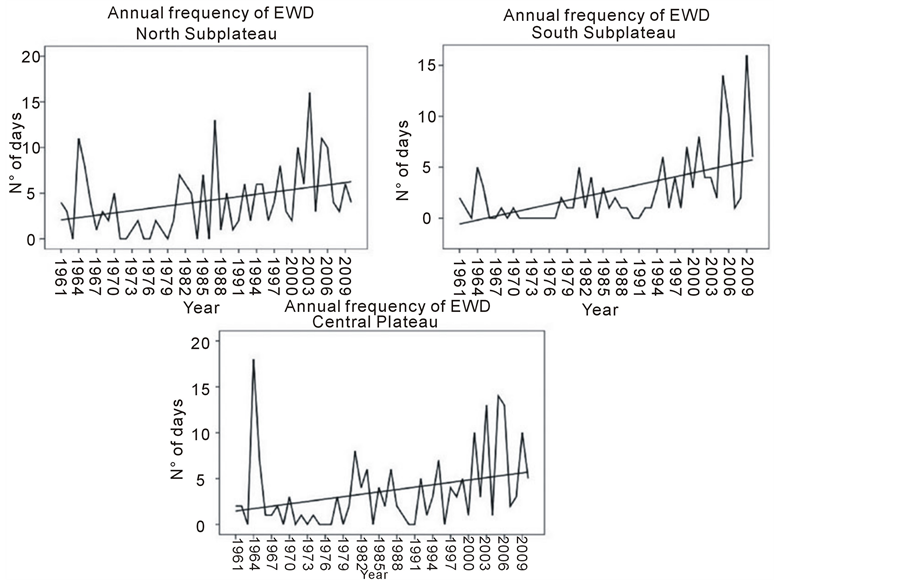
Figure 3. Temporal evolution of the extremely cold days per year, during the considered period of time and in each area. The straight line is the trend.

Figure 4. Temporal behavior of annual frequency of the EWDs in the warm season, during the complete period of time and in each study zones.

Figure 5. Temporal behavior of annual frequency of the ECDs in the warm season, during the complete period of time and in each study zones.

Figure 6. Temporal evolution of annual frequency of the EWD in the cold season, during the complete period of time and in each study areas.

Figure 7. Temporal evolution of annual frequency of the ECD in the cold season, during the complete period of time and in each study areas.
Regarding with ECDs, its number is nearly the double than the EWDs, 131 in the NS, 82 in the SS and 105 in the CP. The years with higher frequency in the NS are 1963 (11 days) and 1971 and 2010 (9 days). In the SS the ECD maximum annual frequency corresponds to 1971 (10 days) followed by 1963 (9 days) and 1983 (8 days). In the CP the years with higher frequency of ECDs are 1963 (10 days), 1971 (9 days) and 1983 (8 days).
The Spearman test [14] is applied to de FEWDs y FECDs series in order to check if the trend, showed by the trend lines of the figures, are significant, at least a 95% of significant level. Table 4shows the results obtained.
The results indicate that, for the whole year, exits an increasing trend of the EWDs frequency and a decreasing trend of the ECDs frequency with a significance level in all the areas considered higher than 95%, and in some cases higher than 99%. In the warm season, the EWDs frequency shows an increasing trend in all areas, but the ECDs frequency only shows a significant trend in the SS. In the cold season no area shows a significant trend.
If we consider linear model for the frequency trend of ECDs and of EWDs:

(a year is considered as a unit). The results shown in table 5 are obtained. Considering the EWDs and ECDs annual frequency in the whole year, the frequency of EWD increase is of 1 day per decade order in the study area and in both sub areas and the decrease in the ECDs frequency could be as well of the order of 1 day per decade. Nor for the warm period or the cold period the increasing or decreasing of the frequency per decade is lower, especially in the cold period in which frequency is lower than 0.4 days per decade. In the warm season the EWD frequency increments are more similar than the ones obtained for the whole year but the decrease of the ECD frequency per decade is quite lower.
In general, we can establish, for a linear model of time behavior, that the EWDs annual frequency is increased some fraction of a day every 10 years, while for the ECDs a decrease per decade is observed much less significant in the warm period than in the cold period. In the study area, during the period of time considered, the EWDs frequency has increased and the ECDs frequency has decreased.
Table 4. FEWDs and FECDs trends, in each study area and in all the periods of time considered throughout the year.
I = Increasing trend, D = Decreasing trend, NT = No Trend. Significance level *≥ 95%; **≥99%.
Table 5 . Annual frequency EWD and ECD variation in days per decade, in the study area and in both subareas.
4. Conclusions
• The number of ECDs per year is greater in the North subplateau than in the South subplateau. That seems to be logical given the differences in the geographical features between both subplateus. On average, the annual frequency of ECDs in the North subplateau, during the period of time under study, is 5.3 days per year and in the South of 4.1 days per year. In the Central Plateau the average annual rate of ECDs is 4.7 days/year. Also the EWDs number throughout the year, in the period of time considered, is greater in the North subplateau than in the South subplateau. On average the annual frequency of EWDs in the North subplateau is 4.2 days per year and in the south subplateau 2.6 days per year. In the Central Plateau the average annual frequency is 3.6 days per year.
• On the other hand, the annual frequency of the ECDs throughout the year presents a relatively large variability during the period of time considered. Cases of minimum values of ECDs (0 days per year) that are observed in the North subplateau (5 cases) are less than those observed in the South subplateau (7 cases). In the EWDs case the annual frequency has a high variability throughout the year. Cases of minimum values of ECDs (0 days per year) that are observed in the North subplateau (8 cases) are less than those observed in the South subplateau (14 cases).
• In the Central Plateau there is an absolute maximum of ECDs per year in 1971 (16). The absolute maximums in the North and South subplateus have a frequency of 17 days and 19 days respectively. In addition, in the Central Plateau and in the Northern and Southern subplateaus there is a secondary maximum in 1984. Regarding to the EWDs, in the central plateau there is an absolute maximum in 1964 (18) and in the North and South subplateaus there is an absolute maximum in 2003 and 2009. In both cases the frequency is 16 days. Moreover there are secondary maximums in the North and south subplateus in 1987 and 2005 respectively.
• All of this indicates that the behavior of the annual frequency of ECDs in both subplateus is only slightly different. On the other hand the results seem to indicate that, although the absolute maximum of frequency of ECDs is slightly higher in the South subplateau than in the North, the South subplateau is slightly warmer than the North.
• Concerning to the temporal evolution of the ECDs, Spearman test results suggest that, in the area under study and the two sub-areas, there are decreasing trends in the annual frequency of ECDs, which are significant at confidence level up to 98%. This trend can be assessed in a decrease of 0.9 days per decade in the North subplateau, 1.0 days per decade in the South sub-plateau and 0.9 days per decade in the Central Plateau. Concerning to the temporal evolution of the EWDs, the Spearman test results indicate that, around the zone under study and both subzones, there is an increasing trend in the ECDs frequency, which are significant at confidence level up to 98%. This trend can be assessed in a decrease of 0.9 days per decade in the North subplateau, 1.3 days per decade in the South sub-plateau and 0.9 days per decade in the Central Plateau. According to that the South subplateau is slightly warmer than the North.
• From what has been explained before, we can conclude that between 1961 and 2010, the ECDs annual frequency throughout the year, has increased at a low pace, although with a relatively large variability. On the other hand the results obtained in this work allow to admit that the temporal behavior of the annual frequencies of EWDs and ECDs indicate an increasing of the EWDs and a decreasing of the ECDs, what fits with the trend forecasted in the4th IPCC report [22] , concerning to temperature forecast. That seems to confirm the trend of the annual mean temperatures.
Acknowledgements
This work has been carried out under the CGL2009-08565 research project funded by the MICINN. The authors are grateful to the AEMET the facilities given to obtain the data that have allowed it.
References
- Peterson, T.C. and Easterling, D.R. (1994) Creation of Homogeneous Composite Climatological Reference Series. International Journal of Climatology, 14, 671-679. http://dx.doi.org/10.1002/joc.3370140606
- Jones, P.D. and Hulme, M. (1996) Calculating Regional Climate Times Series for Temperature Precipitation: Methods and Illustrations. International Journal of Climatology, 16, 361-377. http://dx.doi.org/10.1002/(SICI)1097-0088(199604)16:4<361::AID-JOC53>3.0.CO;2-F
- Labajo, J.L. and Piorno, A. (1999) Comportamiento de variables climáticas en Castilla y León: Temperatura mínima media anua. En: Raso, J.M. and Martín-Vide,J., Eds., La climatología española en los albores del siglo XXI, Publicaciones de la AEC, Serie A nº 1, 259-266.
- Galán, E., Cañada, R., Fernández, F. and Cervera, B. (2001) Annual Temperature Evolution in the Southern Plateau of Spain from the Construction of Regional Climatic Time Series. In: Brunet, M. and López, D., Eds., Detecting and Modelling Regional Climate Change, Springer-Verlag, Berlin, 119-131. http://dx.doi.org/10.1007/978-3-662-04313-4_11
- Jones, P.D. and Moberg, A. (2003) Hemispheric and Large-Scale Air Temperature Variations: An Extensive Revision and an Update to 2001. Journal of Climate, 16, 206-223. http://dx.doi.org/10.1175/1520-0442(2003)016<0206:HALSSA>2.0.CO;2
- Labajo, J.L., Martín, Q., Piorno, A., Labajo, A.L., Morales, C. and Ortega, M.T. (2004) Primeros resultados del análisis del comportamiento de los valores extremos de la presión atmosférica, a nivel del suelo, en Castilla y León. En: García Codrón, J.C., Diego Liaño, C., Arróyabe, F.D.E., Hernáez, P., Garmendia Pedraja, C. and Rasilla Álvarez, D. Eds., El Clima entre el Mar y la Montaña, Publicaciones de la AEC, Serie A, nº 4, 313-321.
- IPCC (2007) Climate Change 2007: The Physical Science Basis. Contribution of Working Group I to the Fourth Assessment Report of the Intergovernmental Panel on Climate Change. IPCC Secretariat, WMO, Geneva.
- Plummer, N., Salinger, M.J., Nicholls, N., Suppiah, R., Hennessy, K.J., Leighton, R.M., Trewin, B., Page, C.M. and Lough, J.M. (1999) Changes in Climate Extremes over the Australian Region and New Zeland during the Twentieth Century. Climatic Change, 42, 183-202. http://dx.doi.org/10.1175/1520-0442(2003)016<0206:HALSSA>2.0.CO;2
- López-Díaz, J.A. (2002) A Nonparametric Test for Trends in the Occurrence of Rare Events. Journal of Climate, 16, 2602-2614. http://dx.doi.org/10.1175/1520-0442(2003)016<2602:ANTFTI>2.0.CO;2
- Morales, C.G., Ortega, M.T., Labajo, J.L. and Piorno, A. (2004). Recent Trends and temporal Behavior of Termal Variables in the Region of Castilla-León (Spain). Atmósfera, 18, 71-90.
- Ortega, M.T., Morales, C., Labajo, J.L., Labajo, A.L., Piorno, A. and Martín, Q. (2006) Tendencias recientes en las frecuencias de los valores extremos de temperatura en la región de Castilla y León. En: Cuadrat, J.M., Saz, M.A., Vicente, S.M., Lanjeri, S., DE Luis, M. and González, J.C., Eds., Clima, Sociedad y Medio Ambiente. Publicaciones de la AEC, Serie A, nº 5 , 251-259.
- Labajo, J.L., Martín, Q., Labajo, A.L., Piorno, A., Ortega, M.T. and Morales, C. (2008) Recent Trends in the Frequencies of Extreme Values of Daily Maximum Atmospheric Pressure at Ground Level in the Central Zone of the Iberian Peninsula. International Journal of Climatollogy, 28, 1227-1238. http://dx.doi.org/10.1002/joc.1631
- Manton, M.J., Della-Marta, P.M., Haylock, M.R., Hennessy, K.J., Nicholls, N., Chambers, L.E., Collins, D.A., Daw, G., Finet, A., Gunawan, D., Inape, K., Isobe, H., Kestin, T.S., Lefale, P., Leyu, C.H., Lwin, T., Maitrepierre, L., Ouprasitwong, N., Page, C.M., Pahalad, J., Plummer, N., Salinger, M.J., Suppiah, R., Tran, V.L., Trewin, B., Tibig, I. and Yee, D. (2001) Trends in Extreme Daily Rainfall and Temperature in Southeast Asia and the South Pacific: 1961-1998. International Journal of Climatology, 21, 269-284. http://dx.doi.org/10.1002/joc.1631
- Salinger, M.J. and Griffiths, G.M. (2001) Trends in New Zealand Daily Temperature an Rainfall Extremes. International Journal of Climatology, 21, 1437-1452.
- Sneyers, R. (1975) Sobre el análisis estadístico de las series de observaciones. OMM, Nota Técnica 143, OMM-Nº415. 192 p.
- Domonkos, P., Kyselý, J., Piotrowicz, K., Petrovic, P. and Likso, P. (2003) Varibiliry of Extreme Temperature Events in South-Central Europe during the 20th Century and Its Relationship with Large-Scale Circulation. International Journal of Climatology, 23, 987-1010. http://dx.doi.org/10.1002/joc.929
- Klein, A.M.G. and Können, G.P. (2003) Trends in Indices of Daily Temperature and Precipitation Extremes in Europe, 1946-99. Journal Climate, 16, 3665-3680. http://dx.doi.org/10.1175/1520-0442(2003)016<3665:TIIODT>2.0.CO;2
- Labajo, A.L. and Labajo, J.L. (2010) Evolución de la frecuencia anual de los días extremadamente fríos, en época fría, entre 1961 y 2003, en la Meseta Central española. Publicaciones de la Asociación Española de Climatología (AEC), Serie A nº 7, 151-159.
- DeGaetano, A.T. and ALLEN, R.J. (2002) Trends in Twentieth-Century Temperature Extremes across the United States. Journal of Climate, 15, 3188-3205. http://dx.doi.org/10.1175/1520-0442(2002)015<3188:TITCTE>2.0.CO;2
- Labajo, J.L., Labajo, A.L., Martín, Q., Piorno, A., Morales, C. and Ortega, M.T. (2006) Análisis del comportamiento reciente de los valores extremos de temperatura en la zona Madrid-Castilla La Mancha. En: Cuadrat, J.M., Saz, M.A., Vicente, S.M., Lanjeri, S., DE Luis, M. and González, J.C., Eds., Clima, Sociedad y Medio Ambiente, Publicaciones de la AEC, Serie A, nº 5, 157-165.
- Griffiths, G.M., Ssalinger, M.J. and Leleu, I. (2003) Trends in Extreme Daily Rainfall across the South Pacific and Relationship to the South Pacific Convergence Zone. International Journal of Climatology, 23, 847-869. http://dx.doi.org/10.1002/joc.923
NOTES

*Corresponding author.