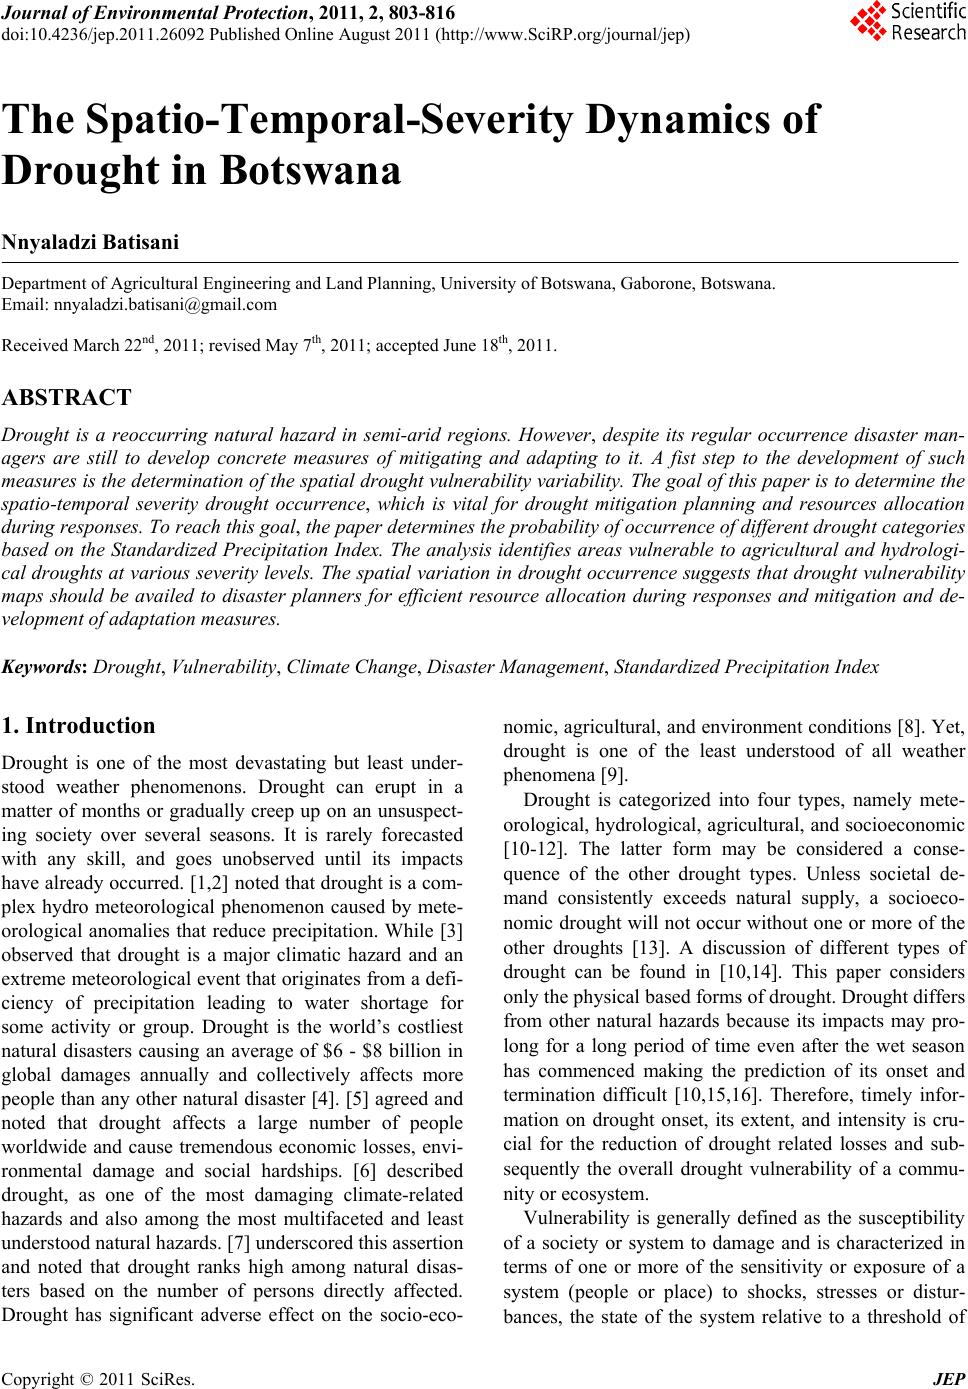
 Journal of Environmental Protection, 2011, 2, 803-816 doi:10.4236/jep.2011.26092 Published Online August 2011 (http://www.SciRP.org/journal/jep) Copyright © 2011 SciRes. JEP 803 The Spatio-Temporal-Severity Dynamics of Drought in Botswana Nnyaladzi Batisani Department of Agricultural Engineering and Land Planning, University of Botswana, Gaborone, Botswana. Email: nnyaladzi.batisani@gmail.com Received March 22nd, 2011; revised May 7th, 2011; accepted June 18th, 2011. ABSTRACT Drought is a reoccurring natural hazard in semi-arid regions. However, despite its regular occurrence disaster man- agers are still to develop concrete measures of mitigating and adapting to it. A fist step to the development of such measures is the determination of the spatia l drought vulnerability variability. The goal of this pap er is to determine the spatio-temporal severity drought occurrence, which is vital for drought mitigation planning and resources allocation during responses. To reach this goal, th e pap er de termines th e p robab ilit y o f occurren ce of d ifferen t dro ugh t ca tego ries based on the Standardized Precipitation Index. The analysis identifies areas vulnerable to agricultural and hydrologi- cal droughts at various severity levels. The spatial variation in drought occurrence suggests that drought vulnerability maps should be availed to disaster planners for efficient resource allocation during responses and mitigation and de- velopment of ada pt ati o n measures. Keywords: Drought, Vulnerability, Climate Change, Disaster Management , Standardized Precipitation Index 1. Introduction Drought is one of the most devastating but least under- stood weather phenomenons. Drought can erupt in a matter of months or gradually creep up on an unsuspect- ing society over several seasons. It is rarely forecasted with any skill, and goes unobserved until its impacts have already occurred. [1,2]]noted that drought is a com- plex hydro meteorological phenomenon caused by mete- orological anomalies that reduce precipitation. While [3] observed that drought is a major climatic hazard and an extreme meteorological event that originates from a defi- ciency of precipitation leading to water shortage for some activity or group. Drought is the world’s costliest natural disasters causing an average of $6 - $8 billion in global damages annually and collectively affects more people than any other natural disaster [4]. [5] agreed and noted that drought affects a large number of people worldwide and cause tremendous economic losses, envi- ronmental damage and social hardships. [6] described drought, as one of the most damaging climate-related hazards and also among the most multifaceted and least understood natural hazards. [7] underscored this assertion and noted that drought ranks high among natural disas- ters based on the number of persons directly affected. Drought has significant adverse effect on the socio-eco- nomic, agricultural, and environment conditions [8]. Yet, drought is one of the least understood of all weather phenomena [9]. Drought is categorized into four types, namely mete- orological, hydrological, agricultural, and socioeconomic [10-12]. The latter form may be considered a conse- quence of the other drought types. Unless societal de- mand consistently exceeds natural supply, a socioeco- nomic drought will not occur without one or more of the other droughts [13]. A discussion of different types of drought can be found in [10,14]. This paper considers only the physical based forms of drought. Drought differs from other natural hazards because its impacts may pro- long for a long period of time even after the wet season has commenced making the prediction of its onset and termination difficult [10,15,16]. Therefore, timely infor- mation on drought onset, its extent, and intensity is cru- cial for the reduction of drought related losses and sub- sequently the overall drought vulnerability of a commu- nity or ecosystem. Vulnerability is generally defined as the susceptibility of a society or system to damage and is characterized in terms of one or more of the sensitivity or exposure of a system (people or place) to shocks, stresses or distur- bances, the state of the system relative to a threshold of 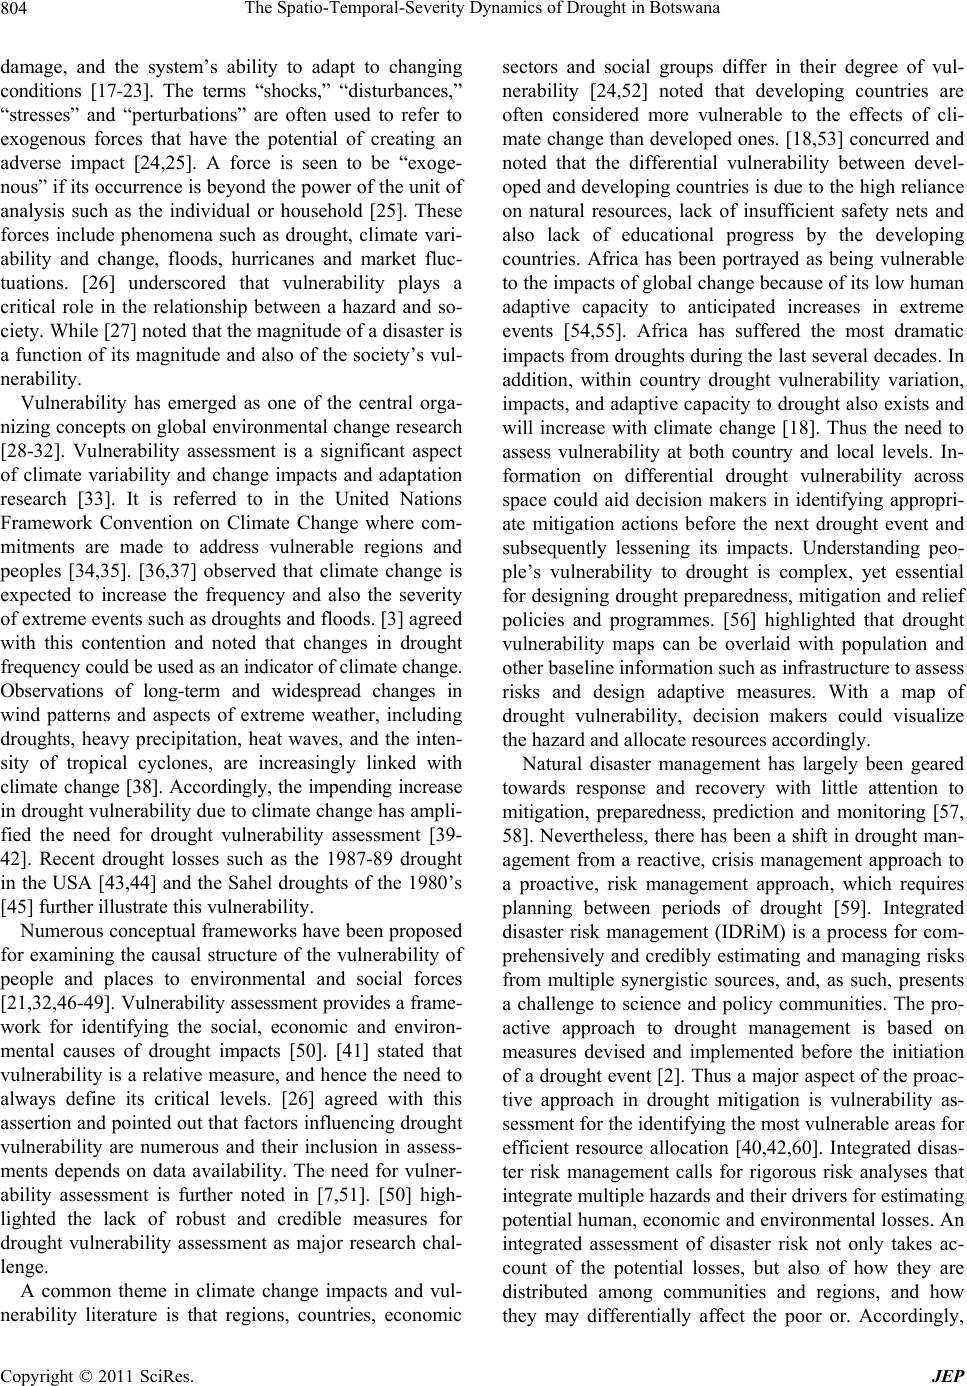 The Spatio-Temporal-Severity Dynamics of Drought in Botswana 804 damage, and the system’s ability to adapt to changing conditions [17-23]. The terms “shocks,” “disturbances,” “stresses” and “perturbations” are often used to refer to exogenous forces that have the potential of creating an adverse impact [24,25]. A force is seen to be “exoge- nous” if its occurrence is beyond the power of the unit of analysis such as the individual or household [25]. These forces include phenomena such as drought, climate vari- ability and change, floods, hurricanes and market fluc- tuations. [26] underscored that vulnerability plays a critical role in the relationship between a hazard and so- ciety. While [27] noted that the magnitude of a disaster is a function of its magnitude and also of the society’s vul- nerability. Vulnerability has emerged as one of the central orga- nizing concepts on global environmental change research [28-32]. Vulnerability assessment is a significant aspect of climate variability and change impacts and adaptation research [33]. It is referred to in the United Nations Framework Convention on Climate Change where com- mitments are made to address vulnerable regions and peoples [34,35]. [36,37] observed that climate change is expected to increase the frequency and also the severity of extreme events such as droughts and floods. [3] agreed with this contention and noted that changes in drought frequency could be used as an indicator of climate change. Observations of long-term and widespread changes in wind patterns and aspects of extreme weather, including droughts, heavy precipitation, heat waves, and the inten- sity of tropical cyclones, are increasingly linked with climate change [38]. Accordingly, the impending increase in drought vulnerability due to climate change has ampli- fied the need for drought vulnerability assessment [39- 42]. Recent drought losses such as the 1987-89 drought in the USA [43,44] and the Sahel droughts of the 1980’s [45] further illustrate this vulnerability. Numerous conceptual frameworks have been proposed for examining the causal structure of the vulnerability of people and places to environmental and social forces [21,32,46-49]. Vulnerability assessment provides a frame- work for identifying the social, economic and environ- mental causes of drought impacts [50]. [41] stated that vulnerability is a relative measure, and hence the need to always define its critical levels. [26] agreed with this assertion and pointed out that factors influencing drought vulnerability are numerous and their inclusion in assess- ments depends on data availability. The need for vulner- ability assessment is further noted in [7,51]. [50] high- lighted the lack of robust and credible measures for drought vulnerability assessment as major research chal- lenge. A common theme in climate change impacts and vul- nerability literature is that regions, countries, economic sectors and social groups differ in their degree of vul- nerability [24,52] noted that developing countries are often considered more vulnerable to the effects of cli- mate change than developed ones. [18,53] concurred and noted that the differential vulnerability between devel- oped and developing countries is due to the high reliance on natural resources, lack of insufficient safety nets and also lack of educational progress by the developing countries. Africa has been portrayed as being vulnerable to the impacts of global change because of its low human adaptive capacity to anticipated increases in extreme events [54,55]. Africa has suffered the most dramatic impacts from droughts during the last several decades. In addition, within country drought vulnerability variation, impacts, and adaptive capacity to drought also exists and will increase with climate change [18]. Thus the need to assess vulnerability at both country and local levels. In- formation on differential drought vulnerability across space could aid decision makers in identifying appropri- ate mitigation actions before the next drought event and subsequently lessening its impacts. Understanding peo- ple’s vulnerability to drought is complex, yet essential for designing drought preparedness, mitigation and relief policies and programmes. [56] highlighted that drought vulnerability maps can be overlaid with population and other baseline information such as infrastructure to assess risks and design adaptive measures. With a map of drought vulnerability, decision makers could visualize the hazard and allocate resources accordingly. Natural disaster management has largely been geared towards response and recovery with little attention to mitigation, preparedness, prediction and monitoring [57, 58]. Nevertheless, there has been a shift in drought man- agement from a reactive, crisis management approach to a proactive, risk management approach, which requires planning between periods of drought [59]. Integrated disaster risk management (IDRiM) is a process for com- prehensively and credibly estimating and managing risks from multiple synergistic sources, and, as such, presents a challenge to science and policy communities. The pro- active approach to drought management is based on measures devised and implemented before the initiation of a drought event [2]. Thus a major aspect of the proac- tive approach in drought mitigation is vulnerability as- sessment for the identifying the most vulnerable areas for efficient resource allocation [40,42,60]. Integrated disas- ter risk management calls for rigorous risk analyses that integrate multiple hazards and their drivers for estimating potential human, economic and environmental losses. An integrated assessment of disaster risk not only takes ac- count of the potential losses, but also of how they are distributed among communities and regions, and how they may differentially affect the poor or. Accordingly, Copyright © 2011 SciRes. JEP 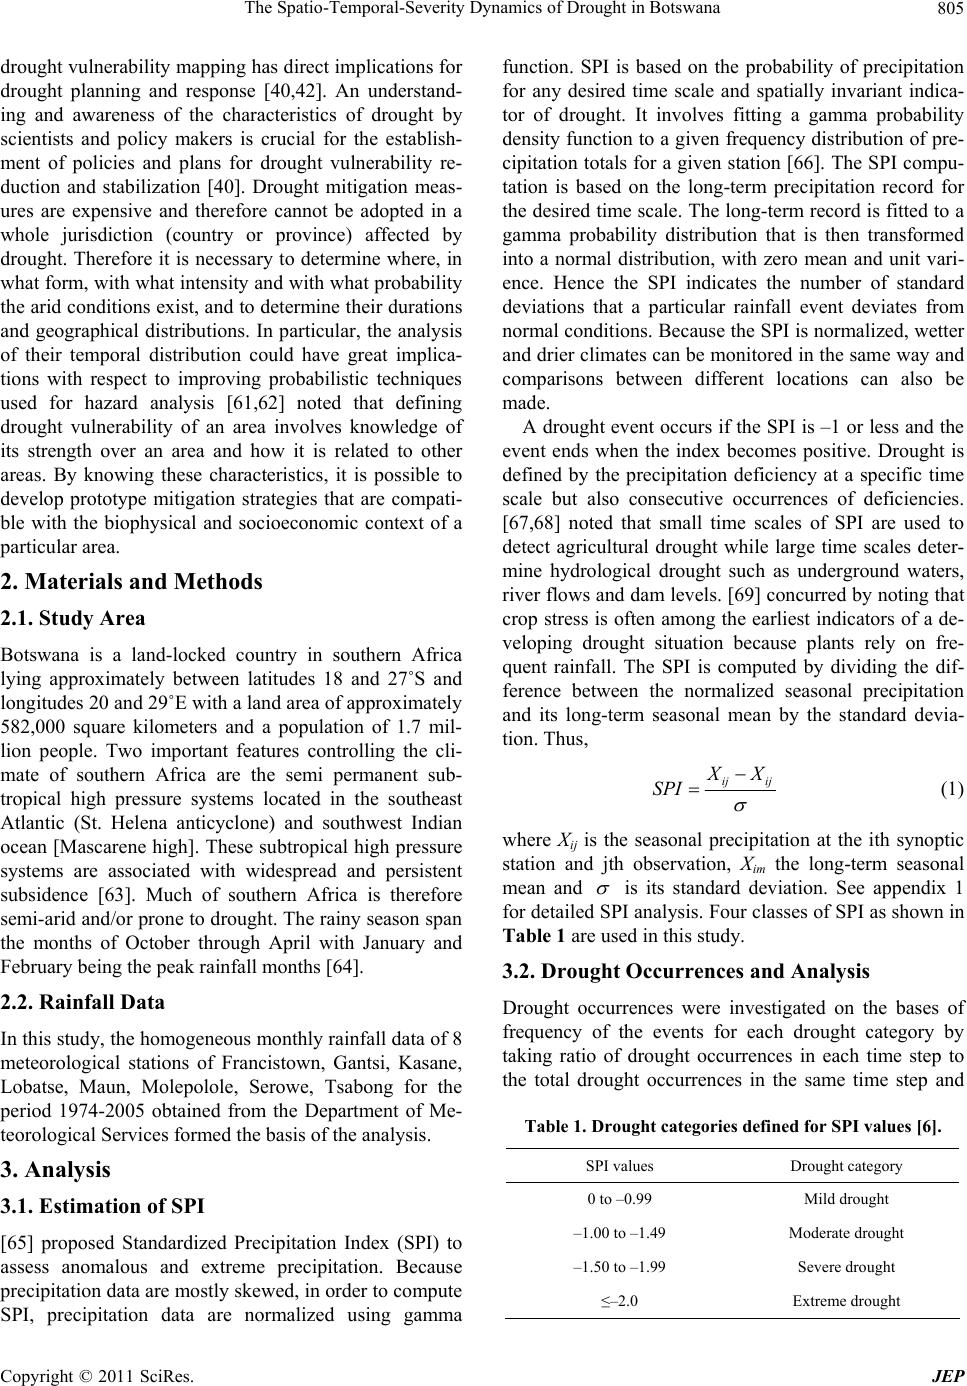 The Spatio-Temporal-Severity Dynamics of Drought in Botswana805 drought vulnerability mapping has direct implications for drought planning and response [40,42]. An understand- ing and awareness of the characteristics of drought by scientists and policy makers is crucial for the establish- ment of policies and plans for drought vulnerability re- duction and stabilization [40]. Drought mitigation meas- ures are expensive and therefore cannot be adopted in a whole jurisdiction (country or province) affected by drought. Therefore it is necessary to determine where, in what form, with what intensity and with what probability the arid conditions exist, and to determine their durations and geographical distributions. In particular, the analysis of their temporal distribution could have great implica- tions with respect to improving probabilistic techniques used for hazard analysis [61,62] noted that defining drought vulnerability of an area involves knowledge of its strength over an area and how it is related to other areas. By knowing these characteristics, it is possible to develop prototype mitigation strategies that are compati- ble with the biophysical and socioeconomic context of a particular area. 2. Materials and Methods 2.1. Study Area Botswana is a land-locked country in southern Africa lying approximately between latitudes 18 and 27˚S and longitudes 20 and 29˚E with a land area of approximately 582,000 square kilometers and a population of 1.7 mil- lion people. Two important features controlling the cli- mate of southern Africa are the semi permanent sub- tropical high pressure systems located in the southeast Atlantic (St. Helena anticyclone) and southwest Indian ocean [Mascarene high]. These subtropical high pressure systems are associated with widespread and persistent subsidence [63]. Much of southern Africa is therefore semi-arid and/or prone to drought. The rainy season span the months of October through April with January and February being the peak rainfall months [64]. 2.2. Rainfall Data In this study, the homogeneous monthly rainfall data of 8 meteorological stations of Francistown, Gantsi, Kasane, Lobatse, Maun, Molepolole, Serowe, Tsabong for the period 1974-2005 obtained from the Department of Me- teorological Services formed the basis of the analysis. 3. Analysis 3.1. Estimation of SPI [65] proposed Standardized Precipitation Index (SPI) to assess anomalous and extreme precipitation. Because precipitation data are mostly skewed, in order to compute SPI, precipitation data are normalized using gamma function. SPI is based on the probability of precipitation for any desired time scale and spatially invariant indica- tor of drought. It involves fitting a gamma probability density function to a given frequency distribution of pre- cipitation totals for a given station [66]. The SPI compu- tation is based on the long-term precipitation record for the desired time scale. The long-term record is fitted to a gamma probability distribution that is then transformed into a normal distribution, with zero mean and unit vari- ence. Hence the SPI indicates the number of standard deviations that a particular rainfall event deviates from normal conditions. Because the SPI is normalized, wetter and drier climates can be monitored in the same way and comparisons between different locations can also be made. A drought event occurs if the SPI is –1 or less and the event ends when the index becomes positive. Drought is defined by the precipitation deficiency at a specific time scale but also consecutive occurrences of deficiencies. [67,68] noted that small time scales of SPI are used to detect agricultural drought while large time scales deter- mine hydrological drought such as underground waters, river flows and dam levels. [69] concurred by noting that crop stress is often among the earliest indicators of a de- veloping drought situation because plants rely on fre- quent rainfall. The SPI is computed by dividing the dif- ference between the normalized seasonal precipitation and its long-term seasonal mean by the standard devia- tion. Thus, ij ij X SPI (1) where Xij is the seasonal precipitation at the ith synoptic station and jth observation, Xim the long-term seasonal mean and is its standard deviation. See appendix 1 for detailed SPI analysis. Four classes of SPI as shown in Table 1 are used in this study. 3.2. Drought Occurrences and Analysis Drought occurrences were investigated on the bases of frequency of the events for each drought category by taking ratio of drought occurrences in each time step to the total drought occurrences in the same time step and Table 1. Drought categories defined for SPI values [6]. SPI values Drought category 0 to –0.99 Mild drought –1.00 to –1.49 Moderate drought –1.50 to –1.99 Severe drought ≤–2.0 Extreme drought Copyright © 2011 SciRes. JEP 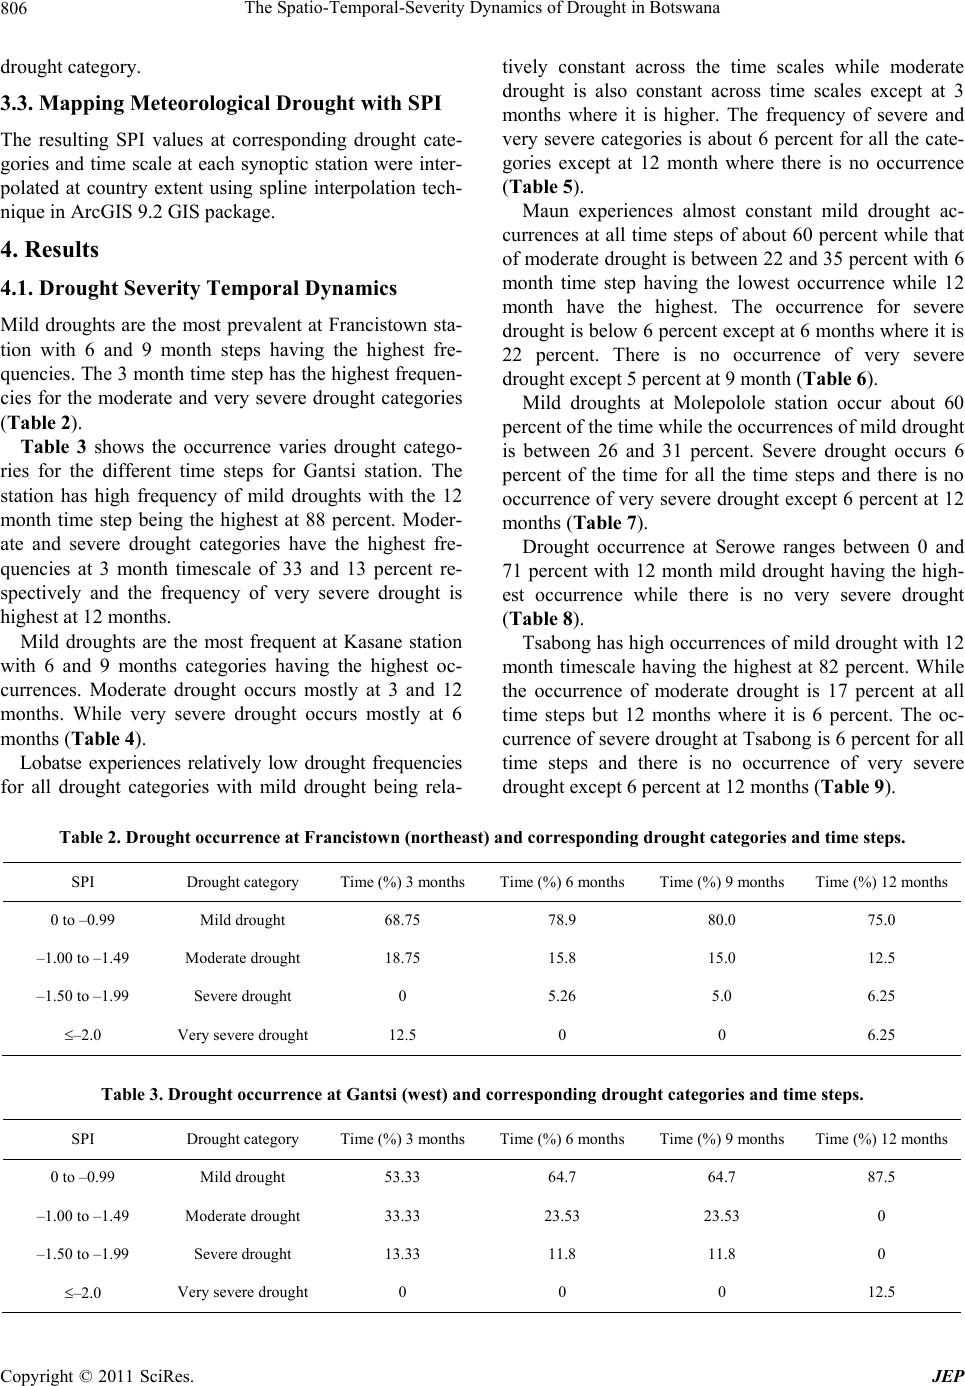 The Spatio-Temporal-Severity Dynamics of Drought in Botswana Copyright © 2011 SciRes. JEP 806 drought category. 3.3. Mapping Meteorological Drought with SPI The resulting SPI values at corresponding drought cate- gories and time scale at each synoptic station were inter- polated at country extent using spline interpolation tech- nique in ArcGIS 9.2 GIS package. 4. Results 4.1. Drought Severity Temporal Dynamics Mild droughts are the most prevalent at Francistown sta- tion with 6 and 9 month steps having the highest fre- quencies. The 3 month time step has the highest frequen- cies for the moderate and very severe drought categories (Table 2). Table 3 shows the occurrence varies drought catego- ries for the different time steps for Gantsi station. The station has high frequency of mild droughts with the 12 month time step being the highest at 88 percent. Moder- ate and severe drought categories have the highest fre- quencies at 3 month timescale of 33 and 13 percent re- spectively and the frequency of very severe drought is highest at 12 months. Mild droughts are the most frequent at Kasane station with 6 and 9 months categories having the highest oc- currences. Moderate drought occurs mostly at 3 and 12 months. While very severe drought occurs mostly at 6 months (Table 4). Lobatse experiences relatively low drought frequencies for all drought categories with mild drought being rela- tively constant across the time scales while moderate drought is also constant across time scales except at 3 months where it is higher. The frequency of severe and very severe categories is about 6 percent for all the cate- gories except at 12 month where there is no occurrence (Table 5). Maun experiences almost constant mild drought ac- currences at all time steps of about 60 percent while that of moderate drought is between 22 and 35 percent with 6 month time step having the lowest occurrence while 12 month have the highest. The occurrence for severe drought is below 6 percent except at 6 months where it is 22 percent. There is no occurrence of very severe drought except 5 percent at 9 month (Table 6). Mild droughts at Molepolole station occur about 60 percent of the time while the occurrences of mild drought is between 26 and 31 percent. Severe drought occurs 6 percent of the time for all the time steps and there is no occurrence of very severe drought except 6 percent at 12 months (Table 7). Drought occurrence at Serowe ranges between 0 and 71 percent with 12 month mild drought having the high- est occurrence while there is no very severe drought (Table 8). Tsabong has high occurrences of mild drought with 12 month timescale having the highest at 82 percent. While the occurrence of moderate drought is 17 percent at all time steps but 12 months where it is 6 percent. The oc- currence of severe drought at Tsabong is 6 percent for all time steps and there is no occurrence of very severe drought except 6 percent at 12 months (Table 9 ). Table 2. Drought occurrence at Francistown (northeast) and corresponding drought categories and time steps. SPI Drought category Time (%) 3 months Time (%) 6 months Time (%) 9 months Time (%) 12 months 0 to –0.99 Mild drought 68.75 78.9 80.0 75.0 –1.00 to –1.49 Moderate drought 18.75 15.8 15.0 12.5 –1.50 to –1.99 Severe drought 0 5.26 5.0 6.25 –2.0 Very severe drought 12.5 0 0 6.25 Table 3. Drought occurrence at Gantsi (west) and corresponding drought categories and time steps. SPI Drought category Time (%) 3 months Time (%) 6 months Time (%) 9 months Time (%) 12 months 0 to –0.99 Mild drought 53.33 64.7 64.7 87.5 –1.00 to –1.49 Moderate drought 33.33 23.53 23.53 0 –1.50 to –1.99 Severe drought 13.33 11.8 11.8 0 –2.0 Very severe drought 0 0 0 12.5 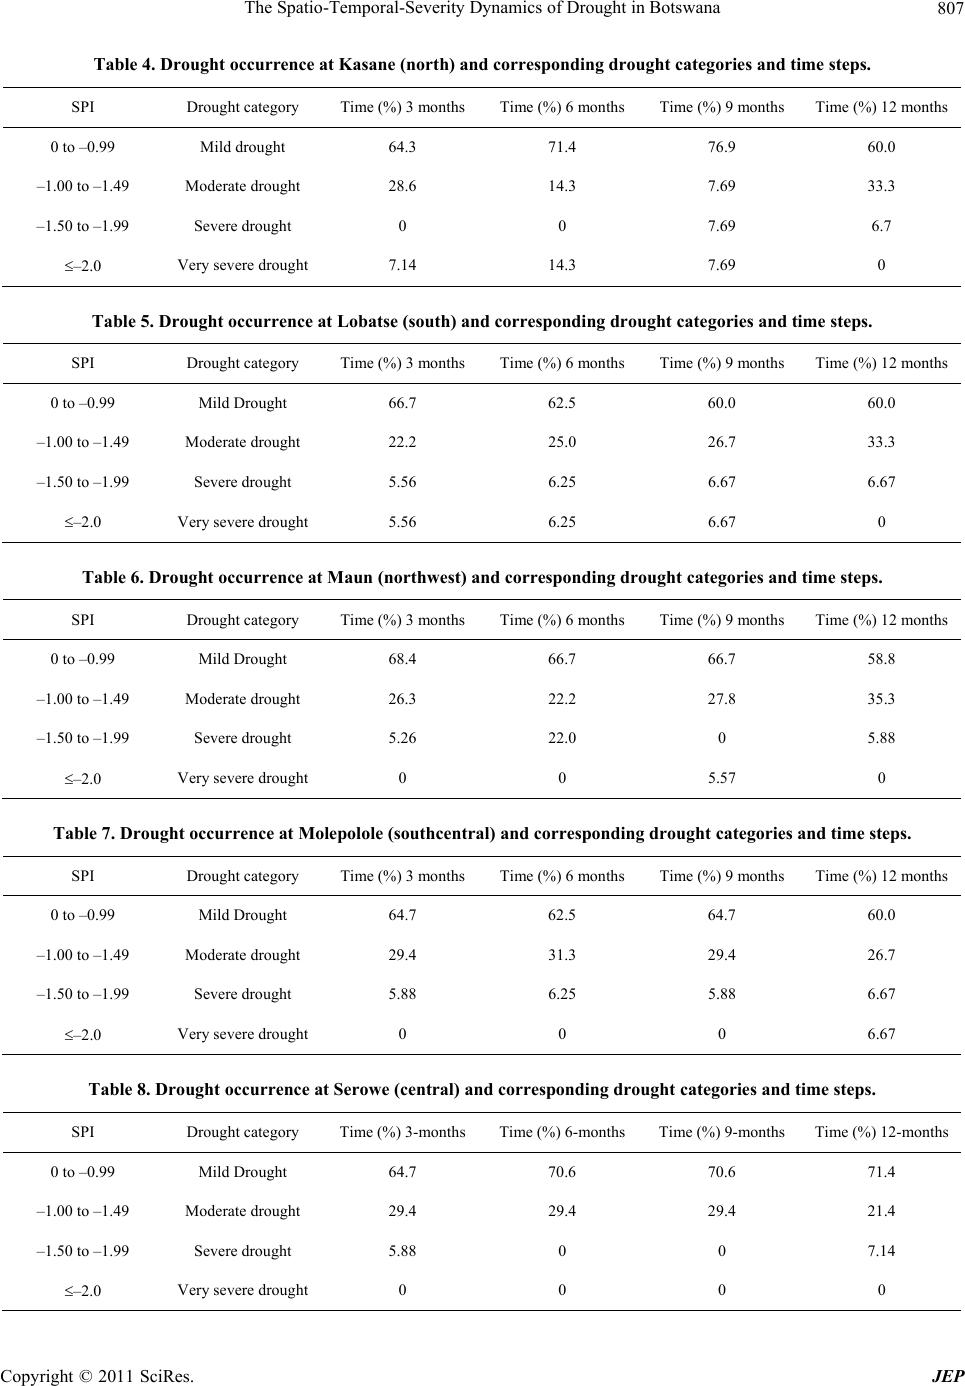 The Spatio-Temporal-Severity Dynamics of Drought in Botswana807 Table 4. Drought occurrence at Kasane (north) and corresponding drought categories and time steps. SPI Drought category Time (%) 3 months Time (%) 6 months Time (%) 9 months Time (%) 12 months 0 to –0.99 Mild drought 64.3 71.4 76.9 60.0 –1.00 to –1.49 Moderate drought 28.6 14.3 7.69 33.3 –1.50 to –1.99 Severe drought 0 0 7.69 6.7 –2.0 Very severe drought 7.14 14.3 7.69 0 Table 5. Drought occurrence at Lobatse (south) and corresponding drought categories and time steps. SPI Drought category Time (%) 3 months Time (%) 6 months Time (%) 9 months Time (%) 12 months 0 to –0.99 Mild Drought 66.7 62.5 60.0 60.0 –1.00 to –1.49 Moderate drought 22.2 25.0 26.7 33.3 –1.50 to –1.99 Severe drought 5.56 6.25 6.67 6.67 –2.0 Very severe drought 5.56 6.25 6.67 0 Table 6. Drought occurrence at Maun (northwest) and corresponding drought categories and time steps. SPI Drought category Time (%) 3 months Time (%) 6 months Time (%) 9 months Time (%) 12 months 0 to –0.99 Mild Drought 68.4 66.7 66.7 58.8 –1.00 to –1.49 Moderate drought 26.3 22.2 27.8 35.3 –1.50 to –1.99 Severe drought 5.26 22.0 0 5.88 –2.0 Very severe drought 0 0 5.57 0 Table 7. Drought occurrence at Molepolole (southcentral) and corresponding drought categories and time steps. SPI Drought category Time (%) 3 months Time (%) 6 months Time (%) 9 months Time (%) 12 months 0 to –0.99 Mild Drought 64.7 62.5 64.7 60.0 –1.00 to –1.49 Moderate drought 29.4 31.3 29.4 26.7 –1.50 to –1.99 Severe drought 5.88 6.25 5.88 6.67 –2.0 Very severe drought 0 0 0 6.67 Table 8. Drought occurrence at Serowe (central) and corresponding drought categories and time steps. SPI Drought category Time (%) 3-months Time (%) 6-months Time (%) 9-months Time (%) 12-months 0 to –0.99 Mild Drought 64.7 70.6 70.6 71.4 –1.00 to –1.49 Moderate drought 29.4 29.4 29.4 21.4 –1.50 to –1.99 Severe drought 5.88 0 0 7.14 –2.0 Very severe drought 0 0 0 0 Copyright © 2011 SciRes. JEP 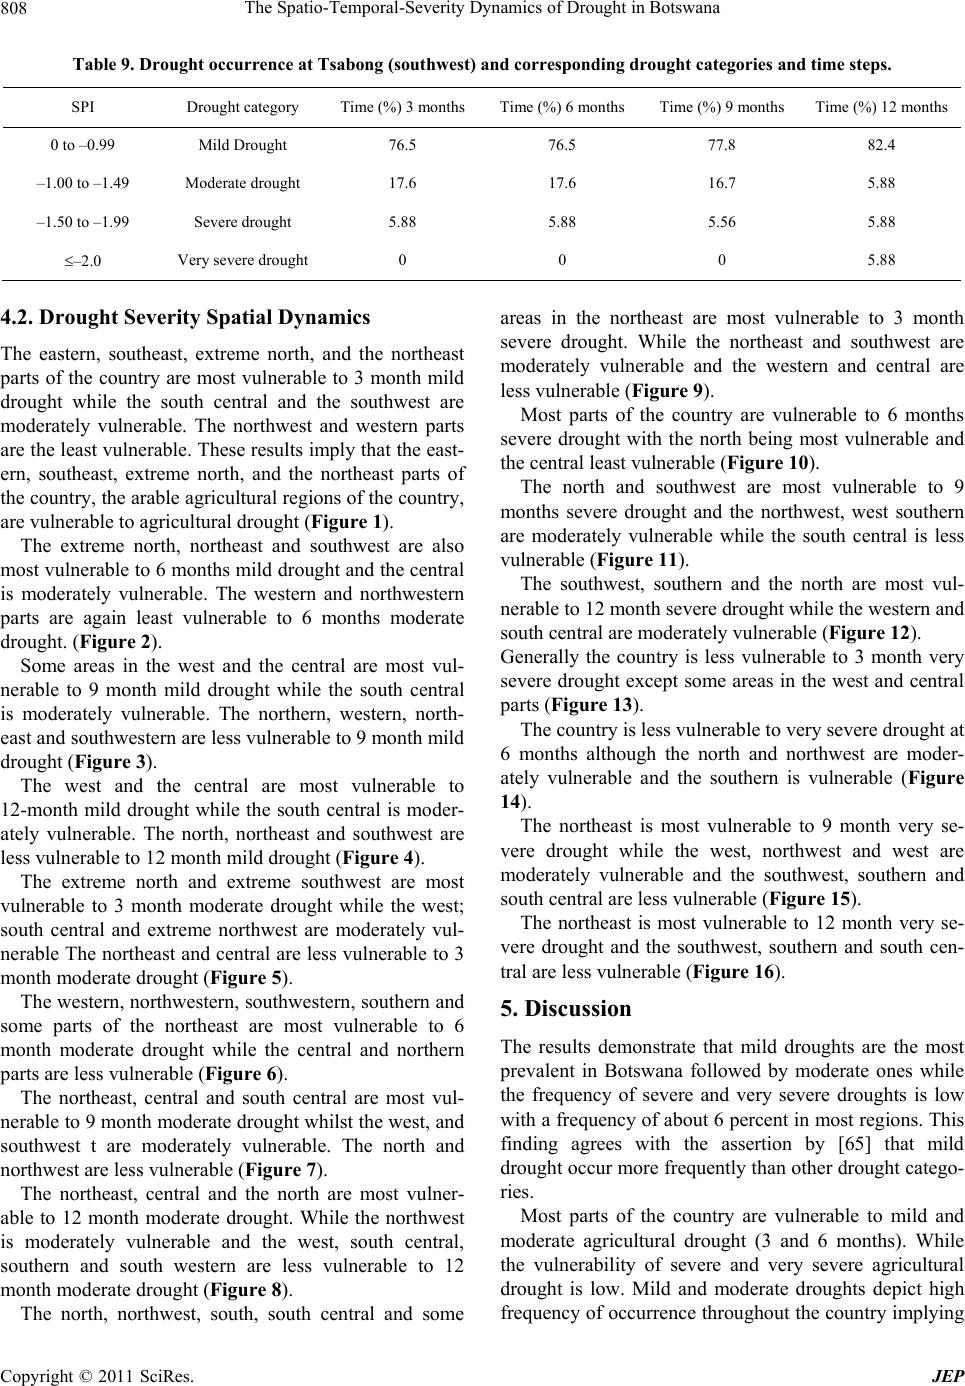 The Spatio-Temporal-Severity Dynamics of Drought in Botswana Copyright © 2011 SciRes. JEP 808 Table 9. Drought occurrence at Tsabong (southwest) and corresponding drought categories and time steps. SPI Drought category Time (%) 3 months Time (%) 6 months Time (%) 9 months Time (%) 12 months 0 to –0.99 Mild Drought 76.5 76.5 77.8 82.4 –1.00 to –1.49 Moderate drought 17.6 17.6 16.7 5.88 –1.50 to –1.99 Severe drought 5.88 5.88 5.56 5.88 –2.0 Very severe drought 0 0 0 5.88 4.2. Drought Severity Spatial Dynamics The eastern, southeast, extreme north, and the northeast parts of the country are most vulnerable to 3 month mild drought while the south central and the southwest are moderately vulnerable. The northwest and western parts are the least vulnerable. These results imply that the east- ern, southeast, extreme north, and the northeast parts of the country, the arable agricultural regions of the country, are vulnerable to agricultural drought (Figure 1). The extreme north, northeast and southwest are also most vulnerable to 6 months mild drought and the central is moderately vulnerable. The western and northwestern parts are again least vulnerable to 6 months moderate drought. (Figure 2). Some areas in the west and the central are most vul- nerable to 9 month mild drought while the south central is moderately vulnerable. The northern, western, north- east and southwestern are less vulnerable to 9 month mild drought (Figure 3). The west and the central are most vulnerable to 12-month mild drought while the south central is moder- ately vulnerable. The north, northeast and southwest are less vulnerable to 12 month mild drought (Figure 4). The extreme north and extreme southwest are most vulnerable to 3 month moderate drought while the west; south central and extreme northwest are moderately vul- nerable The northeast and central are less vulnerable to 3 month moderate drought (Figure 5). The western, northwestern, southwestern, southern and some parts of the northeast are most vulnerable to 6 month moderate drought while the central and northern parts are less vulnerable (Figure 6). The northeast, central and south central are most vul- nerable to 9 month moderate drought whilst the west, and southwest t are moderately vulnerable. The north and northwest are less vulnerable (Figure 7). The northeast, central and the north are most vulner- able to 12 month moderate drought. While the northwest is moderately vulnerable and the west, south central, southern and south western are less vulnerable to 12 month moderate drought (Figure 8). The north, northwest, south, south central and some areas in the northeast are most vulnerable to 3 month severe drought. While the northeast and southwest are moderately vulnerable and the western and central are less vulnerable (Figure 9). Most parts of the country are vulnerable to 6 months severe drought with the north being most vulnerable and the central least vulnerable (Fi gure 1 0 ). The north and southwest are most vulnerable to 9 months severe drought and the northwest, west southern are moderately vulnerable while the south central is less vulnerable (Figure 11). The southwest, southern and the north are most vul- nerable to 12 month severe drought while the western and south central are moderately vulnerable (Figure 12). Generally the country is less vulnerable to 3 month very severe drought except some areas in the west and central parts (Figure 13). The country is less vulnerable to very severe drought at 6 months although the north and northwest are moder- ately vulnerable and the southern is vulnerable (Figure 14). The northeast is most vulnerable to 9 month very se- vere drought while the west, northwest and west are moderately vulnerable and the southwest, southern and south central are less vulnerable (Figure 15). The northeast is most vulnerable to 12 month very se- vere drought and the southwest, southern and south cen- tral are less vulnerable (Figure 16). 5. Discussion The results demonstrate that mild droughts are the most prevalent in Botswana followed by moderate ones while the frequency of severe and very severe droughts is low with a frequency of about 6 percent in most regions. This finding agrees with the assertion by [65] that mild drought occur more frequently than other drought catego- ries. Most parts of the country are vulnerable to mild and moderate agricultural drought (3 and 6 months). While the vulnerability of severe and very severe agricultural drought is low. Mild and moderate droughts depict high frequency of occurrence throughout the country implying 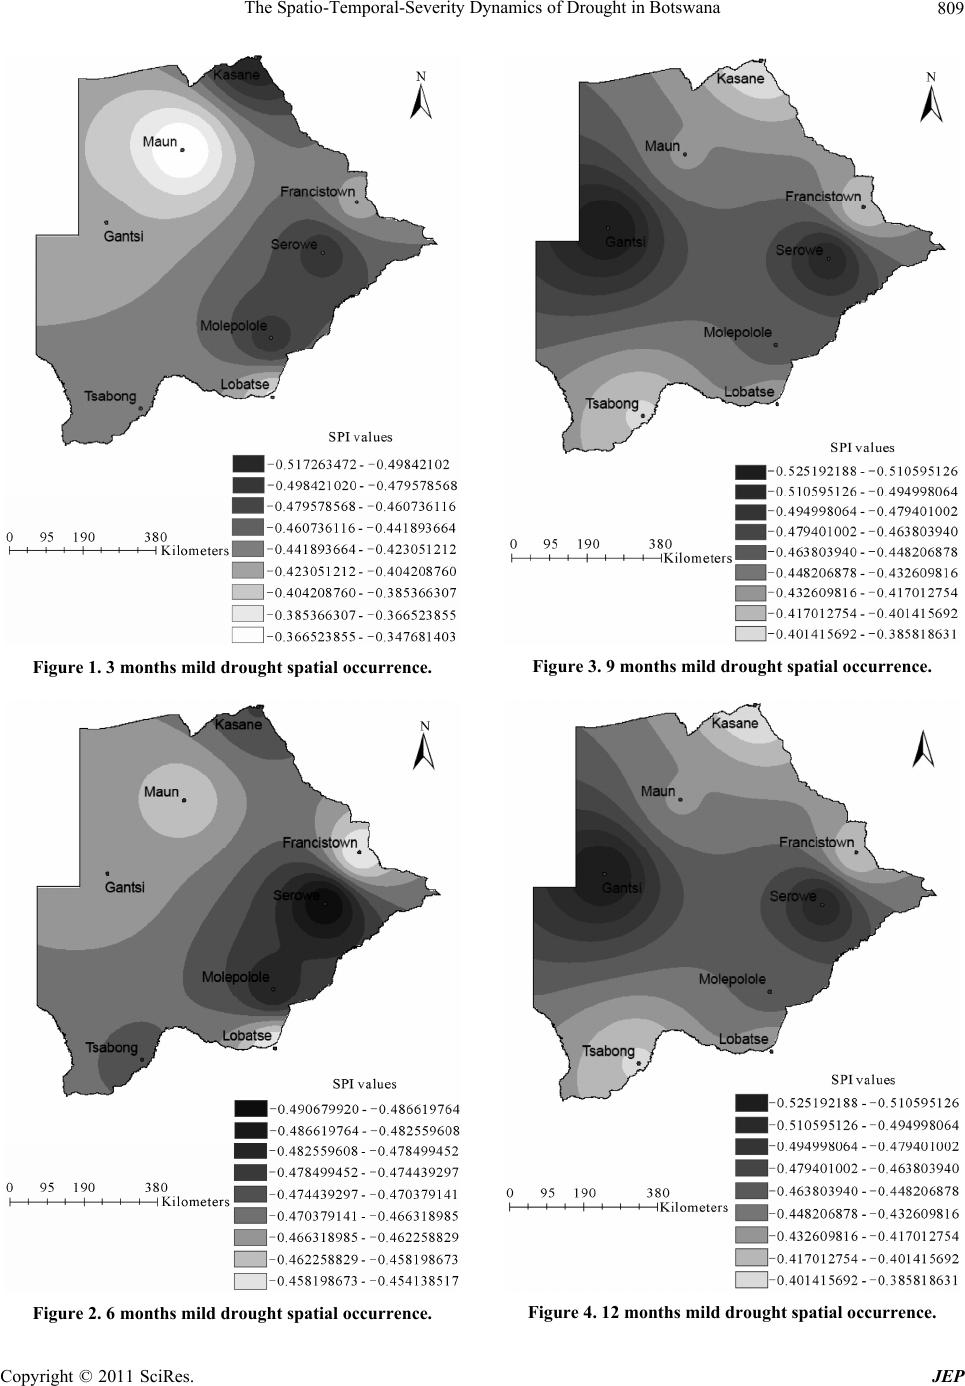 The Spatio-Temporal-Severity Dynamics of Drought in Botswana809 Figure 1. 3 months mild drought spatial occurrence. Figure 2. 6 months mild drought spatial occurrence. Figure 3. 9 months mild drought spatial occurrence. Figure 4. 12 months mild drought spatial occurrence. Copyright © 2011 SciRes. JEP 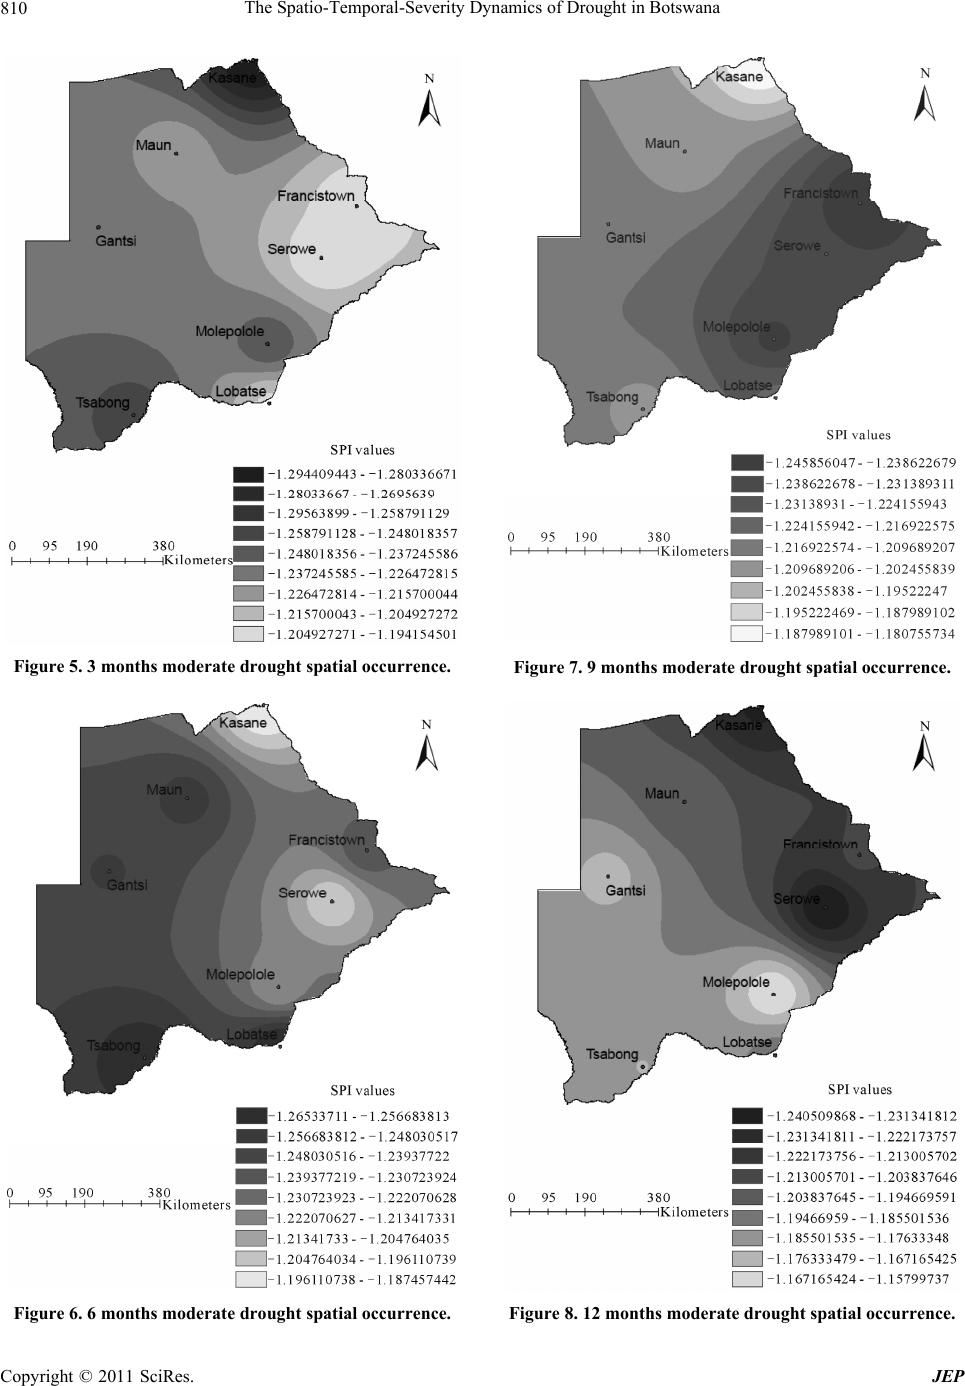 The Spatio-Temporal-Severity Dynamics of Drought in Botswana 810 Figure 5. 3 months moderate drought spatial occurrence. Figure 6. 6 months moderate drought spatial occurrence. Figure 7. 9 months moderate drought spatial occurrence. Figure 8. 12 months moderate drought spatial occurrence. Copyright © 2011 SciRes. JEP 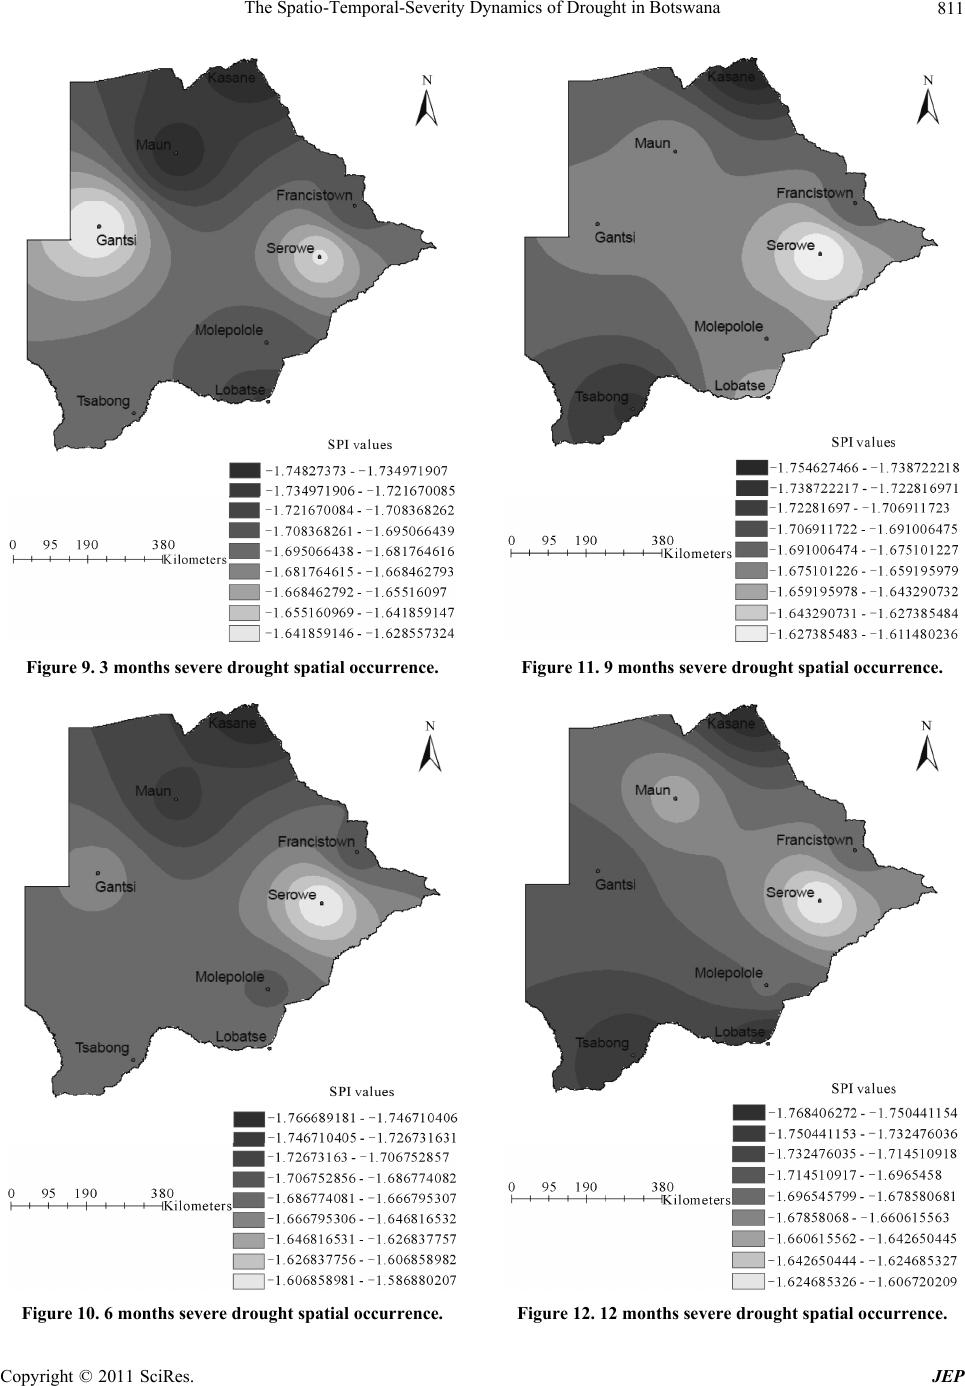 The Spatio-Temporal-Severity Dynamics of Drought in Botswana811 Figure 9. 3 months severe drought spatial occurrence. Figure 10. 6 months severe drought spatial occurrence. Figure 11. 9 months severe drought spatial occurrence. Figure 12. 12 months severe drought spatial occurrence. Copyright © 2011 SciRes. JEP 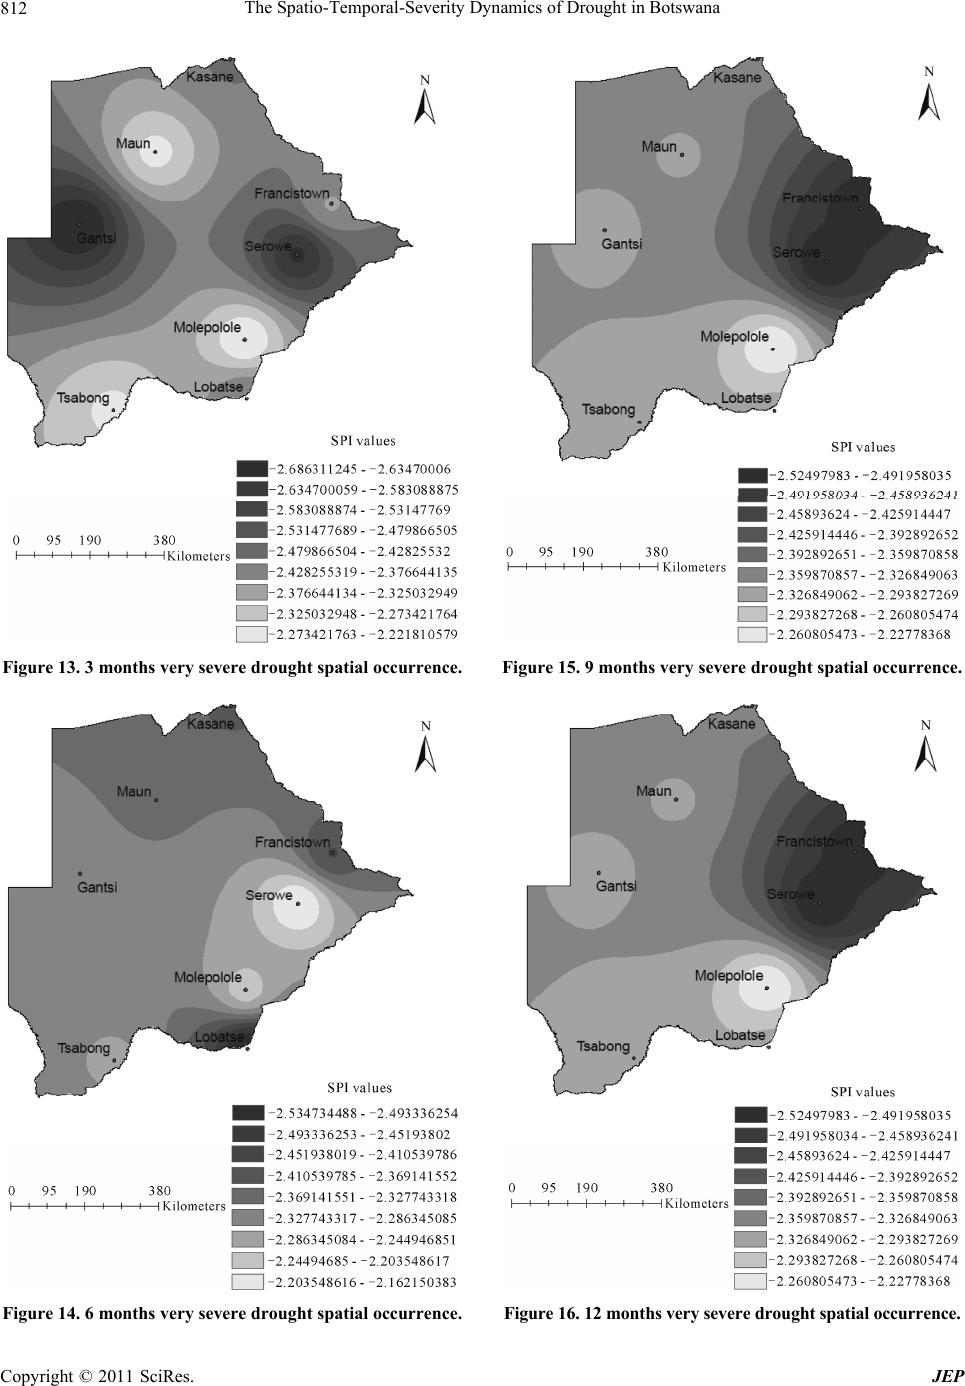 The Spatio-Temporal-Severity Dynamics of Drought in Botswana 812 Figure 13. 3 months very severe drought spatial occurrence. Figure 14. 6 months very severe drought spatial occurrence. Figure 15. 9 months very severe drought spatial occurrence. Figure 16. 12 months very severe drought sp atial occurren ce. Copyright © 2011 SciRes. JEP 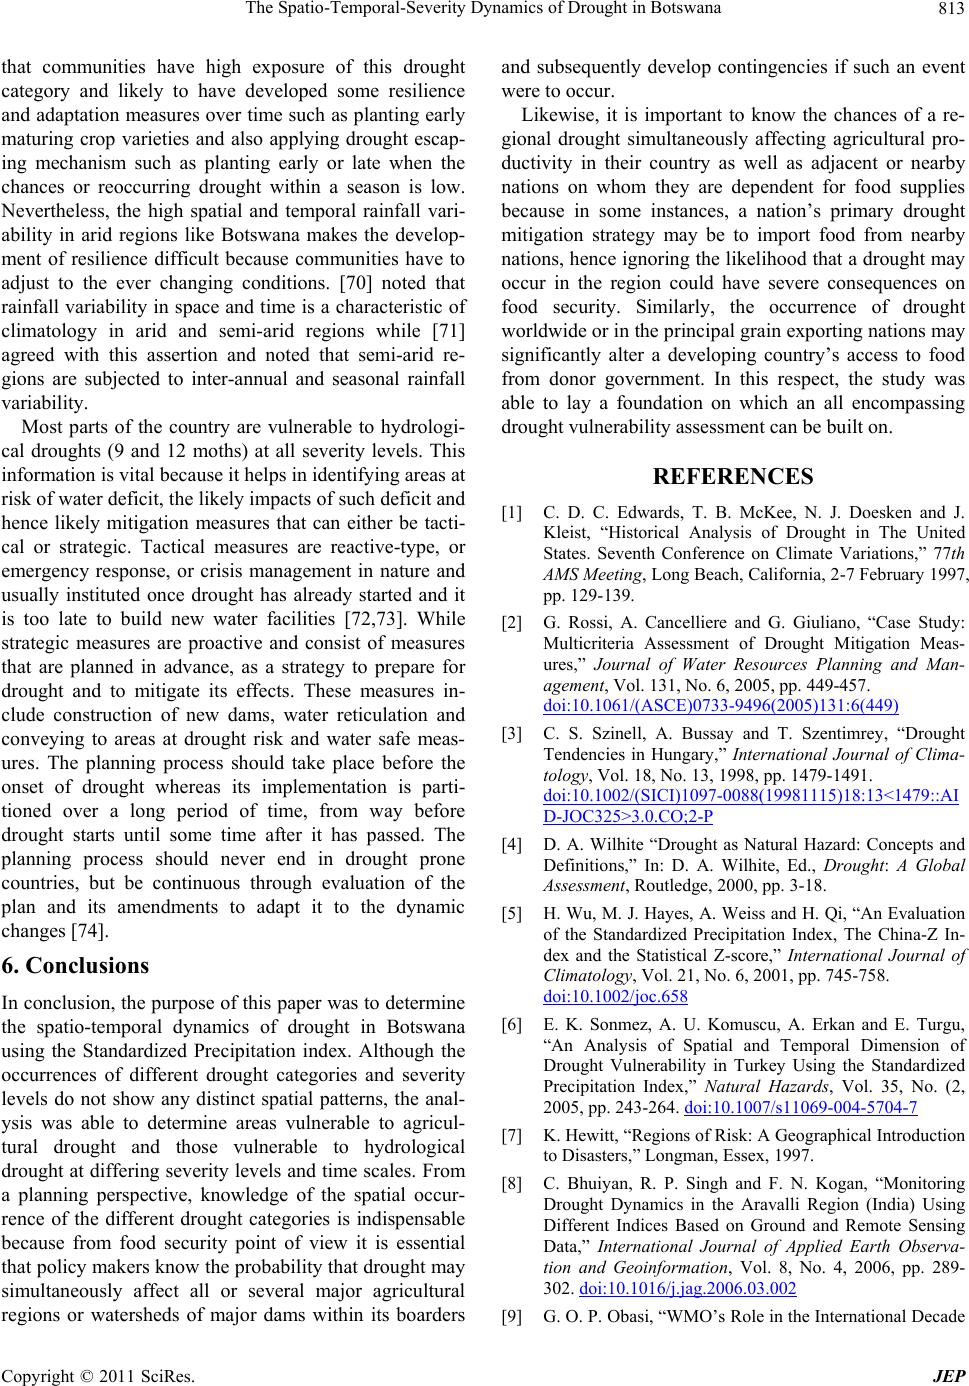 The Spatio-Temporal-Severity Dynamics of Drought in Botswana813 that communities have high exposure of this drought category and likely to have developed some resilience and adaptation measures over time such as planting early maturing crop varieties and also applying drought escap- ing mechanism such as planting early or late when the chances or reoccurring drought within a season is low. Nevertheless, the high spatial and temporal rainfall vari- ability in arid regions like Botswana makes the develop- ment of resilience difficult because communities have to adjust to the ever changing conditions. [70] noted that rainfall variability in space and time is a characteristic of climatology in arid and semi-arid regions while [71] agreed with this assertion and noted that semi-arid re- gions are subjected to inter-annual and seasonal rainfall variability. Most parts of the country are vulnerable to hydrologi- cal droughts (9 and 12 moths) at all severity levels. This information is vital because it helps in identifying areas at risk of water deficit, the likely impacts of such deficit and hence likely mitigation measures that can either be tacti- cal or strategic. Tactical measures are reactive-type, or emergency response, or crisis management in nature and usually instituted once drought has already started and it is too late to build new water facilities [72,73]. While strategic measures are proactive and consist of measures that are planned in advance, as a strategy to prepare for drought and to mitigate its effects. These measures in- clude construction of new dams, water reticulation and conveying to areas at drought risk and water safe meas- ures. The planning process should take place before the onset of drought whereas its implementation is parti- tioned over a long period of time, from way before drought starts until some time after it has passed. The planning process should never end in drought prone countries, but be continuous through evaluation of the plan and its amendments to adapt it to the dynamic changes [74]. 6. Conclusions In conclusion, the purpose of this paper was to determine the spatio-temporal dynamics of drought in Botswana using the Standardized Precipitation index. Although the occurrences of different drought categories and severity levels do not show any distinct spatial patterns, the anal- ysis was able to determine areas vulnerable to agricul- tural drought and those vulnerable to hydrological drought at differing severity levels and time scales. From a planning perspective, knowledge of the spatial occur- rence of the different drought categories is indispensable because from food security point of view it is essential that policy makers know the probability that drought may simultaneously affect all or several major agricultural regions or watersheds of major dams within its boarders and subsequently develop contingencies if such an event were to occur. Likewise, it is important to know the chances of a re- gional drought simultaneously affecting agricultural pro- ductivity in their country as well as adjacent or nearby nations on whom they are dependent for food supplies because in some instances, a nation’s primary drought mitigation strategy may be to import food from nearby nations, hence ignoring the likelihood that a drought may occur in the region could have severe consequences on food security. Similarly, the occurrence of drought worldwide or in the principal grain exporting nations may significantly alter a developing country’s access to food from donor government. In this respect, the study was able to lay a foundation on which an all encompassing drought vulnerability assessment can be built on. REFERENCES [1] C. D. C. Edwards, T. B. McKee, N. J. Doesken and J. Kleist, “Historical Analysis of Drought in The United States. Seventh Conference on Climate Variations,” 77th AMS Meeting, Long Beach, California, 2-7 February 1997, pp. 129-139. [2] G. Rossi, A. Cancelliere and G. Giuliano, “Case Study: Multicriteria Assessment of Drought Mitigation Meas- ures,” Journal of Water Resources Planning and Man- agement, Vol. 131, No. 6, 2005, pp. 449-457. doi:10.1061/(ASCE)0733-9496(2005)131:6(449) [3] C. S. Szinell, A. Bussay and T. Szentimrey, “Drought Tendencies in Hungary,” International Journal of Clima- tology, Vol. 18, No. 13, 1998, pp. 1479-1491. doi:10.1002/(SICI)1097-0088(19981115)18:13<1479::AI D-JOC325>3.0.CO;2-P [4] D. A. Wilhite “Drought as Natural Hazard: Concepts and Definitions,” In: D. A. Wilhite, Ed., Drought: A Global Assessment, Routledge, 2000, pp. 3-18. [5] H. Wu, M. J. Hayes, A. Weiss and H. Qi, “An Evaluation of the Standardized Precipitation Index, The China-Z In- dex and the Statistical Z-score,” International Journal of Climatology, Vol. 21, No. 6, 2001, pp. 745-758. doi:10.1002/joc.658 [6] E. K. Sonmez, A. U. Komuscu, A. Erkan and E. Turgu, “An Analysis of Spatial and Temporal Dimension of Drought Vulnerability in Turkey Using the Standardized Precipitation Index,” Natural Hazards, Vol. 35, No. (2, 2005, pp. 243-264. doi:10.1007/s11069-004-5704-7 [7] K. Hewitt, “Regions of Risk: A Geographical Introduction to Disasters,” Longman, Essex, 1997. [8] C. Bhuiyan, R. P. Singh and F. N. Kogan, “Monitoring Drought Dynamics in the Aravalli Region (India) Using Different Indices Based on Ground and Remote Sensing Data,” International Journal of Applied Earth Observa- tion and Geoinformation, Vol. 8, No. 4, 2006, pp. 289- 302. doi:10.1016/j.jag.2006.03.002 [9] G. O. P. Obasi, “WMO’s Role in the International Decade Copyright © 2011 SciRes. JEP  The Spatio-Temporal-Severity Dynamics of Drought in Botswana 814 for Natural Disaster Reduction,” Bulletin of the American Meteorological Society, Vol. 75, No. 9, 1994, pp. 1655- 1661. doi:10.1175/1520-0477(1994)075<1655:WRITID>2.0.C O;2 [10] D. A. Wilhite and M. H. Glantz, “Understanding the Drought Phenomenon: The Role of Definitions,” Water International, Vol. 10, No. 3, 1985, pp. 111-120. doi:10.1080/02508068508686328 [11] K. Rasmussen, B. Fog and J. E. Madsen, “Desertification in Reverse? Observations from Northern Burkina Faso,” Global Environmental Change, Vol. 11, No. 4, 2001, pp. 271-282. doi:10.1016/S0959-3780(01)00005-X [12] R. R. Heim “A Review of Twentieth-Century Drought Indices Used in the United States,” Bulletin of the Ameri- can Meteorological Society, Vol. 83, 2002, pp. 1149- 1165. [13] J. Kenyantash and J. A. Dracup, “The Quantification of Drought: An Evaluation of Drought Indices,” Bulletin of the American Meteorological Society, Vol. 83, No. 8, 2002, pp. 1167-1180. [14] J. A. Dracup, K. S. Lee and E. G. Paulson, “On the Defi- nition of Droughts,” Water Resources Research, Vol. 16, No. 2, 1980, pp. 297-302. doi:10.1029/WR016i002p00297 [15] T. B. McKee, N. J. Doesken and J. Kleist, “The Relation- ship of Drought Frequency and Duration to Time Scales,” Proceedings of the Eighth Conference on Applied Clima- tology, American Meteorological Society, Boston, 1993, pp. 179-184. [16] T. B. McKee, N. J. Doesken and J. Kleist, “Drought Monitoring with Multiple Timescales,” Eighth Confer- ence on Applied Climatology, Anaheim, CA, American Meteorological Society, 1993, pp. 179-184. [17] J. Mitchell, N. Devine and K. Jagger, “A Contextual Model of Natural Hazards,” Geographical Review, Vol. 79, No. 4, 1989, pp. 391-409. doi:10.2307/215114 [18] IPCC, “Climate variability,” In: J. J. McCarthy, O. F. Canziani, N. A. Leary, D. J. Dokken and K. S. White, Eds., impacts, adaptation, and vulnerability, Cambridge University Press, Cambridge, 2001. [19] B. Smit and O. Pilifosova, “An Anatomy of Adaptation to Climate Change and Variability,” Climate Change, Vol. 45, 2002, pp. 223-251. doi:10.1023/A:1005661622966 [20] A. L. Luers, D. B. Lobell, L. S. Sklar, C. L. Addams and P. A. Matson, “A Method for Quantifying Vulnerability, Applied to the Agricultural System of the Yaqui Valley, Mexico,” Global Environmental Change, Vol. 13, No. 4, 2003, pp. 255-267. doi:10.1016/S0959-3780(03)00054-2 [21] B. L. Turner II, R. E. Kasperson, P. A. Matson, J. J. McCarthy, R. W. Corell, L. Christensen, N. Eckley, J. X. Kasperson, A. Luers, M. L. Martello, C. Polsky, A. Pul- sipher and A. Schiller, “A Framework for Vulnerability Analysis in Sustainability Science,” Proceedings of the National Academy of Sciences US 100, 2003, pp. 8074- 8079. doi:10.1073/pnas.1231335100 [22] B. L. Turner II, P. A. Matson, J. J. McCarthy, R. W. Corell, L. Christensen, N. Eckley, G. K. Hovelsrud-Broda, J. X. Kasperson, R. E. Kasperson, A. Luers, M. L. Mar- tello, S. Mathiesen, R. Naylor, C. Polsky, A. Pulsipher, A. Schiller, H. Selin and N. Tyler, “A Framework for Vul- nerability Analysis in Sustainability Science,” Proceed- ings of the National Academy of Sciences US 100, 2003, pp. 8080-8085. doi:10.1073/pnas.1231334100 [23] R. Chambers, “Editorial Introduction: Vulnerability, Cop- ing and Policy,” Institute for Development Studies, Vol. 37, 2006, pp. 33-40. [24] H. G. Bohle, T. E. Downing and M. J. Watts, “Climate Change and Social Vulnerability. Toward a Sociology and Geography of Food Insecurity,” Global Environmental Change, Vol. 4, No. 1, 1994, pp. 37-48. doi:10.1016/0959-3780(94)90020-5 [25] P. M. Kelly and W. N. Adger, “Theory and Practice in Assessing Vulnerability to Climate Change and Facilitat- ing Adaptation,” Climatic Change, Vol. 47, 2000, pp. 325-352. doi:10.1023/A:1005627828199 [26] O. V. Wilmelmi and D. A. Wilhite, “Assessing Vulner- ability to Agricultural Drought: A Nebraska Case Study,” Natural Hazards, Vol. 25, No. 1, 2002, pp. 37-58. doi:10.1023/A:1013388814894 [27] P. Blaikie, T. Cannon, I. Davis and B. Wisner, “At risk: Natural hazards, people vulnerability, and disasters,” Routledge Publishers, London, 1994. [28] T. E. Downing, “Human Dimensions Research: Toward a Vulnerability Science?” International Human Dimensions Program Update, Vol. 3, 2000, pp. 16-17. [29] R. Leichenko and K. O’Brien, “The Dynamics of Rural Vulnerability to Global Change: The Case of Southern Africa,” Mitigation and Adaptation Strategies for Global Change, Vol. 7, No. 4, 2002, pp. 1-18. doi:10.1023/A:1015860421954 [30] J. J. McCarthy, O. F. Canziani, N. A. Leary, D. J. Dokken and K. S. White, “Impacts, Adaptation, and Vulnerability. Contribution of Working Group II to the Third Assess- ment Report of the International Panel on Climate Change,” Cambridge University Press, Cambridge, 2001. [31] D. Schroter, C. Polsky and A. G. Patt, “Assessing Vul- nerabilities to the Effects of Global Change: An Eight- Step Approach,” Mitigation and Adaptation Strategies for Global Change, Vol. 10, No. 3, 2005, pp. 573-595. doi:10.1007/s11027-005-6135-9 [32] C. Polsky, R. Neff and B. Yarnal, “Building Comparable Global Change Vulnerability Assessments: The Vulner- ability Scoping Diagram,” Global Environmental Change, Vol. 17, No. 3-4, 2007, pp. 472-485. doi:10.1016/j.gloenvcha.2007.01.005 [33] K. Dow, R. E. O’Connor, B. Yarnal, G. J. Carbone and C. L. Jocoy, “Why Wory? Community Water System Man- agers’ Perceptions of Climate Vulnerability,” Global En- vironmental Change, Vol. 17, No. 2, 2007, pp. 228-237. doi:10.1016/j.gloenvcha.2006.08.003 [34] B. Smit and O. Pilifosova, “From Adaptation of Adaptive capacity and Vulnerability Reduction,” In: J. Smith, R. T. Copyright © 2011 SciRes. JEP 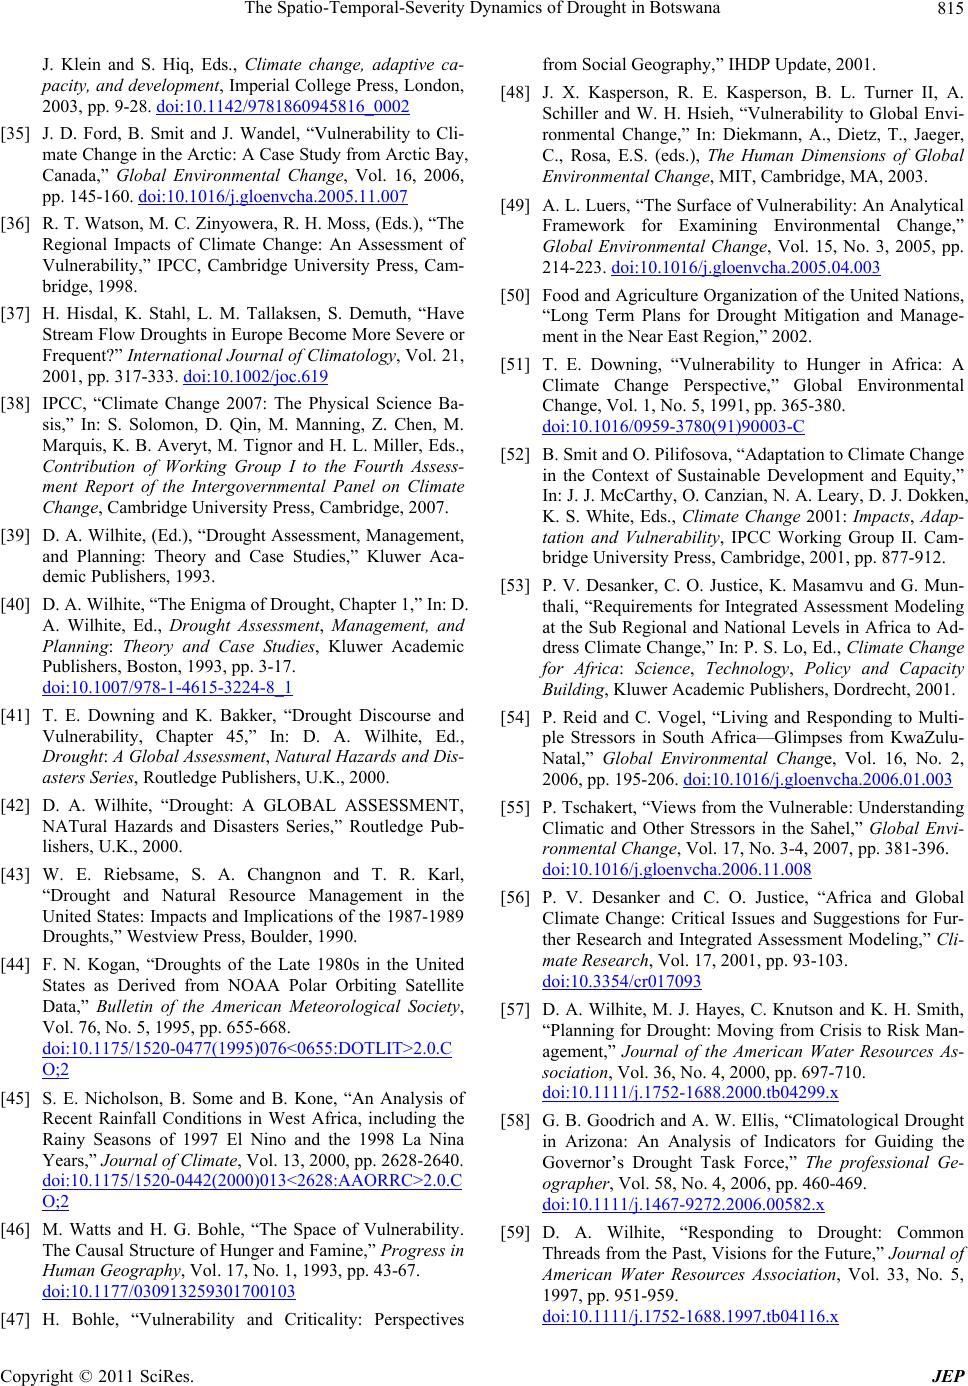 The Spatio-Temporal-Severity Dynamics of Drought in Botswana815 J. Klein and S. Hiq, Eds., Climate change, adaptive ca- pacity, and development, Imperial College Press, London, 2003, pp. 9-28. doi:10.1142/9781860945816_0002 [35] J. D. Ford, B. Smit and J. Wandel, “Vulnerability to Cli- mate Change in the Arctic: A Case Study from Arctic Bay, Canada,” Global Environmental Change, Vol. 16, 2006, pp. 145-160. doi:10.1016/j.gloenvcha.2005.11.007 [36] R. T. Watson, M. C. Zinyowera, R. H. Moss, (Eds.), “The Regional Impacts of Climate Change: An Assessment of Vulnerability,” IPCC, Cambridge University Press, Cam- bridge, 1998. [37] H. Hisdal, K. Stahl, L. M. Tallaksen, S. Demuth, “Have Stream Flow Droughts in Europe Become More Severe or Frequent?” International Journal of Climatology, Vol. 21, 2001, pp. 317-333. doi:10.1002/joc.619 [38] IPCC, “Climate Change 2007: The Physical Science Ba- sis,” In: S. Solomon, D. Qin, M. Manning, Z. Chen, M. Marquis, K. B. Averyt, M. Tignor and H. L. Miller, Eds., Contribution of Working Group I to the Fourth Assess- ment Report of the Intergovernmental Panel on Climate Change, Cambridge University Press, Cambridge, 2007. [39] D. A. Wilhite, (Ed.), “Drought Assessment, Management, and Planning: Theory and Case Studies,” Kluwer Aca- demic Publishers, 1993. [40] D. A. Wilhite, “The Enigma of Drought, Chapter 1,” In: D. A. Wilhite, Ed., Drought Assessment, Management, and Planning: Theory and Case Studies, Kluwer Academic Publishers, Boston, 1993, pp. 3-17. doi:10.1007/978-1-4615-3224-8_1 [41] T. E. Downing and K. Bakker, “Drought Discourse and Vulnerability, Chapter 45,” In: D. A. Wilhite, Ed., Drought: A Global Assessment, Natural Hazards and Dis- asters Series, Routledge Publishers, U.K., 2000. [42] D. A. Wilhite, “Drought: A GLOBAL ASSESSMENT, NATural Hazards and Disasters Series,” Routledge Pub- lishers, U.K., 2000. [43] W. E. Riebsame, S. A. Changnon and T. R. Karl, “Drought and Natural Resource Management in the United States: Impacts and Implications of the 1987-1989 Droughts,” Westview Press, Boulder, 1990. [44] F. N. Kogan, “Droughts of the Late 1980s in the United States as Derived from NOAA Polar Orbiting Satellite Data,” Bulletin of the American Meteorological Society, Vol. 76, No. 5, 1995, pp. 655-668. doi:10.1175/1520-0477(1995)076<0655:DOTLIT>2.0.C O;2 [45] S. E. Nicholson, B. Some and B. Kone, “An Analysis of Recent Rainfall Conditions in West Africa, including the Rainy Seasons of 1997 El Nino and the 1998 La Nina Years,” Journal of Climate, Vol. 13, 2000, pp. 2628-2640. doi:10.1175/1520-0442(2000)013<2628:AAORRC>2.0.C O;2 [46] M. Watts and H. G. Bohle, “The Space of Vulnerability. The Causal Structure of Hunger and Famine,” Progress in Human Geography, Vol. 17, No. 1, 1993, pp. 43-67. doi:10.1177/030913259301700103 [47] H. Bohle, “Vulnerability and Criticality: Perspectives from Social Geography,” IHDP Update, 2001. [48] J. X. Kasperson, R. E. Kasperson, B. L. Turner II, A. Schiller and W. H. Hsieh, “Vulnerability to Global Envi- ronmental Change,” In: Diekmann, A., Dietz, T., Jaeger, C., Rosa, E.S. (eds.), The Human Dimensions of Global Environmental Cha ng e , MIT, Cambridge, MA, 2003. [49] A. L. Luers, “The Surface of Vulnerability: An Analytical Framework for Examining Environmental Change,” Global Environmental Change, Vol. 15, No. 3, 2005, pp. 214-223. doi:10.1016/j.gloenvcha.2005.04.003 [50] Food and Agriculture Organization of the United Nations, “Long Term Plans for Drought Mitigation and Manage- ment in the Near East Region,” 2002. [51] T. E. Downing, “Vulnerability to Hunger in Africa: A Climate Change Perspective,” Global Environmental Change, Vol. 1, No. 5, 1991, pp. 365-380. doi:10.1016/0959-3780(91)90003-C [52] B. Smit and O. Pilifosova, “Adaptation to Climate Change in the Context of Sustainable Development and Equity,” In: J. J. McCarthy, O. Canzian, N. A. Leary, D. J. Dokken, K. S. White, Eds., Climate Change 2001: Impacts, Adap- tation and Vulnerability, IPCC Working Group II. Cam- bridge University Press, Cambridge, 2001, pp. 877-912. [53] P. V. Desanker, C. O. Justice, K. Masamvu and G. Mun- thali, “Requirements for Integrated Assessment Modeling at the Sub Regional and National Levels in Africa to Ad- dress Climate Change,” In: P. S. Lo, Ed., Climate Change for Africa: Science, Technology, Policy and Capacity Building, Kluwer Academic Publishers, Dordrecht, 2001. [54] P. Reid and C. Vogel, “Living and Responding to Multi- ple Stressors in South Africa—Glimpses from KwaZulu- Natal,” Global Environmental Change, Vol. 16, No. 2, 2006, pp. 195-206. doi:10.1016/j.gloenvcha.2006.01.003 [55] P. Tschakert, “Views from the Vulnerable: Understanding Climatic and Other Stressors in the Sahel,” Global Envi- ronmental Change, Vol. 17, No. 3-4, 2007, pp. 381-396. doi:10.1016/j.gloenvcha.2006.11.008 [56] P. V. Desanker and C. O. Justice, “Africa and Global Climate Change: Critical Issues and Suggestions for Fur- ther Research and Integrated Assessment Modeling,” Cli- mate Research, Vol. 17, 2001, pp. 93-103. doi:10.3354/cr017093 [57] D. A. Wilhite, M. J. Hayes, C. Knutson and K. H. Smith, “Planning for Drought: Moving from Crisis to Risk Man- agement,” Journal of the American Water Resources As- sociation, Vol. 36, No. 4, 2000, pp. 697-710. doi:10.1111/j.1752-1688.2000.tb04299.x [58] G. B. Goodrich and A. W. Ellis, “Climatological Drought in Arizona: An Analysis of Indicators for Guiding the Governor’s Drought Task Force,” The professional Ge- ographer, Vol. 58, No. 4, 2006, pp. 460-469. doi:10.1111/j.1467-9272.2006.00582.x [59] D. A. Wilhite, “Responding to Drought: Common Threads from the Past, Visions for the Future,” Journal of American Water Resources Association, Vol. 33, No. 5, 1997, pp. 951-959. doi:10.1111/j.1752-1688.1997.tb04116.x Copyright © 2011 SciRes. JEP  The Spatio-Temporal-Severity Dynamics of Drought in Botswana Copyright © 2011 SciRes. JEP 816 [60] C. Knutson, M. Hayes and T. Philips, “How to Reduce Drought Risk, Western Drought Coordination Council Preparedness and Mitigation Group,” National Drought Mitigation Center, Lincoln, Nebraska, 1998. http://drought.unl.edu/plan/handbook/risk.pdf [61] L. Telesca, “Time-Clustering of Natural Hazards,” Natu- ral Hazards, Vol. 40, No. 3, 2007, pp. 593-601. doi:10.1007/s11069-006-9023-z [62] I. Bordi, S. Frigio, P. Parenti, A. Speranza and A. Sutera, “The Analysis of the Standardized Precipitation Index in the Mediterranean Area: Large-Scale Patterns,” Annals of Geophysics, Vol. 44, No. 5-6, 2001, pp. 965-978. [63] J. G. Lockwood, “Causes of Climate,” John Wiley and Sons, New York, 1979. [64] L. S. Unganai and F. N. Kogan, “Southern Africa’s Re- cent Drought from Space,” Advances in Space Research, Vol. 21, No. 3, 1998, pp. 507-511. doi:10.1016/S0273-1177(97)00888-0 [65] T. B. McKee, N. J. Doesken and J. Kleist, “Drought Monitoring with Multiple Time Scales,” Proceedings of the 9th Conference on Applied Climatology, 15-20 January 1995, Dallas, TX, American Meteorological Society, pp. 233-236. [66] D. C. Edwards and T. B. McKee, “Characteristics of 20th Century Drought in the United States at Multiple Time Scales,” Atmospheric Science Paper No. 634, 1997, pp. 1-30. [67] A. U. Komuscu, “Using the SPI to Analyze Spatial and Temporal Patterns of Drought in Turkey,” Drought Net- work News, Vol. 11, 1999, pp. 7-13. [68] I. Livada and V. D. Assimakopoulos, “Spatial and Tem- poral Analysis of Drought in Greece Using the Standard- ized Precipitation Index (SPI),” Theoretical and Applied Climatology, Vol. 89, No. 3-4, 2007, pp. 143-153. doi:10.1007/s00704-005-0227-z [69] M. Svoboda, D. LeComte, M. Hayes, R. Heim, K. Gleason, J. Angel, B. Rippey, R. Tinker, M. Palecki, D. Stooksbury, D. Miskus and S. Stephens, “The Drought Monitor,” Bul- letin of the American Meteorological Society, Vol. 83, No. 8, 2002, pp. 1181-1190. [70] R. Romero, J. A. Guijarro and S. Alonso, “A 30-Year (1964-1993) Daily Rainfall Data Base for the Spanish Mediterranean Regions: First Exploratory Study,” Inter- national Journal of Climatology, Vol. 18, No. 3, 1998, pp. 299-316. [71] E. L. Tompkins, “Planning for Climate Change in Small Islands: Insights from National Hurricane Preparedness in the Cayman Islands,” Global Environmental Change, Vol. 15, (2, 2005, pp. 139-149. [72] W. J. Werick, “National Study of Water Management during Drought: Results-Oriented Water Resources Man- agement,” In: Water Management in the 90’s, ASCE, New York, 1993, pp. 445-450. [73] W. Whipple, “New Perspectives in Water Supply,” Lewis Publ., Boca Raton, Florida, 1994, 218 Pages. [74] M. Bazza, “Water Resources Planning and Management for Drought Mitigation,” Regional Workshop on Capacity Building on Drought Mitigation in the Near East, Rabat, Morocco, 2002.
|