 Open Journal of Urology, 2011, 1, 28-36 doi:10.4236/oju.2011.13008 Published Online August 2011 (http://www.SciRP.org/journal/oju) Copyright © 2011 SciRes. OJU Correlation of PSA Density to Prostate Cancer Based on Pr ostate Volume by 3.0 T MRI Rulon L. Hardman1*, Yuanyuan Liang2,3, Steve Ware1, Adam J. Jung, Qi Peng1, Fadi El-Merhi1, Yumin Chen2, Ian M. Thompson3 1Department of Radi ology, Univ ersity of Texas Health Science Center at San Anto ni o, San Antoni o, USA 2Department of Epi demiology and Biostat i st i c s , University of Texas Health Science Center at San Anto ni o, San Antoni o, USA 3Department of Ur ol o gy, University of Texas Health Science Center at San Antonio, San A nt o nio, USA E-mail: Hardmanr@uthscsa.edu Received March 1, 2011; revised May 13, 2011; accepted June 20, 2011 Abstract Purpose: Prostate specific antigen levels can be normalized by the prostate volume to give a prostate specific antigen density (PSAd). Magnetic resonance imaging (MRI) can more accurately determine prostate zonal anatomy and prostate volumes compared to transrectal ultrasound, and hence may lead to more accurate PSAd measurements. Methods: Imaging and pathology of men undergoing prostate MRI from April 2007 to May 2009 were reviewed in this retrospective study. 73 patients were included for analysis, of which 45 had prostate cancer and 28 did not have cancer. Total, transitional zone, and peripheral zone values were deter- mined by ultrasound prolate ellipse, MRI prolate ellipse, and MRI segmentation methods. Results: The study population showed an average PSA of 6.3 ng/mL, with the control mean PSA (8.8 ng/mL) being greater than the cancer group (5.3 ng/mL). Transrectal ultrasound underestimated the prostate volume (mean 27.7 mL versus MRI volume of 38.3 mL, p ≤ 0.001). No difference was seen between cancer and control populations using PSAd. PSAd correctly categorized low (Gleason < 7) and high-grade cancers (Gleason ≥ 7) in patients with malignancy. Conclusion: Transrectal ultrasound underestimates prostate volumes and hence is inaccu- rate in calculating PSAd. MRI more accurately depicts PSAd, however PSAd is unable to differentiate be- tween patients with cancer and benign disease such as BPH or prostatitis. Keywords: Magnetic Resonance Imaging, Prostatic Neoplasm, Prostate-Specific Antigen 1. Introduction Prostate specific antigen (PSA) is a commonly used tu- mor marker in screening patients for prostate cancer risk [1,2]. A typical cut off value of 4.0 ng/mL indicates an abnormal result [1]. However, the test is not specific as other pathologies including inflammation and benign prostatic hyperplasia (BPH) can increase PSA [1]. Cur- rent PSA recommendations lead to significant over- treatment and associated morbidity from unnecessary biopsies, as well as psychological stress in the patient. For these reasons, many have advocated normalizing the PSA by the volume of the prostate gland, yielding a PSA density (PSAd) [3-5]. The use of PSAd for cancer diagnosis is controversial with studies both confirming and refuting the use of PSAd [6-10]. In an effort to further improve the specific- ity, PSAd can be based on the transitional zone of the prostate, the region of the prostate most affected by BPH changes, however, these result remain controversial [6-8, 11]. A possible explanation for the lack of added speci- ficity of PSAd may be that the volume of the prostate is typically determined by transrectal ultrasound, which is inaccurate in determining prostate volume [12,13]. Pros- tate MRI can accurately depict prostate zonal anatomy. MRI has been shown to be useful in differentiating high-grade and low-grade cancer, but groups have not shown their results for sensitivity for detecting cancer [14-17]. We undertook the study to determine the accu- racy of PSAd, calculated using MRI and transrectal ul- trasound, in characterizing benign from malignant dis- ease in a population with persistently elevated PSA.  R. L. HARDMAN ET AL. 29 2. Methods Investigational Review Board (IRB) consent was ob- tained and Health Insurance Portability and Accountabil- ity Act (HIPAA) and confidentiality practices were fol- lowed. Patients were referred for prostate MRI for staging, cancer follow-up, or being high risk for prostate cancer (based on elevated PSA or palpable nodule). Patients were excluded from analysis if they had any prostate volume altering therapies, including 5-alpha inhibitor treatment, brachytherapy or cryoablation. Patients were also excluded if pathologic biopsy or prostatectomy re- sults could not be obtained. All patients underwent a prostate MRI on a 3.0 Tesla platform (Achieva, Philips Healthcare, Best, Netherlands) using combined cardiac phase array coil (Philips Health- care, Best, Netherlands), and endorectal coil (BPX-30, Medrad, Pittsburgh, PA). High resolution T2W protocol was performed by a fast spin-echo sequence covering the prostate and seminal vesicles. The scan parameters were: TR/TE (3000 - 4000)/110 ms, echo train length = 20, slice thickness = 3 mm, interslice gap = 0 mm, field of view = 14 × 14 cm2, matrix 500 × 550, fold-over direc- tion left to right, 3 excitations, and in-plane resolution of 0.3 × 0.3 mm2. High-resolution T2W sequences were used for volume measurement as they depict the prostate in the greatest detail. Axial and sagittal images were analyzed to determine the prostate volume by prolate ellipse and segmentation methods (Figure 1). The anterior-posterior, cranial- caudal, and transverse dimensions were taken of the total prostate and transitional zone at the widest portion of the prostate. The prostate volume was then determined using Equation (1). The volume of an object may also be ap- proached by taking thin segments though the object and adding the areas of each segment, also known as seg- mentation. Segmentation was performed by drawing a region of interest around the total prostate and transi- tional zone on each axial image slice. The sum of the areas was then multiplied by the slice thickness (3 mm) and the segmented volumes were summed to determine the total prostate volume. Prostate Volume = AP × CC × Trans × 0.52 (1) Patient records were reviewed to determine pathology from pre- and post- MRI biopsies and prostatectomy. Prostate volumes based on digital rectal exam and trans- rectal ultrasound was also recorded when available and recorded. Data was only available on 52 out of the 92 men. The maximum time from ultrasound to MRI meas- urement was 6 months. Three urologists (26 years, 13 years, and 6 years experience) at our institution per- formed all biopsies and ultrasound volume calculations using a standard prolate ellipse methodology. Transrectal ultrasound measurements were performed using the Hawk 2102 XDI Ultrasound Scanner (B-K Medical, Herlev, Denmark). A single radiologist (4 years experi- ence) performed all MRI calculations. The most recent PSA prior to the prostate MRI was used for PSAd calcu- lations. The PSA density was determined by dividing the PSA by the ultrasound volume, prolate ellipse MRI vo- lume, and segmentation MRI volume. Peripheral zone volume was determined by subtracting the transitional zone volume from the total prostate volume. Statistical Methods Seven different PSA densities were calculated by di- viding the PSA by various prostate volumes (total pros- tate volume, transitional zone volume, or peripheral zone volume) using different methods (ultrasound, prolate ellipse or segmentation). Areas underneath the receiver- (a) (b) (c) Figure 1. Prostate volume calculation. Image (a) and (b) show the measurements for the prolate ellipse method. The black line demarcates the total prostate. The white line shows the central gland. Image (c) shows the segmentation curves placed round the prostate margins. The volume is calculated by adding each slice area. a Copyright © 2011 SciRes. OJU  R. L. HARDMAN ET AL. Copyright © 2011 SciRes. OJU 30 operating characteristic (ROC) curve (AUCs) were cal- culated for PSA and various PSAds using the Wilcoxon statistic, and nonparametric U-statistic method was used performing the differences between AUCs [18] with ap- propriate Bonferroni adjustment. Comparison was con- ducted between the patients with aggressive cancer and the patients with no cancer or low-grade cancer using a Mann-Whitney U test. All statistical tests were performed at a significance level of 0.05 (two sided) and conducted using SAS (Ver- sion 9.2, Cary, NC: SAS Institute Inc.). 3. Results Patient demographics are summarized in Table 1. A total of 92 patients underwent prostate MRI from April 2007 to May 2009. 73 patients were included for analysis us- ing our inclusion criteria. 16 patients underwent prosta- tectomy with 57 men only having pathology based on TRUS biopsy. 45 patients had pathologic evidence of prostate cancer. The average PSA was 8.3 ng/mL ± 8.3 (mean ± standard deviation) (range 0.3 - 54.3). The mean Gleason score was 6.67 ± 0.83. The average number of prior biopsies was 2.26 ± 1.06 (range 1 - 6) and the av- erage number of prior biopsy cores per patient was 24.7 ± 12.1 (range 6 - 77). Median PSA was significantly higher in the non-cancer group compared to the cancer group (8.8 ng/mL vs. 5.3 ng/mL, p = 0.03). Median tran- sitional zone volume was also higher in the non-cancer group but was not statistically significant (p = 0.09 by prolate ellipse method; p = 0.06 by segmentation me- thod). There was no significant difference between the cancer and non-cancer groups in terms of age, race or other types of prostate volumes. 3.1. Volume Measurements Transrectal ultrasound data was available on 52 patients. The comparison of total prostate volume measured using transrectal ultrasound and MRI (prolate ellipse or seg- mentation) are summarized in Table 2 . Mean ultrasound volumes were significantly smaller than MRI volumes, except for the subset of non-cancer patients with ultra- sound volumes greater than 30 mL3. The comparison of MRI prolate ellipse and segmentation methods are sum- marized in Table 2 as well. The prolate ellipse method significantly under-estimates the transitional zone vol- ume and total prostate volume (transitional zone volume: Table 1. Patient characteristics. Characteristic Cancer (n = 45) Non-cancer (n = 28)All Subjects (n = 73) P-value Age (year) Mean (SD) 69.4 (10) 69.3 (8.3) 69.3 (9.3) 0.961 Race White 35 (77.8) 25 (89.3) 60 (82.2) 0.482 N (%) Black 8 (17.8) 2 (7.1) 10 (13.7) Hispanic 2 (4.4) 1 (3.6) 3 (4.1) PSA (ng/mL) Median (Q1, Q3) 5.3 (2.7, 8.1) 8.8 (5.2, 11.2) 6.3 (3.6, 9.8) 0.031 <2 3 (6.7) 2 (7.1) 5 (6.8) 0.12 N (%) 2 - 4 13 (28.9) 2 (7.1) 15 (20.5) 4 - 10 21 (46.7) 15 (53.6) 36 (49.3) ≥10 8 (17.8) 9 (32.1) 17 (23.3) Prostate Volumes (mL3) Total 3 U Vol 27.7 (22.2, 40.8) 26.4 (24.1, 59.5) 27.1 (22.4, 42.5) 0.371 Transitional VolE 16.6 (11.3, 29.6) 24.4 (15.9, 39) 20.2 (11.8, 35.2) 0.091 Peripheral VolE 16.7 (12.9, 20.2) 16.7 (13, 23.4) 16.7 (12.9, 23) 0.751 Median (Q1, Q3) Total VolE 35.3 (25.7, 49.7) 42 (31.5, 65) 37.5 (26, 57.1) 0.121 Transitional VolS 18.5 (13.5, 31.3) 24.4 (17.2, 46.4) 20.1 (14.5, 40.5) 0.061 Peripheral VolS 17 (15.2, 20.7) 18.7 (14.1, 23.6) 17.1 (14.9, 22.5) 0.51 Total VolS 38.3 (28.1, 47.4) 44.3 (32.9, 71.4) 39.8 (30.3, 60.2) 0.121 Gleason grade <7 24 (53.3) NA N (%) ≥7 21 (46.7)  R. L. HARDMAN ET AL. 31 Table 2. Comparison of total prostate volume measured by different approaches and comparison of transitional zone volume, peripheral zone volume and total prostate volume measured by prolate ellipse method vs. segmentation method. All subjects Statistics Ultrasound Prolate ellipse Segmentation P-value ALL N 52 73 73 Median 27.05 37.5 39.8 <0.001 (Q1, Q3) (22.4, 42.5) (26, 57.1) (30.3, 60.2) VolU < 30 N 30 30 30 Median 23.15 26.2 29.85 <0.001 (Q1, Q3) (20.5, 25.6) (23.6, 33.2) (26.7, 35.1) VolU ≥ 30 N 22 22 22 Median 44.05 57 57.5 0.02 (Q1, Q3) (39.7, 60.4) (43.8, 81.9) (45.5, 83.9) All subjects (N = 73) Statistics Prolate ellipse Segmentation P-value Transitional Median 20.2 20.1 0.002 (Q1, Q3) (11.8, 35.2) (14.5, 40.5) Peripheral Median 16.7 17.1 0.18 (Q1, Q3) (12.9, 23) (14.9, 22.5) Total Median 37.5 39.8 <0.001 p = 0.002 for all subjects; total prostate volume: p < 0.001 for all subjects). Prolate ellipse and segmentation meth- ods were similar for peripheral zone volume calculations p = 0.18 for all subjects. 3.2. PSA Density The average PSA in this population was lower in the cancer group than in the benign prostatic hypertrophy group (p = 0.03). The descriptive and diagnostic statistics of PSA and PSA density based on transitional zone volume, total prostate volume, and peripheral zone vol- umes using MRI prolate ellipse or segmentation methods or ultrasound are summarized in Table 3. Only the pe- ripheral zone PSAd was significantly different between the BPH and cancer groups, based prolate ellipse or segmentation calculations (p = 0.03 for both calcula- tions). The medians of the rest of the biomarkers are not significantly different between cancer and non-cancer groups. All AUCs were below 0.5 indicating all the markers were under-expressed in cancer in this sample. PSA and PSAds are also compared between cancer groups, high-grade cancer (Gleason ≥ 7) and low-grade/ non-cancer (Gleason score < 7). As shown in Table 4, all markers were significantly higher in the high-grade can- cer group compared to low-grade cancer/non-cancer group. The median values of ultrasound PSAd and seg- mentation transitional zone PSAd were significantly higher in high-grade cancer group compared to non- cancer or low-grade cancer groups. The AUCs for ultra- sound PSAd and segmentation transitional zone PSAd were 0.68 (95% CI: 0.52 - 0.83) and 0.67 (95% CI: 0.54 - 0.8), respectively, which were higher, although not sig- nificantly different than the AUC for PSA of 0.57 (95% CI: 0.43 - 0.71) (Figure 2). 4. Discussion PSA is a commonly used tool to screen men for possible prostate cancer. While a cutoff of 4.0 ng/mL is fre- quently used to indicate greater cancer risk, the value often over-diagnoses many men, leading to significant morbidity from biopsies and surgeries [19]. PSA alone has no effect on long-term cancer survival [20,21]. One major hindrance to PSA testing is its lack of specificity. Benign prostatic hypertrophy is known to increase PSA, accounting for up to 85% of cases with a PSA between 4.1 - 10.0 ng/mL [22]. Infl mmation can also increase a Copyright © 2011 SciRes. OJU 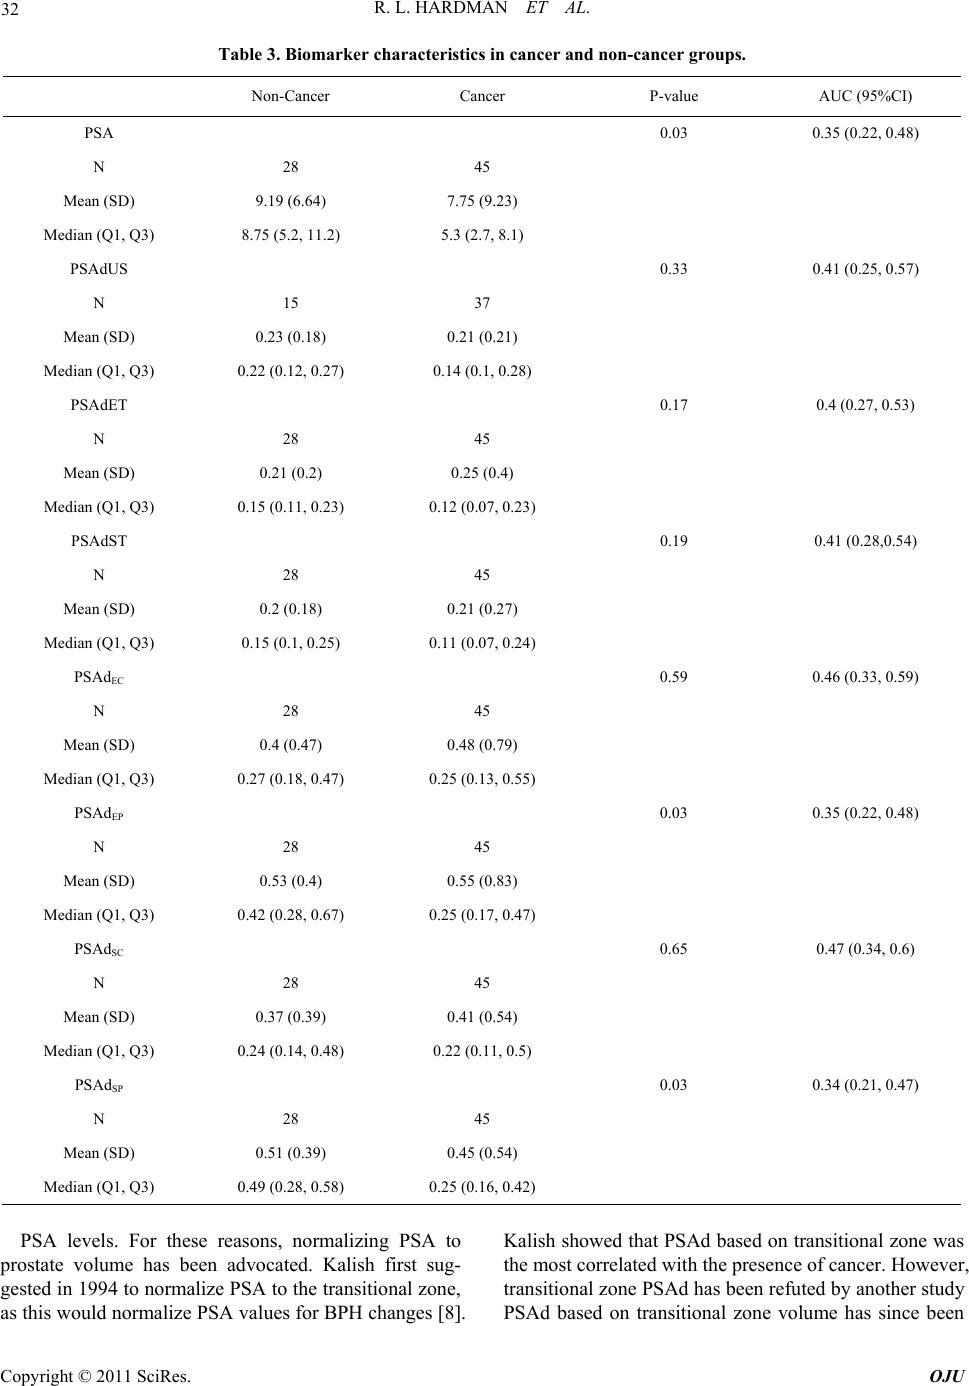 32 R. L. HARDMAN ET AL. Table 3. Biomarker characteristics in cancer and non-cancer groups. Non-Cancer Cancer P-value AUC (95%CI) PSA 0.03 0.35 (0.22, 0.48) N 28 45 Mean (SD) 9.19 (6.64) 7.75 (9.23) Median (Q1, Q3) 8.75 (5.2, 11.2) 5.3 (2.7, 8.1) PSAdUS 0.33 0.41 (0.25, 0.57) N 15 37 Mean (SD) 0.23 (0.18) 0.21 (0.21) Median (Q1, Q3) 0.22 (0.12, 0.27) 0.14 (0.1, 0.28) PSAdET 0.17 0.4 (0.27, 0.53) N 28 45 Mean (SD) 0.21 (0.2) 0.25 (0.4) Median (Q1, Q3) 0.15 (0.11, 0.23) 0.12 (0.07, 0.23) PSAdST 0.19 0.41 (0.28,0.54) N 28 45 Mean (SD) 0.2 (0.18) 0.21 (0.27) Median (Q1, Q3) 0.15 (0.1, 0.25) 0.11 (0.07, 0.24) PSAdEC 0.59 0.46 (0.33, 0.59) N 28 45 Mean (SD) 0.4 (0.47) 0.48 (0.79) Median (Q1, Q3) 0.27 (0.18, 0.47) 0.25 (0.13, 0.55) PSAdEP 0.03 0.35 (0.22, 0.48) N 28 45 Mean (SD) 0.53 (0.4) 0.55 (0.83) Median (Q1, Q3) 0.42 (0.28, 0.67) 0.25 (0.17, 0.47) PSAdSC 0.65 0.47 (0.34, 0.6) N 28 45 Mean (SD) 0.37 (0.39) 0.41 (0.54) Median (Q1, Q3) 0.24 (0.14, 0.48) 0.22 (0.11, 0.5) PSAdSP 0.03 0.34 (0.21, 0.47) N 28 45 Mean (SD) 0.51 (0.39) 0.45 (0.54) Median (Q1, Q3) 0.49 (0.28, 0.58) 0.25 (0.16, 0.42) PSA levels. For these reasons, normalizing PSA to prostate volume has been advocated. Kalish first sug- gested in 1994 to normalize PSA to the transitional zone, as this would normalize PSA values for BPH changes [8]. Kalish showed that PSAd based on transitional zone was the most correlated with the presence of cancer. However, transitional zone PSAd has been refuted by another study PSAd based on transitional zne volume has since been o Copyright © 2011 SciRes. OJU 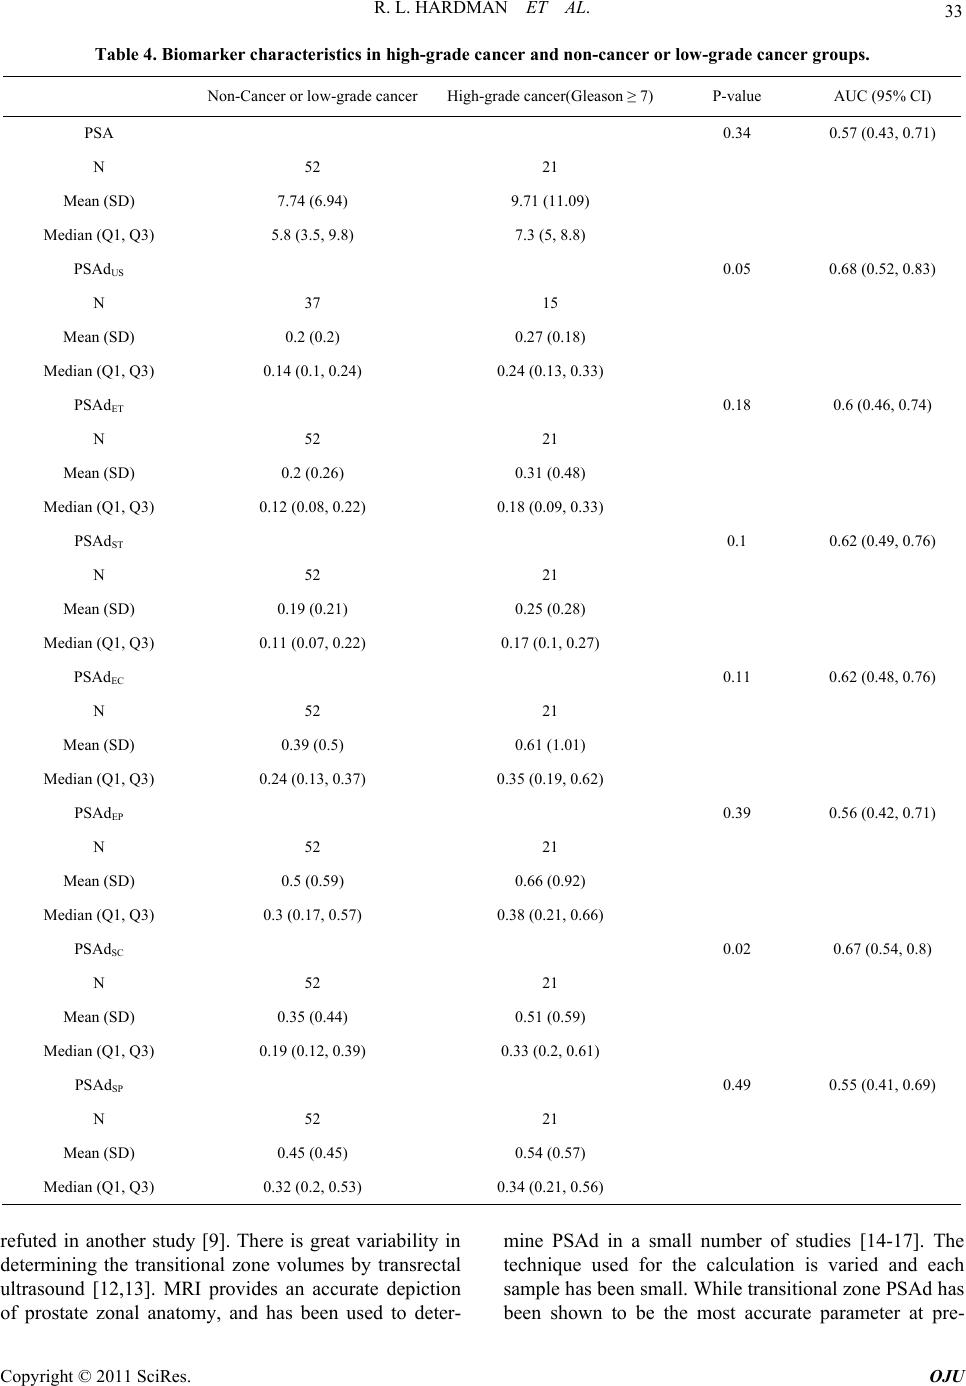 R. L. HARDMAN ET AL. 33 Table 4. Biomarker characteristics in high-grade cancer and non-cancer or low-grade cancer groups. Non-Cancer or low-grade cancerHigh-grade cancer(Gleason ≥ 7) P-value AUC (95% CI) PSA 0.34 0.57 (0.43, 0.71) N 52 21 Mean (SD) 7.74 (6.94) 9.71 (11.09) Median (Q1, Q3) 5.8 (3.5, 9.8) 7.3 (5, 8.8) PSAdUS 0.05 0.68 (0.52, 0.83) N 37 15 Mean (SD) 0.2 (0.2) 0.27 (0.18) Median (Q1, Q3) 0.14 (0.1, 0.24) 0.24 (0.13, 0.33) PSAdET 0.18 0.6 (0.46, 0.74) N 52 21 Mean (SD) 0.2 (0.26) 0.31 (0.48) Median (Q1, Q3) 0.12 (0.08, 0.22) 0.18 (0.09, 0.33) PSAdST 0.1 0.62 (0.49, 0.76) N 52 21 Mean (SD) 0.19 (0.21) 0.25 (0.28) Median (Q1, Q3) 0.11 (0.07, 0.22) 0.17 (0.1, 0.27) PSAdEC 0.11 0.62 (0.48, 0.76) N 52 21 Mean (SD) 0.39 (0.5) 0.61 (1.01) Median (Q1, Q3) 0.24 (0.13, 0.37) 0.35 (0.19, 0.62) PSAdEP 0.39 0.56 (0.42, 0.71) N 52 21 Mean (SD) 0.5 (0.59) 0.66 (0.92) Median (Q1, Q3) 0.3 (0.17, 0.57) 0.38 (0.21, 0.66) PSAdSC 0.02 0.67 (0.54, 0.8) N 52 21 Mean (SD) 0.35 (0.44) 0.51 (0.59) Median (Q1, Q3) 0.19 (0.12, 0.39) 0.33 (0.2, 0.61) PSAdSP 0.49 0.55 (0.41, 0.69) N 52 21 Mean (SD) 0.45 (0.45) 0.54 (0.57) Median (Q1, Q3) 0.32 (0.2, 0.53) 0.34 (0.21, 0.56) refuted in another study [9]. There is great variability in determining the transitional zone volumes by transrectal ultrasound [12,13]. MRI provides an accurate depiction of prostate zonal anatomy, and has been used to deter- mine PSAd in a small number of studies [14-17]. The technique used for the calculation is varied and each sample has been small. While transitional zone PSAd has been shown to be the most accurate parameter at pre- Copyright © 2011 SciRes. OJU 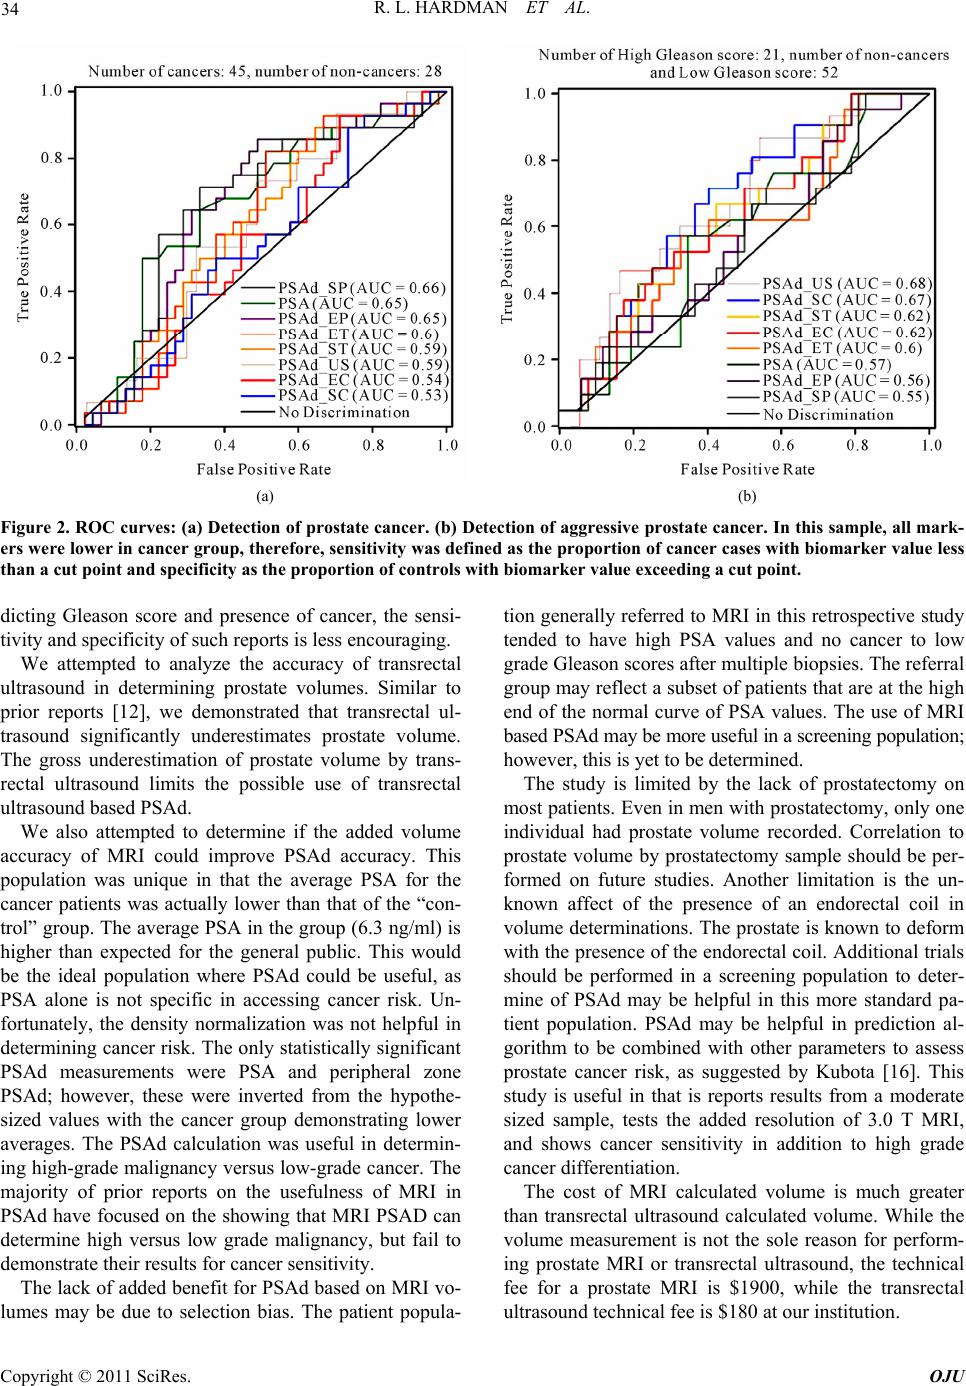 34 R. L. HARDMAN ET AL. (a) (b) Figure 2. ROC curves: (a) Detection of prostate cancer. (b) Detection of aggressive prostate cancer. In this sample, all mark- ers were lower in cancer group, therefore, sensitivity was defined as the proportion of cancer cases with biomarker value less than a cut point and specificity as the proportion of controls with biomarker value exceeding a cut point. dicting Gleason score and presence of cancer, the sensi- tivity and specificity of such reports is less encouraging. We attempted to analyze the accuracy of transrectal ultrasound in determining prostate volumes. Similar to prior reports [12], we demonstrated that transrectal ul- trasound significantly underestimates prostate volume. The gross underestimation of prostate volume by trans- rectal ultrasound limits the possible use of transrectal ultrasound based PSAd. We also attempted to determine if the added volume accuracy of MRI could improve PSAd accuracy. This population was unique in that the average PSA for the cancer patients was actually lower than that of the “con- trol” group. The average PSA in the group (6.3 ng/ml) is higher than expected for the general public. This would be the ideal population where PSAd could be useful, as PSA alone is not specific in accessing cancer risk. Un- fortunately, the density normalization was not helpful in determining cancer risk. The only statistically significant PSAd measurements were PSA and peripheral zone PSAd; however, these were inverted from the hypothe- sized values with the cancer group demonstrating lower averages. The PSAd calculation was useful in determin- ing high-grade malignancy versus low-grade cancer. The majority of prior reports on the usefulness of MRI in PSAd have focused on the showing that MRI PSAD can determine high versus low grade malignancy, but fail to demonstrate their results for cancer sensitivity. The lack of added benefit for PSAd based on MRI vo- lumes may be due to selection bias. The patient popula- tion generally referred to MRI in this retrospective study tended to have high PSA values and no cancer to low grade Gleason scores after multiple biopsies. The referral group may reflect a subset of patients that are at the high end of the normal curve of PSA values. The use of MRI based PSAd may be more useful in a screening population; however, this is yet to be determined. The study is limited by the lack of prostatectomy on most patients. Even in men with prostatectomy, only one individual had prostate volume recorded. Correlation to prostate volume by prostatectomy sample should be per- formed on future studies. Another limitation is the un- known affect of the presence of an endorectal coil in volume determinations. The prostate is known to deform with the presence of the endorectal coil. Additional trials should be performed in a screening population to deter- mine of PSAd may be helpful in this more standard pa- tient population. PSAd may be helpful in prediction al- gorithm to be combined with other parameters to assess prostate cancer risk, as suggested by Kubota [16]. This study is useful in that is reports results from a moderate sized sample, tests the added resolution of 3.0 T MRI, and shows cancer sensitivity in addition to high grade cancer differentiation. The cost of MRI calculated volume is much greater than transrectal ultrasound calculated volume. While the volume measurement is not the sole reason for perform- ing prostate MRI or transrectal ultrasound, the technical fee for a prostate MRI is $1900, while the transrectal ultrasound technical fee is $180 at our institution. Copyright © 2011 SciRes. OJU  R. L. HARDMAN ET AL. 35 In summary, transitional PSAd by MRI segmentation method and transrectal ultrasound PSAd positively cor- related with aggressive cancer. However, PSAd was un- able to demonstrate a statistically significant difference from PSA for detection of cancer risk in our patient pop- ulation. Conflict of interest: Dr. Ian Thompson is a paid con- sultant for Mission Pharmaceutical, which provides compensation to the University of Texas Health Science Center at San Antonio. 5. References [1] J. Hernandez and I. Thompson, “Prostate-Specific Anti- gen: A Review of the Validation of the Most Commonly Used Cancer Biomarker,” A Cancer Journal for Clini- cians, Vol. 101, No. 5, 2004, pp. 894-904. [2] S. Wilson and E. Crawford, “Screening for Prostate Can- cer,” Clinical Genitourinary Cancer, Vol. 3, No. 1, 2004, pp. 21-25. doi:10.3816/CGC.2004.n.008 [3] M. Bazinet, A. Meshref, C. Trudel, S. Aronson, F. PÈlo- quin, M. Nachabe, L. BÈgin and M. Elhilali, “Prospective Evaluation of Prostate-Specificantigen Density and Sys- tematic Biopsies for Early Detection of Prosttic Carci- noma,” Urology, Vol. 43, No. 1, 1994, pp. 44-51. doi:10.1016/S0090-4295(94)80260-2 [4] M. Benson, I. Whang, A. Pantuck, K. Ring, S. Kaplan, C. Olsson and W. Cooner, “Prostate Specific Antigen Den- sity: A Means of Distinguishing Benign Prostatic Hyper- trophy and Prostate Cancer,” The Journal of Urology, Vol. 147, No. 3, 1992, pp. 815-816. [5] E. Seaman, M. Whang, C. Olsson, A. Katz, W. Cooner and M Benson, “Psa Density (Psad). Role in Patient Evaluation and Management,” The Urologic Clinics of North America, Vol. 20, No. 4, 1993, pp. 653-663. [6] B. Djavan, M. Remzi, A. Zlotta, V. Ravery, P. Hammerer, A. Reissigl, P. Dobronski, A. Kaisary and M. Marberger, “Complexed Prostate-Specific Antigen, Complexed Pros- tate-Specific Antigen Density of Total and Transition Zone, Complexed/Total Prostate-Specific Antigen Ratio, Free-to-Total Prostate-Specific Antigen Ratio, Density of Total and Transition Zone Prostate-Specific Antigen: Results of the Prospective Multicenter European Trial,” Urology, Vol. 60, No. 4, 2002, pp. 4-9. doi:10.1016/S0090-4295(02)01896-4 [7] B. Djavan, A. Zlotta, C. Kratzik, M. Remzi, C. Seitz, C. Schulman and M. Marberger, “Psa, Psa Density, Psa Density of Transition Zone, Free/Total Psa Ratio, and Psa Velocity for Early Detection of Prostate Cancer in Men with Serum Psa 2.5 to 4.0 ng/ml,” Urology, Vol. 54, No. 3, 1999, pp. 517-522. [8] J. Kalish, W. Cooner and S. Graham Jr., “Serum Psa Ad- justed for Volume of Transition Zone (Psat) Is More Ac- curate than Psa Adjusted for Total Gland Volume (Psad) in Detecting Adenocarcinoma of the Prostate,” Urology, Vol. 43, No. 5, 1994, pp. 601-606. doi:10.1016/0090-4295(94)90170-8 [9] D. Lin, M. Gold, S. Ransom, W. Ellis and M. Brawer, “Transition Zone Prostate Specific Antigen Density: Lack of Use in Prediction of Prostatic Carcinoma,” The Jour- nal of Urology, Vol. 160, No. 1, 1998, pp. 77-82. doi:10.1016/S0022-5347(01)63036-2 [10] M. Remzi, B. Djavan, R. Wammack, M. Momeni, C. Seitz, B. Erne, M. Dobrovits, S. Alavi and M. Marberger, “Can Total and Transition Zone Volume of the Prostate Determine whether to Perform a Repeat Biopsy?” Urol- ogy, Vol. 61, No. 1, 2003, pp. 161-166. doi:10.1016/S0090-4295(02)02099-X [11] H. Maeda, Y. Arai, S. Ishitoya, K. Okubo, Y. Aoki and T. Okada, “Prostate Specific Antigen Adjusted for the Tran- sition Zone Volume as an Indicator of Prostate Cancer,” The Journal of Urology, Vol. 158, No. 6, 1997, pp. 2193- 2196. doi:10.1016/S0022-5347(01)68193-X [12] M. Nathan, K. Seenivasagam, Q. Mei, J. Wickham and R. Miller, “Transrectal Ultrasonography: Why Are Esti- mates of Prostate Volume and Dimension So Inaccurate,” British Journal of Urology, Vol. 77, No. 3, 1996, pp. 401- 407. [13] M. Terris and T. Stamey, “Determination of Prostate Volume by Transrectal Ultrasound,” The Journal of urology, Vol. 145, No. 5, 1991, p. 984. [14] A. Graser, A. Heuck, B. Sommer, J. Massmann, M. Reis- er and U. Mueller-Lisse, “Mri-Based Psa Density and Psa Density of the Transitional Zone Compared with Psa Alone: Correlation with Prostate Cancer Gleason Score,” Journal of Computer Assisted Tomography, Vol. 30, No. 6, 2006, pp. 891-895. doi:10.1097/01.rct.0000221947.68016.d1 [15] T. Hoshii, T. Nishiyama, S. Toyabe, K. Akazawa, S. Komatsu, M. Kaneko, N. Hara and K. Takahashi, “Eval- uation of Magnetic Resonance Imaging-Based Pros- tate-Specific Antigen Density of the Prostate in the Di- agnosis of Prostate Cancer,” International Journal of Urology, Vol. 14, No. 4, 2007, pp. 305-310. doi:10.1111/j.1442-2042.2007.01686.x [16] Y. Kubota, S. Kamei, M. Nakano, H. Ehara, T. Deguchi and O. Tanaka, “The Potential Role of Prebiopsy Mag- netic Resonance Imaging Combined with Prostate-Spe- cific Antigen Density in the Detection of Prostate Can- cer,” International Journal of Urology, Vol. 15, No. 4, 2008, pp. 322-326. doi:10.1111/j.1442-2042.2008.01991.x [17] U. Mueller-Lisse, U. Mueller-Lisse, S. Haller, P. Schn- eede, J. Scheidler, N. Schmeller, A. Hofstetter and M. Reiser, “Likelihood of Prostate Cancer Based on Pros- tate-Specific Antigen Density by Mri: Retrospective Analysis,” Journal of Computer Assisted Tomography, Vol. 26, No. 3, 2002, pp. 432-437. doi:10.1097/00004728-200205000-00020 [18] E. DeLong, D. DeLong and D. Clarke-Pearson, “Com- paring the Areas under Two or More Correlated Receiver Operating Characteristic Curves: A Nonparametric Ap- proach,” Biometrics, Vol. 44, No. 3, 1988, pp. 837-845. doi:10.2307/2531595 [19] I. Thompson, D. Pauler, P. Goodman, C. Tangen, M. Copyright © 2011 SciRes. OJU  R. L. HARDMAN ET AL. Copyright © 2011 SciRes. OJU 36 Lucia, H. Parnes, L. Minasian, L. Ford, S. Lippman and E. Crawford, “Prevalence of Prostate Cancer among Men with a Prostate-Specific Antigen Level <= 4.0 ng per Milliliter,” New England Journal of Medicine, Vol. 350, No. 22, 2004, pp. 2239-2321. doi:10.1056/NEJMoa031918 [20] G. Andriole, E. Crawford, R. Grubb III, S. Buys, D. Chia, T. Church, M. Fouad, E. Gelmann, P. Kvale and D. Red- ing, “Mortality Results from a Randomized Prostate-Can- cer Screening Trial,” The New England Journal of Medi- cine, Vol. 360, No. 13, 2009, pp. 1310-1319. doi:10.1056/NEJMoa0810696 [21] F. Schroder, J. Hugosson, M. Roobol, T. Tammela, S. Ciatto, V. Nelen, M. Kwiatkowski, M. Lujan, H. Lilja and M. Zappa, “Screening and Prostate-Cancer Mortality in a Randomized European Study,” New England Journal of Medicine, Vol. 360, No. 13, 2009, pp. 1320-1328. doi:10.1056/NEJMoa0810084 [22] W. Catalona, J. Richie, F. Ahmann, M. Hudson, P. Scar- dino, R. Flanigan, J. DeKernion, T. Ratliff, L. Kavoussi and B. Dalkin, “Comparison of Digital Rectal Examina- tion and Serum Prostate Specific Antigen in the Early Detection of Prostate Cancer: Results of a Multicenter Clinical Trial of 6,630 Men,” The Journal of Urology, Vol. 151, No. 5, 1994, pp. 1283-1290.
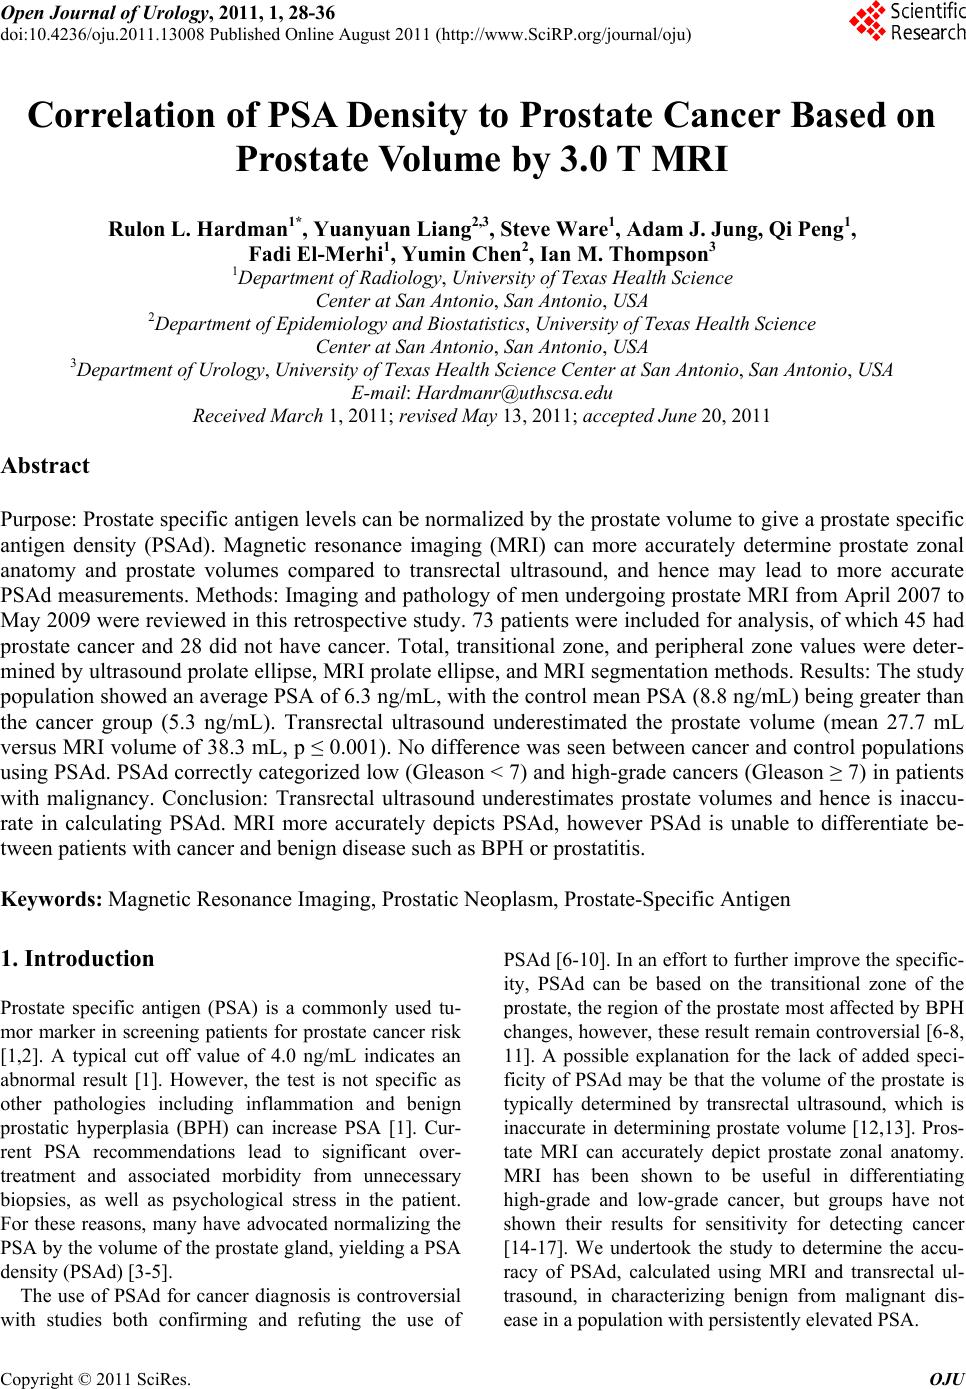
|