Journal of Materials Science and Chemical Engineering
Vol.04 No.06(2016), Article ID:66684,9 pages
10.4236/msce.2016.46003
Detection of Three Common Organic Explosives Using Capillary Electrophoresis
Hong Zhou1,2,3, Zhanfang Liu3, Yuyou Sun3, Ling Zeng1,2, Hongcheng Mei3,4, Jianzhong Xu3, Baoyuan Guo4, Hongxia Hao1,2*
1Collaborative Innovation Center of Judicial Civilization, Beijing, China
2Key Laboratory of Evidence Science, China University of Political Science and Law, Ministry of Education, Beijing, China
3Institute of Forensic Science, Ministry of Public Security, Beijing, China
4Research Center for Eco-Environmental Sciences, Chinese Academy of Sciences, Beijing, China


Received 18 April 2016; accepted 20 May 2016; published 24 May 2016
ABSTRACT
In this article, a detection method for organic explosives by capillary electrophoresis (CE) is developed based on previous detection techniques. Firstly, a buffer solution consisting of 50 mmol・L−1 sodium dodecyl sulfate (SDS), 20 mmol・L−1 sodium tetraborate and 5% methanol was prepared and the UV detection in this buffer solution was conducted for three common organic explosives, including TNT, DNT and PETN. Then, the capillary UV detection method was investigated in terms of the transition time repeatability, the linear relationship between mass concentration and peak area and the limit of detection. The results revealed good reliability and stability of this method. In addition, these samples were characterized by photodiode array detector (PDA) to verify the qualitative results of UV detection.
Keywords:
Organic Explosives, Capillary Electrophoresis (CE), UV Detection

1. Introduction
The TNT and DTN (homologues, both are nitro explosives) and PETN (nitrate explosive) are the most widely used violent explosives in virtue of their availability, facile preparation, good portability and user-friendly implementation. Unfortunately, these explosives have been employed in terrorist attacks, leading to a huge risk for the national security. Therefore, a rapid and precise detection of the explosives in terms of their compositions and sources is in urgent need. In order to realize that, studies of commonly used explosives are required.
Nowadays, a variety of detection methods for these explosives have been developed, including gas chromatography (GC) [1]-[5], liquid chromatography (LC) [6]-[13], ion chromatography (IC) [14]-[16], spectrum analysis and thermo analysis [17]. However, these methods showed poor repeatability, bad universality and column contamination. In spite of its late start, the capillary electrophoresis (CE) has shown great potential in the separation and analysis of explosives. In this article, CE is applied for the analysis of three widely used organic explosives (TNT, DNT and PETN) in terms of the transition time, peak height, peak area and 3D spectrum to facilitate the development of a facile, rapid and cost-effective detection method for organic explosives.
Capillary electrophoresis (CE) is a liquid-phase separation technique based on the differences in the mobility and distribution of different components under high-voltage electric fields. With the capillary and cells filled with the same background electrolyte solution, injection of the sample solution into the capillary, on which voltage is applied, leads to movement of the charged solutes in different directions based on the charge polarity. Due to the difference in their mobilities, different components present varied migration speeds, resulting in a time sequence for the durations taken to reach the detector. As organic compounds, organic explosives present relatively strong ultraviolet absorptions. As a result, electrophorograms of these samples can be obtained by the UV detector, qualitative analysis of these samples can be achieved based on the migration time of peaks, and quantitative analysis of these samples can be achieved based on the peak heights or peak areas. The photodiode array detector (PDA), a novel detector based on photodiode array techniques, was used for characterization of organic explosives to obtain their 3D spectra, thus verifying the results obtained by UV detectors.
2. Experimental
2.1. Instruments
The capillary electrophoresis apparatus BECKMAN2COULTER P/ACEtmMDQ (purchased from USA), negative power source with tunable voltage of 20 - 30 kV, the molten quartz capillary (produced by Hebei Yongnian optical fiber factory) with a capillary length of 61 cm (effective length of 53 cm), a pressure of 0.5 psi, a injection time of 5 s, a UV detection wave length of 214 nm for direct detection with 32 k software operating system. Milli2QÒ ultra-pure water purifier by USA Millipore Company, METTLERAE240 electronic balance, 10 - 1000 μl automatic pipetting gun, disposable pipettes, measuring cylinders and beakers were used.
2.2. Reactants
Provided by the Explosive Metering Station of Technologies for National Defense, TNT, DNT and PETN of 99.9% purity were used. The SDS, sodium tetraborate and ammonium acetate used were of analytical grade, while the methanol used was of chromatographic grade.
2.3. Sample Preparation
TNT, DNT and PETN (0.10 g each) were weighted dissolved in methanol separately. The solutions were then added to 1000 ml volumetric flasks to obtain 100 μg∙mL−1 organic explosive solutions, which were then kept at 4˚C. Before detections, these solutions were diluted with the buffer solution prepared.
2.4. Methods
Both the buffer solutions and sample solutions were sonicated for 10 min for the purpose of degassing. The capillaries were rinsed with 0.5 mol∙L−1 NaOH solution and deionized water for 5 min each, followed by rinsing with buffer for 10 min. The pressure sampling method was applied with injection time of 5 s, pressure of 0.5 psi and cooling temperature of 25˚C. The whole CE process was automatic.
3. Optimization of CE Conditions
In this experiment, a mixed solution of ammonium acetate and sodium tetraborate was used as the buffer. Detection of TNT samples was conducted as an example. In this process, the current was varying fiercely (sharp decrease to zero was observed), the peaks were indistinguishable and the repeatability of transition time was poor. As a result, optimization of buffer solutions is required.
The Buffer Solutions
In this section, the composition of separating medium in buffer solution was verified and the effect of concentrations of SDS and sodium tetraborate on the detection was investigated. Based on the results obtained, a solution consisting of 50 mmo∙L−1 SDS, 20 mmo∙L−1 sodium tetraborate and 5% methanol was confirmed as the buffer solution. With this buffer solution, the baselines of all the samples were stable, while the transition time of TNT, DNT and PETN was 7.954, 8.764 and 8.492min, respectively. The peaks of these samples are shown in Figures 1-3, respectively.
4. The Validation of Method
4.1. The Repeatability of Transition Time
The 100 μg・mL−1 TNT, DNT and PETN in buffer system II were measured. The transition times and relative standard deviations (RSD) of transition times are listed in Table 1.
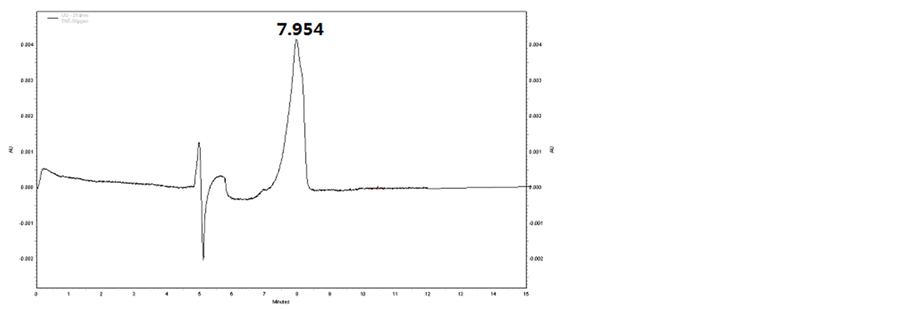
Figure 1. CE spectrum of TNT.
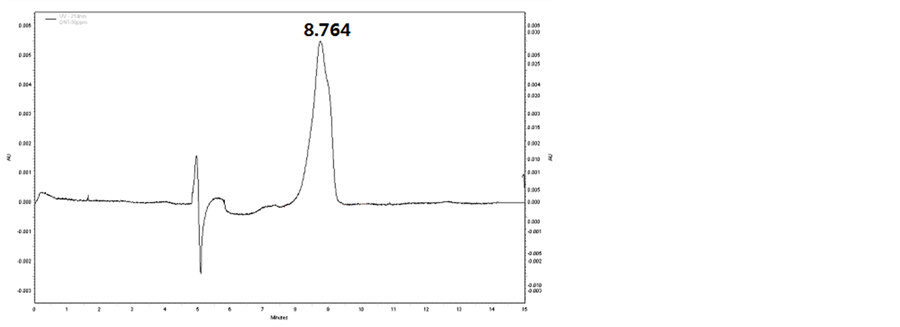
Figure 2. CE spectrum of DTN.
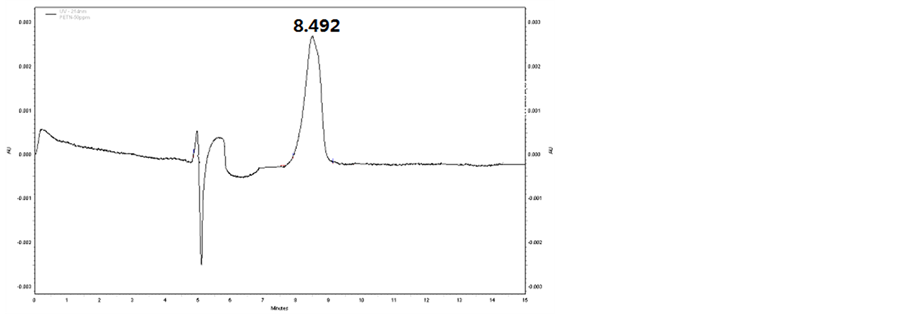
Figure 3. CE spectrum of PETN.

Table 1. Repeatability of transition times of three explosives in buffer system II.
As is shown, the RSD of transition times of TNT, DNT and PETN in this buffer system was 0.182%, 0.130% and 0.180%, respectively. The relative standard deviations of transition times were lower than 0.2%, indicating great repeatability.
Besides the instrument, a combination of several other factors resulted in the systematic errors of the results obtained. Firstly, the repeated flowing of buffer between two ends of capillary during the measurement led to the variation in conductivities of the buffer at two ends, thus altering the transition time. Moreover, the ionization of water in the CE process had an effect on the pH of buffer, resulting in the height difference of the buffer at two ends of the capillary. In addition, the inevitable difference of the buffer in different batches and the evaporation effect may also have an effect on the transition times.
4.2. Linear Relationship between Mass Concentration and Peak Area
The 100.0 μg∙mL−1 organic explosive solution was diluted with corresponding buffer to 5.0 μg∙mL−1, 10.0 μg∙mL−1, 15.0 μg∙mL−1, 20.0 μg∙mL−1, 25.0 μg∙mL−1, 30.0 μg∙mL−1 and 50.0 μg∙mL−1, respectively. The measurements were performed in buffer. Figures 4-6 show the linear relationship between mass concentrations of different explosive samples and their average peak areas.
1) TNT
5.0 μg∙mL−1, 10.0 μg∙mL−1, 15.0 μg∙mL−1, 20.0 μg∙mL−1, 25.0 μg∙mL−1, 30.0 μg∙mL−1, and 50.0 μg∙mL−1 TNT solutions were measured in buffering system II and the peak areas for different concentrations are shown in Table 2. A standard curve is plotted by peak area (Y) with mass concentration (X, μg∙mL−1). The result showed a solid linear relationship between mass concentration (from 5.0 to 50.0 μg∙mL−1) and peak area, with linear formula to be Y = 4229.29X − 3195.88 and relating coefficient (R) to be 0.9990, as shown in Figure 4.
2) DNT
5.0 μg∙mL−1, 10.0 μg∙mL−1, 15.0 μg∙mL−1, 20.0 μg∙mL−1, 25.0 μg∙mL−1, 30.0 μg∙mL−1, and 50.0 μg∙mL−1 DNT solutions were measured in buffering system II, and the peak areas for different concentrations are shown in Table 3. The standard curve was plotted by peak area (Y) with mass concentration (X, μg∙mL−1). The result showed a solid linear relationship between mass concentration (from 5.0 to 50.0 μg∙mL−1) and peak area, with linear formula to be Y = 4293.49X − 3195.89 and relating coefficient (R) to be 0.9989, as shown in Figure 5.
3) PETN
5.0 μg∙mL−1, 10.0 μg∙mL−1, 15.0 μg・mL−1, 20.0 μg∙mL−1, 25.0 μg∙mL−1, 30.0 μg∙mL−1, and 50.0 μg∙mL−1 PETN solutions were measured in buffering system II, and the peak areas for different concentrations are shown in Table 4. The standard curve was plotted by peak area (Y) with mass concentration (X, μg∙mL−1). The result revealed a solid linear relationship between mass concentration (from 5.0 to 50.0 μg∙mL−1) and peak area, with linear formula to be Y = 1988.08X − 46.04 and relating coefficient (R) to be 0.9990, as shown in Figure 6.
4.3. Limit of Detection
The limit of detection refers to the minimum content or concentration of samples that can be qualitatively detected by the specific assay. The ratio between the signal intensity and noise level of the sample is defined as the signal-to-noise ratio (SNR). In most cases, the signal intensity measured in blank experiments is regarded as the noise level, the SNR is not lower than 3, the lowest concentration whose SNR is not lower than 3 is considered as the limit of detection of the sample by this assay. The limit of detections of TNT, DNT and PETN samples are listed in Table 5.
Table 2. Peak areas of TNT in different concentrations.

Figure 4. Linear relation curve of TNT by CE.
Table 3. Peak areas of DNT in different concentrations.
Table 4. Peak areas of PETN in different concentrations.

Figure 5. Linear relation curve of DNT by CE.

Figure 6. Linear relation curve of PETN by CE.
Table 5. The limit of detection (LOD) of three organic explosives.
5. Characterization by PDA
The 50.0 μg∙mL−1 standard solutions of different organic explosives were characterized by PDA and the spectra are illustrated in Figures 7-9.
In UV detections, the transition time is the only criterion for qualitative analysis. Fortunately, the PDA spectra can also be applied in the qualitative analysis. In addition, rapid scanning of samples and automatic collection of their peak spectra during the chromatographic fractionation can be realized by PDA. Hence, the spectra presented in this article can be used as database for detection and compositional analysis of explosives.
6. Conclusions
This article presented a systematic investigation of three commonly used organic explosives by capillary electrophoresis (CE). Based on the characteristics of different samples and the capillary electrophoresis, optimization of separation methods for these explosives was discussed. Primarily, this study serves as a pioneer work in the detection of organic explosives by CE in China. Moreover, improvements in the applications of thin-film chromatography, gas chromatography, and gas-mass spectroscopy in the detections of organic explosives have been achieved by this study. For instance, the sensitivities for explosives are significantly enhanced.
(1) The essay presented the detection of three organic explosives (TNT, DNT, and PETN) in two buffer solutions consisting of 50 mmol∙L−1 SDS, 20 mmol∙L−1 sodium tetraborate and 5% methanol. The results revealed
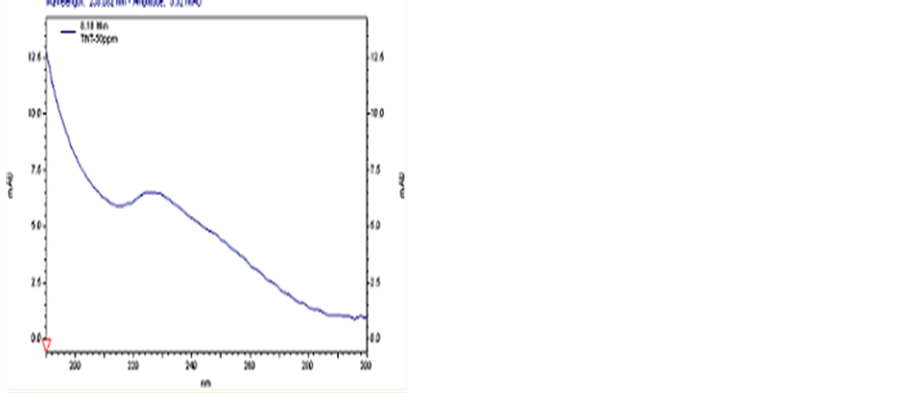
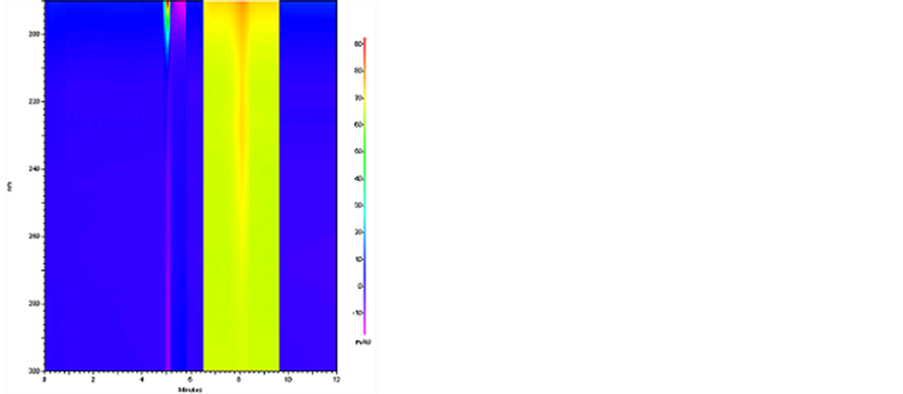
Figure 7. The PDA spectrum of TNT.
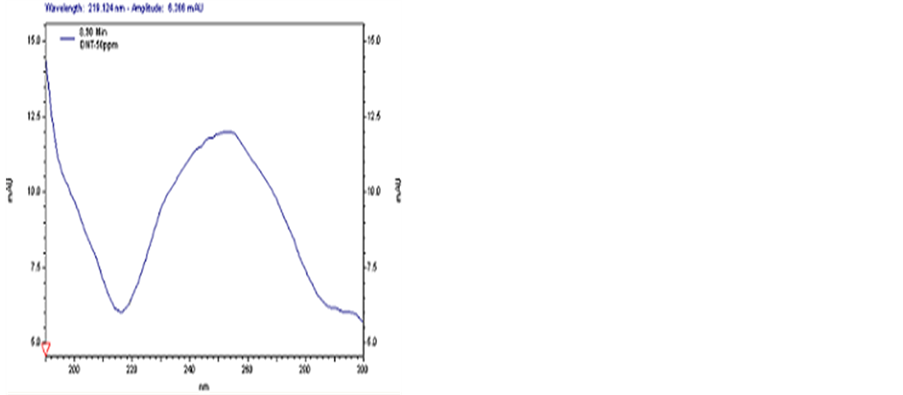
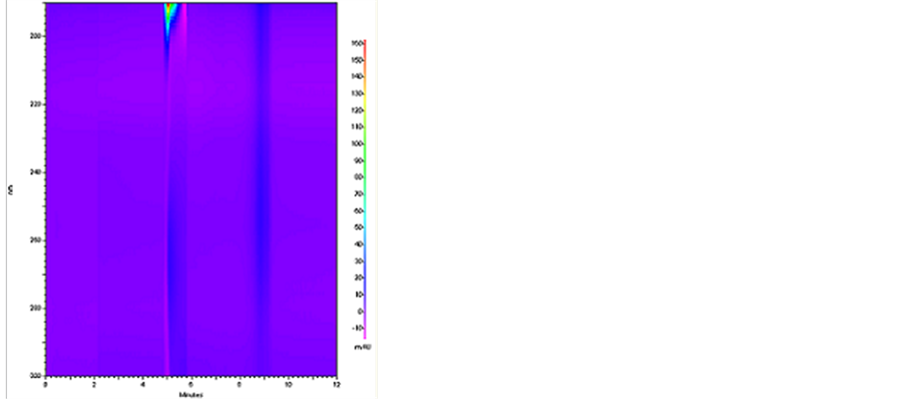
Figure 8. The PDA spectrum of DNT.
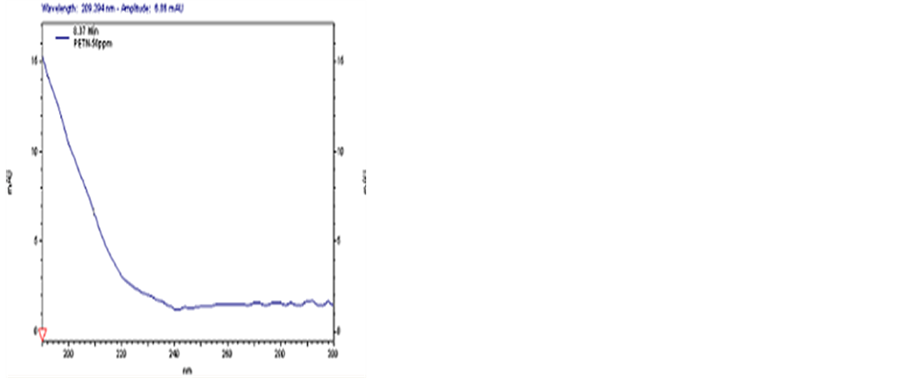
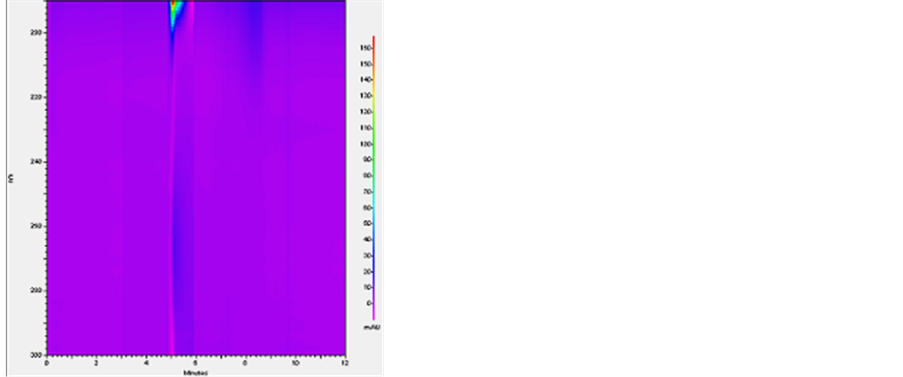
Figure 9. The PDA spectrum of PETN.
that all of the three samples in the prepared buffer can be precisely detected, with transition time to be 7.954 min, 8.764 min and 8.492 min for TNT, DNT and PETN, respectively.
(2) The repeatability of transition time, the correlation between mass concentration and peak area and limit of detection of the explosive samples were investigated. The results revealed that the standard deviations of repeated transition times of all the samples were within 0.2%, the linear coefficients of mass concentration and peak area of all the samples were within 0.9960 - 0.999 and the limit of detection of TNT, DNT, and PETN were 0.5 μg∙mL−1, 0.25 μg∙mL−1 and 1.0 μg∙mL−1, respectively.
(3) The characterization of the organic explosives by PDA led to spectra that can be used for the verification of the qualitative results from UV detections.
Acknowledgements
We are grateful to the Opening Project of Key Laboratory of Evidence Science(China University of Political Science and Law, Ministry of Education (2012KFKT07) and also Academician Foundation of the Ministry of Public Security of the People’s Republic of China (2011-23214203, 2011-23215243), Beijing Municipal Education Commission University Science and Technology Park Construction Project and Program for Young Innovative Research Team in China University of Political Science and Law (1000-10814344,16CXTD05) for their financial supports.
Cite this paper
Hong Zhou,Zhanfang Liu,Yuyou Sun,Ling Zeng,Hongcheng Mei,Jianzhong Xu,Baoyuan Guo,Hongxia Hao, (2016) Detection of Three Common Organic Explosives Using Capillary Electrophoresis. Journal of Materials Science and Chemical Engineering,04,17-25. doi: 10.4236/msce.2016.46003
References
- 1. Zhang, C. and Xia, P. (2009) Analysis of Organic Explosives by Triple Quadrupole GC/MS. Chinese Journal of Fo-rensic Sciences, No. 1, 22-25.
- 2. Calderara, D., Gardebas, B.K. and Martinez, K. (2004) Organic Explosives Analysis Using on Column-Ion Trap EI/NICI GC-MS with an External Source. Journal of Forensic Sciences, 49, 1005-1008. http://dx.doi.org/10.1520/jfs2003097
- 3. Hodyss, R. and Beauchamp, J.L. (2005) Multidimensional Detection of Ni-troorganic Explosives by Gas Chromatography-Pyrolysis-Ultraviolet Detection. Analytical Chemistry, 77, 3607-3610. http://dx.doi.org/10.1021/ac050308e
- 4. Waddell, R., Dale, D.E., Monagle, M. and Smith, S.A. (2005) Determination of Nitroaromatic and Nitramine Explosives from a PTFE Wipe Using Thermal Desorption-Gas Chromatography with Electron-Capture Detection. Journal of Chromatography A, 1062, 125-131. http://dx.doi.org/10.1016/j.chroma.2004.11.028
- 5. Collin, O.L., Niegel, C., DeRhodes, K.E., McCord, B.R. and Jackson, G.P. (2006) Fast Gas Chromatography of Explosive Compounds Using a Pulsed-Discharge Electroncapture Detector. Journal of Forensic Sciences, 51, 815-818. http://dx.doi.org/10.1111/j.1556-4029.2006.00171.x
- 6. Yang, R. (2008) Applications of LC-MS in Detections of Explosives. Journal of Chinese People’s Republic Security University (Science and Technology), No. 3, 19.
- 7. Zhang, M. (2008) Analysis of the Mixture of RDX and HMX by the HPLC-ESI-MS. Chinese Journal of Explosives and Propellants, 29, 77-80.
- 8. Zhang, M., Qi, Y. and Gao, Y. (2008) Determination of Tetranitro-Pentaerythritol by HPLC-ESI MS Method. Journal of Instrumental Analysis, 27, 258-360.
- 9. Paull, B., Roux, C., Michael, D., et al. (2004) Rapid Screening of Selected Organic Explosives by High Performance Liquid Chromatography Using Reversed-Phase Monolithic Columns. Journal of Forensic Sciences, 49, 1181-1186. http://dx.doi.org/10.1520/JFS2004072
- 10. Mathis, J.A. and Mccord, B.R. (2005) The Analysis of High Explosives by Liquid Chromatography/Electrospray Ionization Mass Spectrometry: Multiplexed Detection of Negative Ion Adducts. Rapid Communications in Mass Spectrometry, 19, 99-104. http://dx.doi.org/10.1002/rcm.1752
- 11. Tachon, R., Pichon, V., Barbe, M., Borgne, L., et al. (2007) Use of Porous Graphitic Carbon for the Analysis of Nitrate Ester, Nitramine and Nitroaromatic Explosives and By-Products by Liquid Chromatography-Atmospheric Pressure Chemical Ionisation-Mass Spectrometry. Journal of Forensic Sciences, 1154, 174-181.
- 12. Holmgren, E., Carisson, H., Goede, P., et al. (2005) Determination and Characterization of Organic Explosives Using Porous Graphitic Carbon and Liquid Chromatography-Atmospheric Pressure Chemical Ionization Mass Spectrometry. Journal of Chromatography A, 1099, 127-135. http://dx.doi.org/10.1016/j.chroma.2005.08.088
- 13. Thompson, R.Q. (1999) Aqueous Recovery from Cotton Swabs of Organic Explosives Residue Followed by Solid Phase Extraction. Forensic Science, 44, 795-804.
- 14. Zhang, J., Li, G. and Li, H. (1999) Detection of Cations in Ammonium Nitrate Explosive Dust Using Ionchromatography. Journal of Liaoning Police Academy, No. 2, 19-21.
- 15. Xie, Y., Zhong, Z., Liu, X., et al. Detection of Explosion Products Using Ionchromatography/Thermal Desorption, Gas Chromatograph and Mass Spectrometry. Physical Testing and Chemical Analysis (Part B: Chemical Analysis).
- 16. Yang, K. (2012) Determination of Chlorate and Perchlorate in Explosive Residues of Chlorate Explosive by Ionchromatography. Journal of Wuhan Institute of Technology, No. 32, 46-48.
- 17. Gomez, L.M., Osorio, C., Amman, E., et al. (2006) The Spectroscopic Fingerprint of TNT between 395 and 495 nm Determined from Transmission near Field Optical Microscopy Measurements. Chemical Physics Letters, 422, 313-316. http://dx.doi.org/10.1016/j.cplett.2006.02.091
NOTES

*Corresponding author.