 Vol.1, No.2, 24-34 (2011) http://dx.doi.org/10.4236/oje.2011.12003 Open Journal of Ecology Copyright © 2011 SciRes. OPEN A CCESS Influence of early dry season fires on primary production in western Serengeti grasslands, Tanzania Shombe Ntaraluka Hassan Department of Wildlife Management, Sokoine University of Agriculture, Morogoro, Tanzania; Corresponding Author: hassanshombe@yahoo.co.uk Received 25 May 2011; revised 24 June 2011; accepted 2 July 2011. ABSTRACT Short-term, i.e. 4-9 weeks aboveground net primary production (ANPP) temporal patterns during the first post-fire year in western Seren- geti National Park, and potential differences in the factors limiting ANPP between burnt and non burnt grasslands were examined and es- tablished. Fire stimulated growth at early post- fire stages, even during the dry season, July- October and led to larger increments in green phytomass compared to the non burnt grass- land at the onset of short rains, October-De- cember. Further, ANPP in burnt plots correlated well with the ratio leaf/total standing phytomass suggesting that the accumulation of standing dead material can be a limiting factor to ANPP in burnt grass-lands. However, ANPP in burnt plot- s was unrelated to rainfall contrary to earlier arguments, but reached peak earlier and de- clined early in the rain season, perhaps due to the interactive effects of fire and grazing in the area. In non burnt plots, the temporal change in ANPP w as more related to rainfall availability, at least until mid-growing season. Also, the phy- tomass structure differed between burnt and non burnt grasslands, and together with litter did not recover to non burnt levels within the first post-fire year. The study has demonstrated that the desire of the fire management program in Serengeti National Park, which is to supply green forage to both migratory and resident populations during dry season is being fulfilled. Keywords: Aboveground Net Primary Production; Energy Limitation; Fire-Grazing Interaction; Savanna; Western Serengeti 1. INTRODUCTION Fire can alter fundamental biogeochemical processes and functions in ecosystems, affecting nutrient and carbon budgets and fluxes [1-4]. The effect on primary production is crucial since biomass and net primary production are essential to ecosystem performance and function [5], and primary production determines the energy available for other trophic levels [6,7]. Frequent fires are inherent in some ecosystems such as tropical savannas [8]. Thus, in such systems the understanding of its effects, in interaction with other ecological de- terminants on primary production is critical to guiding management practices that can maintain ecosystem’s sustainability [9]. There is evidence that fire affects primary productiv- ity, but with apparently contradictory results. The vari- ety in responses appears to depend on the biomes in question, the characteristics of the fire regime [10] and the spatial scales and temporal scopes at which the studies have been conducted [3,11,12]. Important to these differences are the factors that limit primary pro- duction in each case and the time lags in the responses to the controlling biophysical processes [1]. Nitrogen and soil water availability are important determinants of grass growth in East African savannas [13] and fire can change the amounts of these resources available for the vegetation [4]. Through the effect on soil mineralization rates and the volatilization of N from combusted plant material, fire can reduce the av- ailability of N in frequently burnt grasslands compared to long-term non burnt grasslands [11,14,15]. However, despite the observed reduced N availability, frequently burnt grasslands, can sustain significantly higher pro- ductivity than non burnt grasslands [11,15] likely, as a consequence of fire releasing energy limitations to pho- tosynthesis and soil temperature through the removal of phytomass [11,15]. Fire affects the structure of the sward [16] by removing old leaves, dead material and litter [17] and through post-fire re-growth [18,19]. Further, although the mechanisms are poorly under- stood, the removal of dead matter by fire appears to stimulate re-growth in savanna [20], particularly in  S. N. Hassan / Open Journal of Ecology 1 (2011) 24-34 25 grassland patches [21]. Contrarily, fires can reduce above-ground net primary production (ANPP) by con- trolling the amount of total biomass and photosynthetic area, which are typically low immediately after the fire [22]. During this phase, primary production can in- crease steadily before levelling off at a full-developed sward [23]. Rainfall is a critical factor controlling biomass and primary production in savannas [5,7,24,25,26]. Above- ground net primary production is strongly correlated with mean annual precipitation in Serengeti grasslands [27] and in other African grasslands, and phytomass production follows within-year (monthly) variation in rainfall [28]. Further, the rate of post-fire recovery of the vegetation has been observed to correlate with the rainfall [4,29]. However, fire through its effect on the vegetation and litter cover [17a], can reduce the amount of water availability in the soil by increasing runoff and reducing infiltration [30] which can lead to compara- tively lower net primary production in burnt grasslands [15,17]. Despite a relatively large number of studies about the effects of fire on semi-arid grasslands and savannas, the current understanding of the processes determining fire-mediated ANPP is insufficient to establish the key controlling factors in each case. Most evidence includ- ing [10] and [20] refer to long term differences among fire regimes in terms of frequency of burning. Fewer studies such as [4] and [22] have focused on the de- velopment during early (first year) stages of the sward recovery, when important differences in the amount of green biomass and in the degree of sward shading are expected to be determinants of production. This knowl- edge is critical to understanding the factors that limit carbon fixation in frequently burnt systems. Although Serengeti National Park has a long history of more quantitative ecological research in Africa, comparatively little work has been directed to under- standing the effects of fire in this system. So far, burn- ing practices in the area are conducted without proper understanding about the influence of early dry season burns on ANPP in grasslands. Equally, the relationship between the post-fire sward development and ANPP is unknown. The combined effects of fire, other distur- bances such as grazing and rainfall on grassland ANPP are also largely unknown for the Serengeti and for other semi-arid systems with large wild herbivore populations. In this study, the influence of early dry-season burn- ing on grassland productivity in western Serengeti Na- tional Park was assessed by establishing short-term (4 - 9 weeks) temporal patterns of ANPP during the first post-fire year. The aim was to test hypotheses about water availability and photosynthetic limitations on ANPP between burnt and non burnt grasslands, and to establish whether there is a correspondence between ANPP and rainfall, and between ANPP and sward structure attributes i.e. quantity and proportions of live leaf, flowers/fruits and standing dead material in the two strata It was hypothesised that: 1) The small amount of photosynthetic biomass is a constraint to ANPP during the early stages of post-fire sward recov- ery. 2) ANPP would increase in burnt grasslands along with sward development and would reach levels higher than in non burnt grasslands. 3) Also, in the burnt grassland ANPP would increase with rainfall whereas shading would set a limit for productivity in the non burnt grassland. 4) Amount of phytomass and litter in burnt grasslands will not reach steady-state levels within one year of post-fire sward recovery. 2. METHODS 2.1. Study Site The study was conducted in the Western Corridor of Serengeti National Park (SNP). Serengeti is situated between 1˚ and 3˚30' S, and 34˚ and 36˚ E [31]. The SNP (14763 km2) is the main part of the 25000 km2 large Serengeti ecosystem which extends to the Masaai Mara in Kenya [32], and is characterised by annual move- ments of migratory wildebeests (Connochaetes taurinus Thomas), zebras (Equus burche lli Matschie), Thomson’s gazelles (Gazella thomsoni Günther) and elands (Tauro- tragus oryx Lydekker) [7,31]. Generally, the migrants spend the wet season, December-May in the South East Plains and the dry season, August-October in northern Serengeti and Masaai Mara area in southern Kenya. The Western Corridor is primarily used by migrating herds while moving between dry and wet season grazing grounds. Wildebeest, Burchell’s zebra, Thomson’s ga- zelle, African buffalo (Syncerus caffer Sparrman) and topi (Damaliscus korrigum Matschie) are the key graz- ing species [27]. Annual rainfall ranges between ca 600 mm in the Southeast Plains and ca 1100 mm in the north [33], and averages 700 mm. The rainfall distribution is bimodal, with a period of short rains from November to December and the main rain season from March to May [25]. 2.2. Sampling Procedure Phytomass dynamics and ANPP were assessed in the period from 5th July 2003 to 21st July 2004 by repeated harvesting of samples taken at intervals of 2 to 9 weeks (Tab le 1). Study sites (n = 6) were in the main area of the wildebeest migratory route. Each site consisted of Copyright © 2011 SciRes. OPEN A CCESS  S. N. Hassan / Open Journal of Ecology 1 (2011) 24-34 26 Ta b l e 1 . periods for phytomass change assessments from July 2003 to July 2004, with shortenings and mean time interval in days between consecutive samplings on burnt and non burnt plots in six sites in the Western Corridor, Serengeti National Park. Average rainfall for whole months in the sampling period calculated on monthly records at the stations Nyaruswiga, Mareo and Musabi in Serengeti National Park. Burnt Non burnt Rainfall Period Shortenings of sampling periods days mm/month Jul-Sep T1-TO 45 54 35 Sep-Oct T2-T1 33 33 48 Oct-Dec T3-T2 66 67 58 Dec-Feb T4-T3 37 37 100 Feb-Mar T5-T4 32 31 98 Mar-May T6-T5 61 61 81 May-Jun T7-T6 37 38 51 Jun-Jul T8-T7 19 11 21 one burnt and one non burnt grassland patch, with each grassland patch measuring at least 10 ha in size. The grassland patches were either contiguous or opposite each other to ensure that they were similar in the general aspect of the landscape. One plot (50 m × 50 m) was established in each burnt and non burnt grassland patch at each of the 6 sites, making twelve main plots in total. Therefore, the plots were in medium-high Themeda grasslands with Themeda triandra, Pennisetum mezianu- m and Digitaria macroblephara [34] as dominant grass species. The distance between the study sites ranged between 1 and 40 km, and the distance between the plots and the closest road ranged between 0.45 and 0.75 km. The burnt patches were burnt during the annual early dry-season burning operations in May-July 2003 per- formed by the Serengeti Ecological Monitoring Program (SEMP) unit. Movable cages were used to temporarily exclude large herbivores from the quadrats between samplings occa- sions. The cages were conical in shape with 1 m2 (1 m × 1 m) base on the ground and 2 m tall. On the first sam- pling time (T0), in each of the twelve plots, phytomass and litter samples were collected in 6 randomly distrib- uted quadrats of 0.625 m2 each [35] in total 72 samples (6 samples × 12 plots). Phytomass were hand-clipped to ground level. At the same time six cages were erected over other randomly selected quadrats. From each of the twelve plots, at each sampling time from T1 onwards (time T1 - T8), six “fenced” and six “open” phytomass samples, in total 12 samples were collected (in total 144 samples). After clipping the cages were moved to new randomly selected quadrats. Phytomass samples were hand-sorted into five com- partments: live leaf, live stem (referring to grass repro- ductive culms without the leaves), flower/fruit, standing dead (dead material attached to living plants and dead material that remained attached to the ground) and litter. Sorted materials were air-dried for two weeks in paper bags and later oven-dried at 70˚C [36] for 48 hrs and then weighed using a digital scale (Soehnle ultra, [Leif- heit AG. D-56377 Nassau, Germany] with maximum 200 g, d = 0.1 g precision). A total of 1152 samples were collected. Seventy-two samples were lost due to two wildfires which burnt four plots, the first one in May and the second one in June. Monthly rainfall data from the stations Nyaruswiga, Mareo and Musabi with the Ser- engeti National Park Ecological Monitoring Department (Table 1) were averaged for the months on which ANPP was calculated (Table 5). Each station consists of one rain gauge and the distance between the sites and the rain gauge varied between 0.5 - 1.2 km. 2.3. Data Analyses Differences in phytomass between open (Ti) and fenced (Ti+1) samples were tested with univariate ANOVAs independently for each phytomass component and sampling occasion, T (T = 0 to 8). Since the length of the interval between two consecutive samplings var- ied among samplings, ‘Sampling interval’, in days was included in the model as a covariate (Table 1). The model included burnt and non burnt as main treatments plots (Fire), ‘Phytomass change’ (fenced, Ti+1 vs. open, Ti), ‘plot’, the interaction term ‘Phytomass change *Fire’ and ‘Sampling interval’. ‘Fire’ and ‘Phytomass change’ were fixed factors, and ‘plot’ random. The analyses were conducted using the General Linear Model-Univariate ANOVA routine in SPSS v. 15 for windows [37]. Sig- nificant positive differences in total above-ground phy- tomass (including litter) between fenced samples, Ti+1 and open samples, Ti indicated phytomass gain (produc- tion). A significant interaction effect of ‘Phytomass change*Fire’ indicated differences in production be- tween burnt and non burnt plots. Daily ANPP in each fire treatment was calculated as the phytomass increment, i.e. the positive difference in total phytomass (live, standing dead and litter) between consecutive samplings divided by the number of days between samplings. Phytomass increments were based on plot averages, i.e. on 6 open and 6 fenced samples respectively. The structural attributes of the sward, i.e. the amount of leaf, stem, flower-fruits, standing dead material and litter, and the ratios of phytomass com- partments were computed for the eight sampling periods (T1 - T8) on the ‘fenced’ samples. Pearson correlations (tow-tailed significance test) were calculated between the daily ANPP and the average sward attributes per treatment using the correlations routine in SPSS v. 15.0. Phytomass ratios were calculated on each sample and arcsine transformed for the ANOVAs and Pearson corre- lations. Data which showed skewed distribution were Copyright © 2011 SciRes. OPEN A CCESS  S. N. Hassan / Open Journal of Ecology 1 (2011) 24-34 Copyright © 2011 SciRes. 27 OPEN ACCESS square-root transformed to improve normality and vari- ance homocedasticity [37]. 3. RESULTS 3.1. Fire, Sward Structure and Phytomass Allocations Total above-ground phytomass (including litter) was at all sampling times higher in the non burnt plots than in the burnt plots with averages of ca 301.5 gm–2 and ca 151.3 gm–2, respectively (Table 2). The differences were significant in six of the eight periods. Total live phy- tomass was also generally larger in non burnt plots, dif- fering significantly at four occasions. Phytomass of leaf, stem and flower/fruit were significantly higher in non burnt plots at 3, 5 and 2 sampling times, respectively. Only in June was the phytomass of flower/fruits higher in the burnt plots (Table 2). Mean total live biomass was 123.2 gm–2 and 87.0 gm–2 for non burnt and burnt plots, respectively. Fire had an effect on the temporal distribution of live phytomass. The peaks for live leaf and total live phy- tomass differed between treatments. It was highest in burnt plots for live leaf during December and for total live phytomass in non burnt plots during February (Ta- ble 2 and Figure 1). Also the first peak in live stem phytomass, related to the reproductive phase in grasses, was earlier in burnt plots, December than in non burnt plots, February (Ta b le 2). In contrast, the phytomass of flowers/fruits followed similar temporal patterns in burnt and non burnt plots with peaks in December, May and July. Fire had also an effect on the amount of plant debris. There was more standing dead phytomass and litter in non burnt plots than in burnt plots at all times (Ta b l e 2 and Figure 1). In both treatments, standing dead phy- tomass increased steadily during the early stages of the growth season with first peak in December (Table 2), and a significant net accumulation in February-March (Figure 1) after the short rain. Non burnt plots had a second peak at the end of the long rain-season, in July. Further, fire changed the relative phytomass composition of the sward (Table 3). Burnt plots had significantly higher ratios of live leaf/total standing phytomass in October, December and February; significantly lower ratios of live stem/total standing phytomass at early post-fire stages (September and October), and higher ratios of total live/total standing phytomass (December and February). Non burnt plots had generally higher standing dead/total above ground phytomass ratios. Fire also changed the relative distribution of live phy- tomass, between vegetative and reproductive structures (Tab le 4). Burnt plots had significantly higher ratios of live leaf/total live phytomass (October and February), and generally lower ratios of live stems plus flower-fruits phytomass/total live phytomass, were significantly lower at five sampling times. There were no differences be- tween treatments in the ratios of flower and fruit phy- tomass/total live phytomass. 3.2. Variation in Productivity Total live phytomass changed significantly between- sampling periods, i.e. at the end of the dry season (Sep tember-October), during the short rains (December- February) and during the long rains, March-June Table 2. Mean values (raw scores-gm–2) of total aboveground mass (including litter), total standing phytomass and phytomass com- partments: live leaf, live stem, flower and fruit, total live, standing dead, and litter in fenced samples in burnt and non burnt plots in Western Corridor grasslands, Serengeti National Park from September 2003 to July 2004. Live phytomass Dead phytomass Sampling time Treatment Total above-ground mass Leaf Stem Flower/ Fruit Total live Standing Litter Sep Burnt 71.7** 32.0**13.8*- 45.8**23.7** 2.2** Non burnt 201.7 38.2 62.9 - 101.1 87.2 13.4 Oct Burnt 73.1** 35.2**4.8**- 40.0**25.4** 7.7** Non burnt 210.1 63.4 39.8 - 103.2 86.1 20.8 Dec Burnt 227.0 115.2 40.2 2.6 158.0 62.0** 7.0** Non burnt 290.7 100.0 46.8 4.7 151.5 115.3 23.9 Feb Burnt 145.0** 74.3*22.0**0.7**97.0**40.2** 7.8** Non burnt 373.6 110.3 64.2 3.9 178.4 163.5 31.7 Mar Burnt 167.5** 55.2 27.4*0.3*82.9*78.1** 6.5** Non burnt 340.9 61.3 53.2 1.3 115.8 200.6 24.5 May Burnt 183.4** 77.9 39.9*5.1 122.9 50.9** 9.6** Non burnt 363.3 89.7 57.7 5.4 152.8 171.8 38.7 Jun Burnt 222.3 73.5 44.0 0.4*117.9 89.4* 15.0** Non burnt 323.9 63.2 65.2 0.0 128.4 168.3 27.2 Jul Burnt 120.2** 10.7 17.8 3.3 31.8 78.2** 10.2* Non burnt 308.0 18.8 30.8 4.6 54.2 219.2 34.6 * Difference between burnt and non burnt plots in plant mass statistically significant at P < 0.05; ** P ≤ 0.001.  S. N. Hassan / Open Journal of Ecology 1 (2011) 24-34 28 Ta ble 3. Mean ratios (raw scores) of phytomass compartments in fenced samples on burnt and non burnt plots in six sites in the Western Corridor, Serengeti National Park, from September 2003 to July 2004. Live leaf, live stem and total live is shown in relation to total standing phytomass (live + attached dead plant material), and standing dead material and litter in relation to total above-ground mass. Sampling time Treatment Live leaf/total stand- ing phytomass Live stem/total stand- ing phytomass Total live/total standing phytomass Standing dead/total above-ground mass Litter/ total above-ground mass Sep Burnt 0.460 0.199* 0.659 0.331 0.031 Non burnt 0.203 0.334 0.537 0.432 0.066 Oct Burnt 0.538* 0.073* 0.612 0.347* 0.105 Non burnt 0.335 0.210 0.545 0.410 0.099 Dec Burnt 0.524* 0.183 0.718* 0.273** 0.031 Non burnt 0.375 0.175 0.568 0.397 0.082 Feb Burnt 0.542** 0.160 0.707* 0.277** 0.054* Non burnt 0.323 0.188 0.522 0.438 0.085 Mar Burnt 0.343 0.170 0.515 0.466** 0.039 Non burnt 0.194 0.168 0.366 0.588 0.072 May Burnt 0.448 0.230 0.707 0.278** 0.052* Non burnt 0.276 0.178 0.471 0.473 0.107 Jun Burnt 0.355 0.212 0.569* 0.402** 0.067* Non burnt 0.213 0.220 0.433 0.520 0.084 Jul Burnt 0.097 0.162 0.289 0.651 0.085 Non burnt 0.069 0.113 0.198 0.712 0.112 * Difference between burnt and non burnt plots in biomass ratio statistically significant at P < 0.05; **P ≤ 0.001. Table 4. Mean ratios (raw scores) of live phytomass compartments in fenced samples on burnt and non burnt plots in six sites in the Western Corridor, Serengeti National Park, from September 2003 to July 2004. Sampling time Treatment Live leaf/ total live phytomass Live stem/ total live phytomass Flower-fruit/total live phytomass Live stem + flower-fruit/total live phytomass Sep Burnt 0.699 0.301** - 0.301* Non burnt 0.378 0.622 - 0.622 Oct Burnt 0.880** 0.120** - 0.120** Non burnt 0.614 0.386 - 0.386 Dec Burnt 0.729 0.254 0.016 0.271* Non burnt 0.660 0.309 0.031 0.340 Feb Burnt 0.766** 0.227* 0.007 0.234* Non burnt 0.618 0.360 0.022 0.382 Mar Burnt 0.666 0.331 0.004 0.334 Non burnt 0.529 0.459 0.011 0.471 May Burnt 0.634 0.325* 0.041 0.366* Non burnt 0.587 0.378 0.035 0.413 Jun Burnt 0.623 0.373 0.003 0.377 Non burnt 0.492 0.508 0.000 0.508 Jul Burnt 0.336 0.560 0.104 0.664 Non burnt 0.347 0.568 0.085 0.653 *Difference between burnt and non burnt plots in biomass ratio statistically significant at P < 0.05; ** at P ≤ 0.001 (Ta b le 5 and Figure 1). In four periods, the production of total live phytomass differed between the fire treat- ments with significant interaction fire × phytomass change (Table 5). Burnt plots had significantly lower amounts of stand- ing dead and less variability of the litter compartment compared to non burnt plots (Figure 1). The mass of litter changed significantly from September to February and in May-July, demonstrating a significant effect of phytomass change and/or of its interactions with fire (Table 5), with net accumulation in non burnt plots in September-October and March-May, and a decrease in October-December and in Jun-Jul. In burnt plots net accumulation occurred in May-June (Figure 1). Total above-ground phytomass changed with signifi- cant main effect of phytomass change and/or of its in- teractions with fire in all periods except in Septem- ber-October and February-March (Table 5). A signifi Copyright © 2011 SciRes. OPEN ACCESS  S. N. Hassan / Open Journal of Ecology 1 (2011) 24-34 29 Table 5. ANOVA model factors, F statistics and P values for total live phytomass, standing dead, litter and total above-ground mass. ‘Phytomass change’: samples at Ti vs. Ti+1, ‘Fire’: samples on burnt vs. non burnt plots and ‘Sites’: samples at 6 sites. Phytomass difference: Difference (standardised per day) between mean Ti vs. Ti+1 on burnt and non burnt grasslands. ANPP: mean daily above- ground net primary production (gm–2·day–1) on burnt and non burnt grasslands from July 2003 to July 2004, in six sites in the West- ern Corridor, Serengeti National Park. Total live phytomass Standing dead phytomass Litter Total above-ground mass BURNT NON BURNT Factor F P F P F P F P Phytomass difference (gm–2 day–1) Daily ANPP (gm–2 day–1) Phytomass difference (gm–2 day–1) Daily ANPP (gm–2 day–1) Jul-Sep Phytomass change 2.31 0.131 0.85 0.590 2.61 0.110 3.01 0.0850.84 0.84 –0.97 0.00 Fire 50.51 0.0001 84.98 0.0001 54.090.0001113.450.0001 Fire × phytomass change 1.23 0.270 3.39 0.068 0.01 0.924 4.29 0.040 Sep-Oct Phytomass change 4.60 0.034 0.05 0.821 6.62 0.011 1.32 0.2521.13 1.13 0.83 0.83 Fire 93.75 0.0001 92.08 0.0001 5.64 0.019113.730.0001 Fire × phytomass change 5.05 0.026 0.85 0.357 8.99 0.003 0.92 0.339 Oct-Dec Phytomass change 0.98 0.324 1.57 0.21 16.800.00010.46 0.4972.45 2.45 0.68 0.68 Fire 5.17 0.025 34.11 0.0001 92.330.000126.080.0001 Fire × phytomass change 7.21 0.008 0.55 0.46 12.750.001 7.19 0.008 Dec-Feb Phytomass change 4.64 0.019 3.00 0.085 10.520.0026.31 0.0130.81 0.81 3.61 3.61 Fire 18.75 0.0001 58.98 0.0001 124.690.000158.050.0001 Fire × phytomass change 3.41 0.067 0.54 0.465 3.54 0.021 2.85 0.094 Feb-Mar Phytomass change 0.13 0.715 1.91 0.169 0.00 0.999 1.05 0.3080.74 0.74 2.6 2.60 Fire 3.98 0.048 25.41 0.0001 28.880.000119.590.0001 Fire × phytomass change 0.12 0.729 4.92 0.028 0.07 0.795 2.17 0.144 Mar-May Phytomass change 4.65 0.033 1.59 0.209 0.77 0.383 3.87 0.05 0.68 0.68 0.34 0.34 Fire 7.70 0.006 30.55 0.0001 63.970.000124.120.0001 Fire × phytomass change 8.68 0.004 0.06 0.801 0.03 0.864 2.01 0.159 May-Jun Phytomass change 4.53 0.035 8.24 0.005 24.120.000110.730.0011.25 1.25 0.17 0.17 Fire 0.002 0.968 13.12 0.0001 26.880.00015.17 0.025 Fire × phytomass change 4.31 0.04 3.68 0.057 16.310.00016.65 0.011 Jun-Jul Phytomass change 0.19 0.66 14.61 0.0001 18.7 0.00018.74 0.004–1.22 0.00 2.31 2.31 Fire 1.86 0.176 0.59 0.446 1.61 0.2081.5230.220 Fire × phytomass change 0.82 0.368 0.10 0.747 13.960.00010.0850.771 cant effect of the interaction phytomass change times fire indicated that phytomass production was dependent on the fire treatment. In non burnt plots, total above-gro- und phytomass decreased in the long dry season (July- September) and increased steadily during the growth season showing net accumulation in December-February. The amount of total live phytomass attained in this pe riod in fenced samples was maintained until the end of the rain period, May-Jun (Figure 1). In contrast, burnt plots had net phytomass accumulation at early stages of the post-fire period, July-December, including the dry eson, July-September and September-October. s a Copyright © 2011 SciRes. OPEN ACCESS 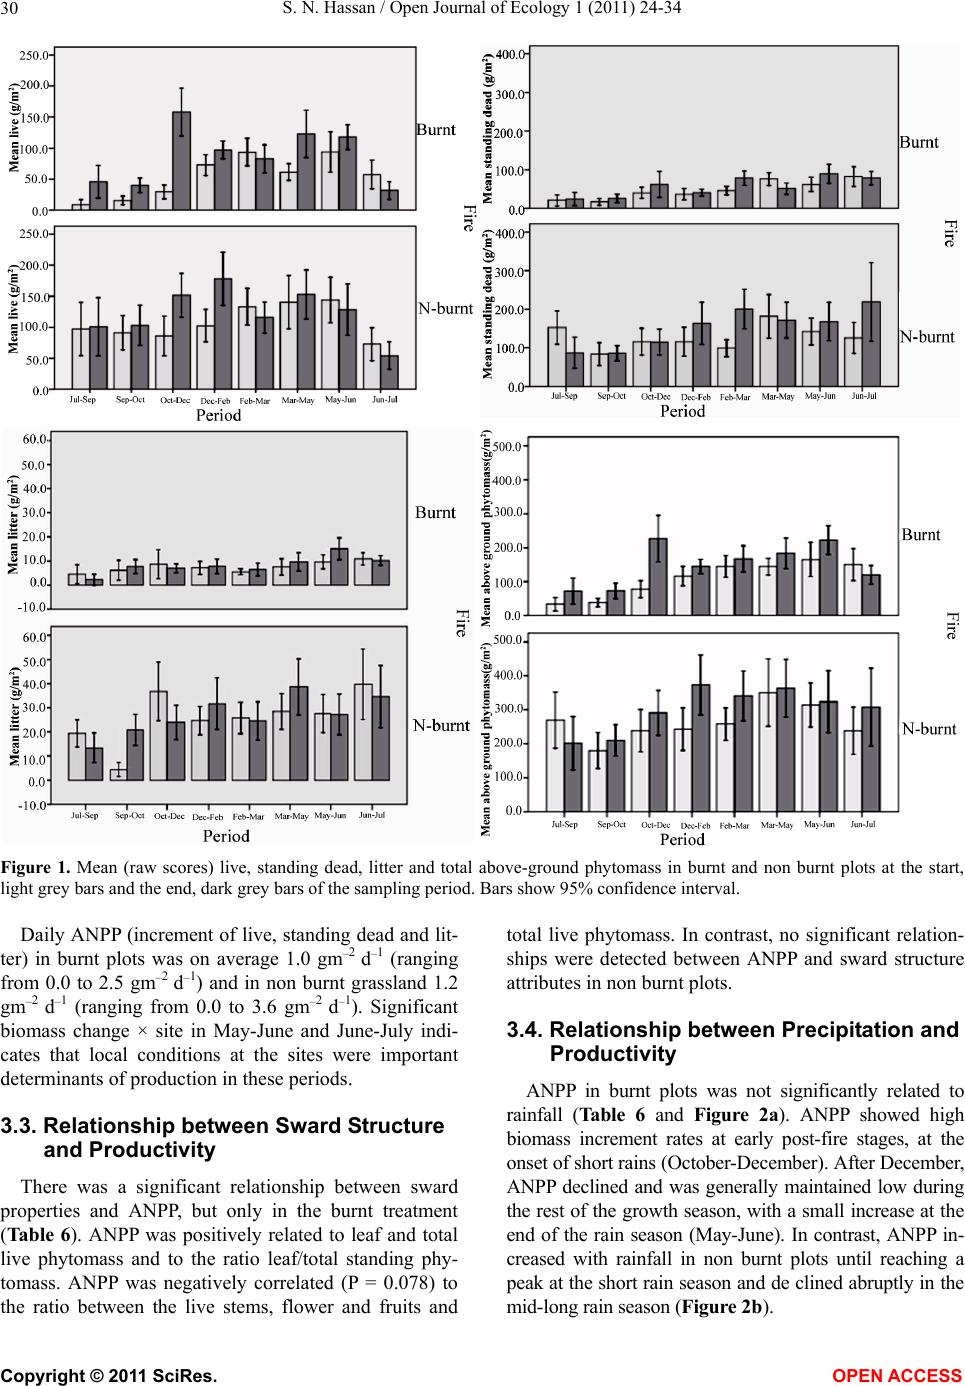 S. N. Hassan / Open Journal of Ecology 1 (2011) 24-34 30 Figure 1. Mean (raw scores) live, standing dead, litter and total above-ground phytomass in burnt and non burnt plots at the start, light grey bars and the end, dark grey bars of the sampling period. Bars show 95% confidence interval. Daily ANPP (increment of live, standing dead and lit- ter) in burnt plots was on average 1.0 gm–2 d–1 (ranging from 0.0 to 2.5 gm–2 d–1) and in non burnt grassland 1.2 gm–2 d–1 (ranging from 0.0 to 3.6 gm–2 d–1). Significant biomass change × site in May-June and June-July indi- cates that local conditions at the sites were important determinants of production in these periods. 3.3. Relationship between Sward Structure and Productivity There was a significant relationship between sward properties and ANPP, but only in the burnt treatment (Ta ble 6 ). ANPP was positively related to leaf and total live phytomass and to the ratio leaf/total standing phy- tomass. ANPP was negatively correlated (P = 0.078) to the ratio between the live stems, flower and fruits and total live phytomass. In contrast, no significant relation- ships were detected between ANPP and sward structure attributes in non burnt plots. 3.4. Relationship between Precipitation and Productivity ANPP in burnt plots was not significantly related to rainfall (Table 6 and Figure 2a). ANPP showed high biomass increment rates at early post-fire stages, at the onset of short rains (October-December). After December, ANPP declined and was generally maintained low during the rest of the growth season, with a small increase at the end of the rain season (May-June). In contrast, ANPP in- creased with rainfall in non burnt plots until reaching a peak at the short rain season and de clined abruptly in the mid-long rain season (Figure 2b). Copyright © 2011 SciRes. OPEN ACCESS 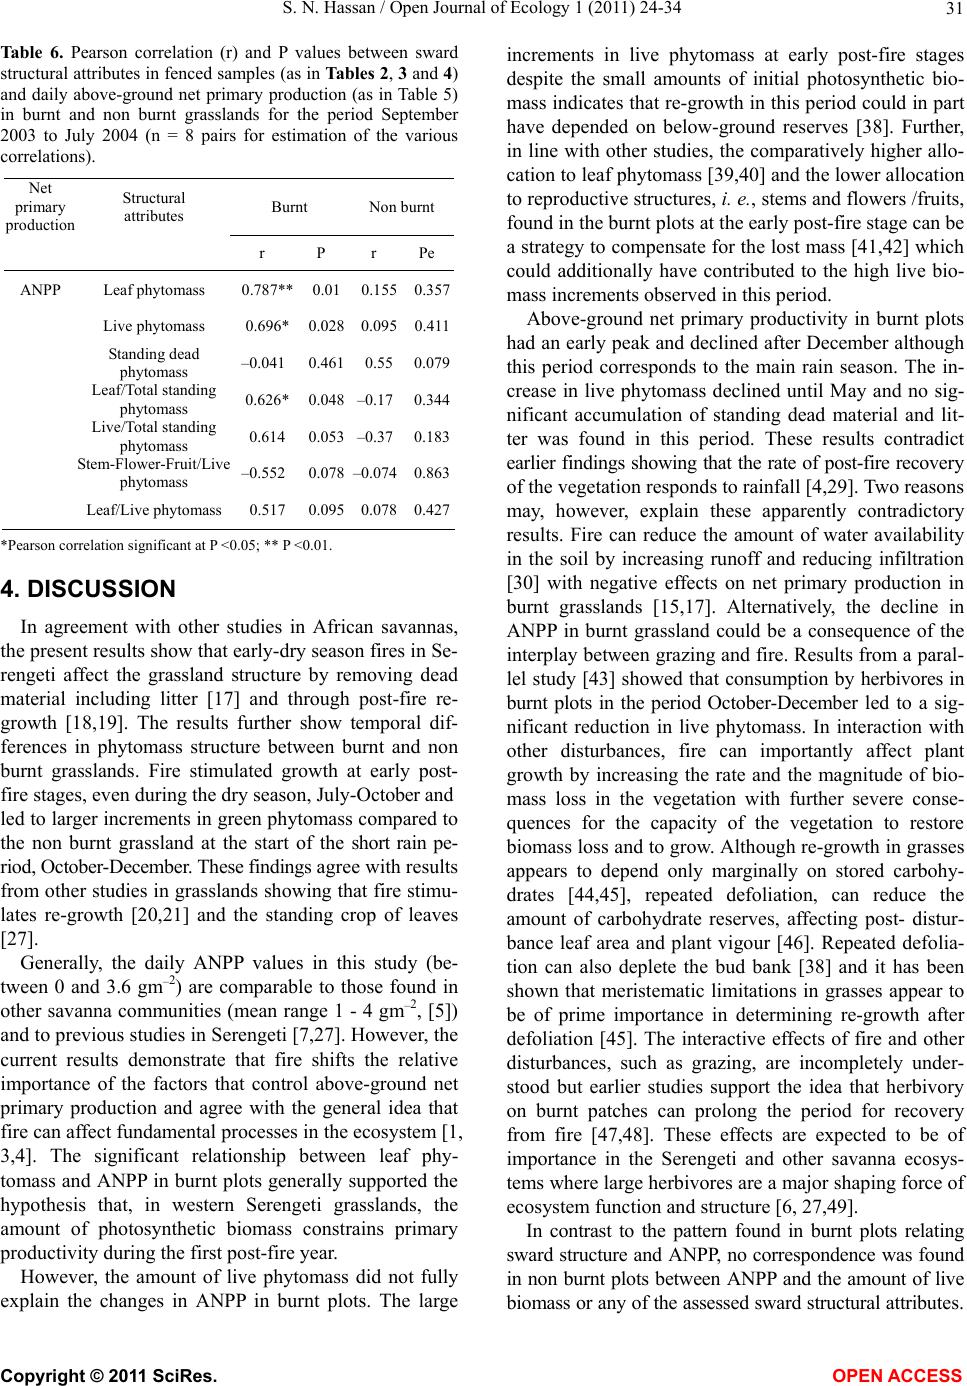 S. N. Hassan / Open Journal of Ecology 1 (2011) 24-34 31 Table 6. Pearson correlation (r) and P values between sward structural attributes in fenced samples (as in Tables 2, 3 and 4) and daily above-ground net primary production (as in Table 5) in burnt and non burnt grasslands for the period September 2003 to July 2004 (n = 8 pairs for estimation of the various correlations). Net primary production Structural attributes Burnt Non burnt r P r Pe ANPP Leaf phytomass 0.787**0.01 0.1550.357 Live phytomass 0.696* 0.028 0.0950.411 Standing dead phytomass –0.041 0.461 0.550.079 Leaf/Total standing phytomass 0.626* 0.048 –0.170.344 Live/Total standing phytomass 0.614 0.053 –0.370.183 Stem-Flower-Fruit/Live phytomass –0.552 0.078 –0.0740.863 Leaf/Live phytomass 0.517 0.095 0.0780.427 *Pearson correlation significant at P <0.05; ** P <0.01. 4. DISCUSSION In agreement with other studies in African savannas, the present results show that early-dry season fires in Se- rengeti affect the grassland structure by removing dead material including litter [17] and through post-fire re- growth [18,19]. The results further show temporal dif- ferences in phytomass structure between burnt and non burnt grasslands. Fire stimulated growth at early post- fire stages, even during the dry season, July-October and led to larger increments in green phytomass compared to the non burnt grassland at the start of the short rain pe- riod, October-December. These findings agree with results from other studies in grasslands showing that fire stimu- lates re-growth [20,21] and the standing crop of leaves [27]. Generally, the daily ANPP values in this study (be- tween 0 and 3.6 gm–2) are comparable to those found in other savanna communities (mean range 1 - 4 gm–2, [5]) and to previous studies in Serengeti [7,27]. However, the current results demonstrate that fire shifts the relative importance of the factors that control above-ground net primary production and agree with the general idea that fire can affect fundamental processes in the ecosystem [1, 3,4]. The significant relationship between leaf phy- tomass and ANPP in burnt plots generally supported the hypothesis that, in western Serengeti grasslands, the amount of photosynthetic biomass constrains primary productivity during the first post-fire year. However, the amount of live phytomass did not fully explain the changes in ANPP in burnt plots. The large increments in live phytomass at early post-fire stages despite the small amounts of initial photosynthetic bio- mass indicates that re-growth in this period could in part have depended on below-ground reserves [38]. Further, in line with other studies, the comparatively higher allo- cation to leaf phytomass [39,40] and the lower allocation to reproductive structures, i. e., stems and flowers /fruits, found in the burnt plots at the early post-fire stage can be a strategy to compensate for the lost mass [41,42] which could additionally have contributed to the high live bio- mass increments observed in this period. Above-ground net primary productivity in burnt plots had an early peak and declined after December although this period corresponds to the main rain season. The in- crease in live phytomass declined until May and no sig- nificant accumulation of standing dead material and lit- ter was found in this period. These results contradict earlier findings showing that the rate of post-fire recovery of the vegetation responds to rainfall [4,29]. Two reasons may, however, explain these apparently contradictory results. Fire can reduce the amount of water availability in the soil by increasing runoff and reducing infiltration [30] with negative effects on net primary production in burnt grasslands [15,17]. Alternatively, the decline in ANPP in burnt grassland could be a consequence of the interplay between grazing and fire. Results from a paral- lel study [43] showed that consumption by herbivores in burnt plots in the period October-December led to a sig- nificant reduction in live phytomass. In interaction with other disturbances, fire can importantly affect plant growth by increasing the rate and the magnitude of bio- mass loss in the vegetation with further severe conse- quences for the capacity of the vegetation to restore biomass loss and to grow. Although re-growth in grasses appears to depend only marginally on stored carbohy- drates [44,45], repeated defoliation, can reduce the amount of carbohydrate reserves, affecting post- distur- bance leaf area and plant vigour [46]. Repeated defolia- tion can also deplete the bud bank [38] and it has been shown that meristematic limitations in grasses appear to be of prime importance in determining re-growth after defoliation [45]. The interactive effects of fire and other disturbances, such as grazing, are incompletely under- stood but earlier studies support the idea that herbivory on burnt patches can prolong the period for recovery from fire [47,48]. These effects are expected to be of importance in the Serengeti and other savanna ecosys- tems where large herbivores are a major shaping force of ecosystem function and structure [6, 27,49]. In contrast to the pattern found in burnt plots relating sward structure and ANPP, no correspondence was found in non burnt plots between ANPP and the amount of live iomass or any of the assessed sward structural attributes. b Copyright © 2011 SciRes. OPEN ACCESS 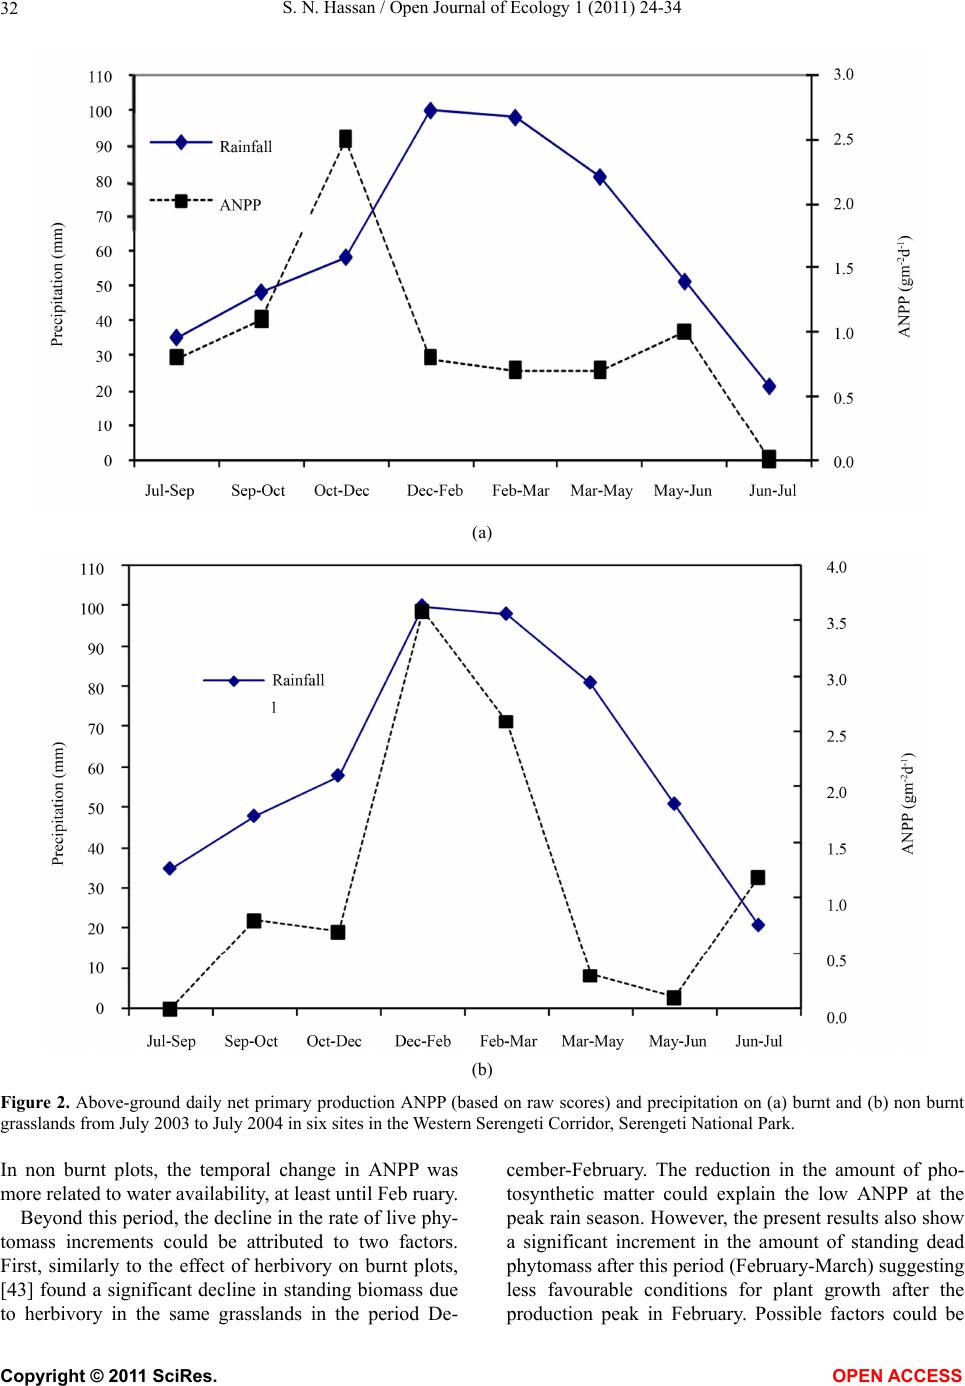 S. N. Hassan / Open Journal of Ecology 1 (2011) 24-34 Copyright © 2011 SciRes. 32 (a) (b) Figure 2. Above-ground daily net primary production ANPP (based on raw scores) and precipitation on (a) burnt and (b) non burnt grasslands from July 2003 to July 2004 in six sites in the Western Serengeti Corridor, Serengeti National Park. In non burnt plots, the temporal change in ANPP was more related to water availability, at least until Feb ruary. Beyond this period, the decline in the rate of live phy- tomass increments could be attributed to two factors. First, similarly to the effect of herbivory on burnt plots, [43] found a significant decline in standing biomass due to herbivory in the same grasslands in the period De- cember-February. The reduction in the amount of pho- tosynthetic matter could explain the low ANPP at the peak rain season. However, the present results also show a significant increment in the amount of standing dead phytomass after this period (February-March) suggesting less favourable conditions for plant growth after the production peak in February. Possible factors could be OPEN ACCESS  S. N. Hassan / Open Journal of Ecology 1 (2011) 24-34 33 shading [50] or the allocation of resources to below- ground parts towards the end of the growth period [17]. 5. CONCLUSIONS This study has demonstrated that early-dry-season fires in the Serengeti Western Corridor have important effects on the grassland phytomass during the first post-fire growth season both in terms of sward structure and ANPP. There- fore, this study summarises five overall conclusions: 1. There was lower phytomass and slow recovery of sward and litter on burnt than on burnt grasslands plots 2. ANPP in burnt plots did not significantly relate to rainfall, instead, it was very much related to rainfall in non burnt plots. 3. However, early burns caused positive relationship between some sward properties and ANPP. 4. Also, early burns enhance daily ANPP even in dry season, July-October. 5. Therefore, this study has ascertained fulfilment of the desire of fire management Program under the Serengeti Ecological Monitoring Program to supply green forage to both migratory and resident populations during the period of scanty food sup- ply. REFERENCES [1] Williams, R.J., Hutley, L.B., Cook, G.D., Russell-Smith, J., Edwards, A. and Chen, X.Y. (2004) Assessing the carbon sequestration potential of mesic savannas in the Northern Territory, Australia: approaches, uncertainties and potential impacts of fire. Functional Biology, 31, 415-422. doi:10.1071/FP03215 [2] Dezzeo, N. and Chacon, N. (2005) Carbon and nutrients loss in aboveground biomass along a fire induced forest-savanna gradient in the Gran Sabana, southern Venezuela. Forest Ec olo gy and Management, 209, 343- 352. doi:10.1016/j.foreco.2005.02.008 [3] Dai, X., Boutton, T.W., Hailemichael, M., Ansley R, J. and Jessup, K.E. (2006) Soil carbon and nitrogen storage in response to fire in a temperate mixed-grass savanna. Journal of Environmental Quality, 35, 1620-1628. doi:10.2134/jeq2005.0260 [4] Govander, N., Trollope, W.S.W. and Van Wilgen, B.W. (2006) The effect of fire season, fire frequency, rainfall and management on fire intensity in savanna vegetation in South Africa. Journal of Applied Ecology, 43, 748-758. doi:10.1111/j.1365-2664.2006.01184.x [5] Bourliere, F. and Hadley, M. (1970) The ecology of tropical savannas. Annual Review of Ecology and System- atics, 1, 125-152. doi:10.1146/annurev.es.01.110170.001013 [6] Mcnaughton, S.J. (1992) The propagation of disturbance in savannas through food webs. Journal of Vegetation Science, 3, 301-314. doi:10.2307/3235755 [7] Sinclair, A.R.E. (1975) The resource limitation of tropical levels in tropical grassland ecosystem. Journal of Animal Ecology, 44, 497-520. doi:10.2307/3608 [8] Beerling, D.J. and Osborne, C.P. (2006) The origin of the savanna biome. Global Change Biology, 12, 2023-2031. doi:10.1111/j.1365-2486.2006.01239.x [9] Chapin, F.S. Iii, Torn, M.S. and Tateno, M. (1996) Princ- iples of ecosystem sustainability. American Naturalist, 148, 1016-1037. doi:10.1086/285969 [10] Knapp, A.K., Conard, S.L. and Blair, J.M. (1998) Deter- minants of soil CO2 flux from a sub-humid grassland: Ef- fect of fire and fire history, Ecological Application, 8, 760-770. [11] Blair, J.M. (1997) Fire, Navailability, and plant response in grasslands: A test of the transient maxima hypothesis. Ecology, 78, 2359-2368. doi:10.1890/0012-9658(1997)078[2359:FNAAPR]2.0.C O;2 [12] Kang, S., Kimball, J.S., Running, S.W. (2006) Simulatin- g effects of fire disturbance and climate change on boreal forest productivity and evapo-transpiration. Science of the Total Environment, 362, 85-102. doi:10.1016/j.scitotenv.2005.11.014 [13] Georgiadis, N.J., Ruess, R.W., Mcnaughton, S.J. and Western, D. (1989) Ecological conditions that determine when grazing stimulates grass production, Oecologia, 81, 316-322. [14] Ojima, D.S., Schimel, D.S., Parton, W.J. and Owensby, C.E. (1994) Long-term and short-term effects of fire on nitrogen cycling in tallgrass prairie. Biogeochemistry, 24, 67-84. doi:10.1007/BF02390180 [15] Turner, C.L., Blair, J.M., Schartz, R.J. and Neel, J.C. (1997) Soil N and plant responses to fire, topography, and supplemental N in tall grass prairie. Ecology, 78, 1832-1843. doi:10.1890/0012-9658(1997)078[1832:SNAPRT]2.0.C O;2 [16] O’reagain, P.J. and Owen-Smith, R.N. (1996) Effect of species composition and sward structure on dietary quality in cattle and sheep grazing South African sourveld. Journal of Agricultural Science, 127, 261-270. [17] Snyman, H.A. (2005a) Influence of fire on litter pro- duction and root and litter turnover in a semi arid gra- ssland of South Africa. South African Journal of Botany, 71, 145-153, 133-144. [18] Van De Vijver, C.A.D.M., Poot, P., Prins, H.H.T. (1999) Causes of increased nutrient concentrations in post-fire re-growth in an East African savanna. Plant and Soil, 214, 173-185. doi:10.1023/A:1004753406424 [19] Vesey-Fitzgerald, D. (1971) Fire and animal impact on vegetation in Tanzania National Parks. Proceedings of Annual Tall Timbers Fire Ecology Conference, 11, 297- 317. [20] Norton-Griffiths, M. (1979) The influence of grazing, browsing and fire on the vegetation dynamics of the Serengeti, In: Sinclair A.R. and Norton-Griffiths, M., Eds., Serengeti: Dynamics of an Ecosystem, University of Chicago Press, Chicago. [21] Briggs, J.M. and Knapp, A.K. (2001) Determinants of C3 forb growth and production in a C4 dominated grassland. Plant Ecology, 152, 93-100. doi:10.1023/A:1011400101014 [22] Reich, P.B., Peterson, D.W., Wedin, D.A and Wrage, K. (2001) Fire and vegetation effects on productivity and nitrogen cycling across a forest-grassland continuum. Ecology, 82, 1703-1719. [23] Gholz, H.L. (1982) Environmental limits on aboveground ound net primary production, leaf area and biomass in vegetation zones of the Pacific Northwest. Ecology, 63, 469-481. doi:10.2307/1938964 Copyright © 2011 SciRes. OPEN ACCESS  S. N. Hassan / Open Journal of Ecology 1 (2011) 24-34 Copyright © 2011 SciRes. 34 OPEN ACCESS [24] Prins, H.H.T and Loth, P.E. (1988) Rainfall patterns as background to plan phenology in northern Tanzania. Journal of Biogeography, 15, 45-463. doi:10.2307/2845275 [25] Nortorn-Griffiths, M., Herlocker, D. and Pennycuick, L. (1975) The patterns of rainfall in the Serengeti ecosystem Tanzania. East African Wildlife Journal, 13, 347-374. [26] Sawadogo, L., Tiveau, D. and Nygård R. (2005) Influe- nce of selective tree cutting, livestock and Pre-scribed fire on herbaceous biomass in the savannah woodlands of Burkina Faso West Africa. Agriculture, Ecosystems and Environment, 105, 335-341. doi:10.1016/j.agee.2004.02.004 [27] McNaughton, S.J. (1985) Ecology of a grazing eco- system: The Serengeti. Ecological Monograph, 55, 259- 294. doi:10.2307/1942578 [28] Wiegand, T., Snyman, H.A., Kellner, K. and Paruelo, J.M. (2004) Do grasslands have a memory: Modeling phytomass production of a semiarid South African gra- ssland. Ecosystems, 7, 243-258. doi:10.1007/s10021-003-0235-8 [29] Nippert, J.B., Knapp, A.K. and Briggs, J.M. (2006) Intra- annual rainfall variability and grassland productivity: can the past predict the future? Plant Ecology, 184, 65-74. doi:10.1007/s11258-005-9052-9 [30] O'connor, T.G., Haines, L.M. and Snyman, H.A. (2001) Influence of precipitation and species composition on phytomass of a semi-arid African grassland. Journal of Ecology, 89, 850-860. doi:10.1046/j.0022-0477.2001.00605.x [31] Sinclair, A.R.E. (1995) Serengeti, past and present. In: Sinclair A.R.E. and Arcese, P., Eds. Serengeti II: Dyn- amics, Management, and Conservation of an Ecosystem, University of Chicago Press, Chicago, IL., USA. [32] Serneels, S. and Lambin, E.F. (2001) Impact of land-use changes on the wildebeest migration in the northern part of the Serengeti-Mara ecosystem. Journal of Biogeogra- phy, 28, 391-407. doi:10.1046/j.1365-2699.2001.00557.x [33] Pennycuick, L. (1975) Movement of the migratory wil- debeest population in the Serengeti area between 1960 and 1973. East African Wildlife Journal, 13, 65-87. [34] Clyaton, W.D., Phillips, S.M. and Renvoize, S.A. (1974) Flora of tropical East Africa. Graminae. Crown Agents for Overseas Governments and Administration, UK. [35] Taylor Jr., C.A., Brooks, T.D. and Garza, N.E. (1997) Effects of short duration and high-intensity, low freque- ncy grazing systems on forage production and compositi- on. Journal of Range Management, 46, 118-121. doi:10.2307/4002266 [36] Mutanga, O., Prins, H.H.T., Van Wieren, S.E., Huizing, H.G.J., Grant, R.F., Peel, M.J.S. and Biggs, H. (2004) Explaining grass-nutrient patterns in a savanna rangeland of southern Africa. Journal of Biogeography, 31, 819-829. doi:10.1111/j.1365-2699.2004.01072.x [37] Underwood, A.J. (2002) Experiments in Ecology: their logical design and interpretation using analysis of var- iance, Cambridge University Press, Cambridge, UK. [38] Briske, D. and Richards, J. (1995) Plant responses to defoliation: A physiological, morphological and demogr- aphic evaluation, Wildland Plants: Physiological Eco- logy and Developmental Biology, Society for Range Management, Denver. [39] Bowen, B.J. and Pate, J.S. (1993) The significance of root starch in post-fire shoot recovery of the Resprouter Stirlingia latifolia R.Br. (Proteaceae). Annals of Botany, 72, 7-16. doi:10.1006/anbo.1993.1075 [40] Gwynne, M.D. (1966) Plant physiology and the future Tropical pasture, Faber and Faber Limited, London. [41] Heichel, G.H. and Turner, N.C. (1983) CO2 assimilation of primary and re-growth foliage of red maple (Acer rubrum L) and red oak (Quercus rubra L): response to defoliation. Oecologia, 57, 14-19. doi:10.1007/BF00379555 [42] Trumble, J.T., Kolodny-Hirsch, D.M and Ting, I.P. (1993) Plant compensation for arthropod herbivory. An- nual Review of Entomology, 38, 93-119. doi:10.1146/annurev.en.38.010193.000521 [43] Hassan, S., Rusch, G.M., Hytteborn, H., Skarpe, C. and Kikula, I. (2007) Effects of fire on sward structure and grazing in western Serengeti, Tanzania. African Journal of Ecology, 46, 174-185. doi:10.1111/j.1365-2028.2007.00831.x [44] Chapin, F.S. Iii, Schulze, E. and Mooney, H.A. (1990) The ecology and economics of storage in plants. Annual Review of Ecology and Systematics, 21, 423-447. doi:10.1146/annurev.es.21.110190.002231 [45] Richards, J.H. and Caldwell, M.M. (1985) Soluble carbohydrates, concurrent photosynthesis and efficiency in regrowth following defoliation: A field study with Agropyron species. Journal of Applied Ecology, 22, 907- 920. doi:10.2307/2403239 [46] Mcpherson, K. and Williams, K. (1998) The role of carbohydrate reserves in the growth, resilience, and persistence of cabbage palm seedlings (Sabal palmetto). Oecologia, 117, 460-468. doi:10.1007/s004420050681 [47] Letnic, M. (2004) Cattle grazing in a hummock grassland regenerating after fire: The short-term effects of cattle exclusion on vegetation in south-western Queensland. Rangeland Journal, 26, 34-48. doi:10.1071/RJ04003 [48] Pratt, D. J. (1967) A note on the overgrazing of burned grassland by wildlife. East African Wildlife Journal, 5, 178-179. [49] McNaughton, S.J. (1979) Grazing as an optimization process: Grass-ungulate relationships in the Serengeti. American Naturalist, 113, 691-703. doi:10.1086/283426 [50] Sims, P.L and Singh, J.S. (1978) The structure and function of ten western North American grasslands IV Compartmental transfer and energy flow within the eco- system. Journal of Ecology, 66, 983-1009 doi:10.2307/2259309
|