 Open Journal of Yangtze Oil and Gas, 2016, 1, 1-22 Published Online April 2016 in SciRes. http://www.scirp.org/journal/ojogas http://dx.doi.org/10.4236/ojogas.2016.11001 How to cite this paper: Abu-Eishah, S.I. and Mohammad, R.S. (2016) Phase Behavior of a United Arab Emirates Stock-Tank Oil and Carbon Dioxide at Reservoir Conditions: Experiments and Thermodynamic Modeling. Open Journal of Yangtze Oil and Gas, 1, 1-22. http://dx.doi.org/10.4236/ojogas.2016.11001 Phase Behavior of a United Arab Emirates Stock-Tank Oil and Carbon Dioxide at Reservoir Conditions: Experiments and Thermodynamic Modeling Samir I. Abu-Eishah*, Rashid S. Mohammad Department of Chemical & Petroleum Engineering, United Arab Emirates University, Al Ain, UAE Received 13 January 2016; accepted 17 April 2016; published 20 April 2016 Copyright © 2016 by authors, Yangtze University and Scientific Research Publishing Inc. This work is licensed under the Creative Commons Attribution International License (CC BY). http://creativecommons.org/licenses/by/4.0/ Abstract Injection of a soluble gas like CO2 into an oil reservoir reduces the interfacial tension and oil vis- cosity and contributes to oil swelling, which together, in turn, enhance the oil mobility and relative permeabilit y. In this work an experimental phase equilibrium setup for the recombination of live oil (stock-tank oil and first-stage separator gas) and measurement of the corresponding phase behaviors of CO2/live oil mixtures is described. In the recombination process, the vapor-to-oil molar ratio was adjusted until the composition of the original reservoir fluid was obtained . The average of the absolute error (AAE) in composition was about 0.77% and 1.09% for the two re- servoir fluids under test (named here wells A#22 and A#33, respectively). The optimum vapor-to- oil molar ratio for zero deviation in the methane composition in the live oil (recombined) was about 0.42 for both wells. In addition, the PVTi simulator was used to reproduce the live oil (by combining the first-stage separator gas and the stock-tank oil) and also to predict the recombined oil characteristics at the reservoirs’ saturation pressure and bottom hole temperature. On the other hand, the PVTpro simulator was used to investigate the oil swelling rate and establish the relationship between saturation pressure and the injected CO2 mass fraction. The average of the absolute relative error (AARE) between experimental and predicted saturation pressures was 7.78% for well A#22 and 5.38% for well A#33. Keywords Crude Oil, Live Oil, Recombined Oil, Swelling Factor, CO2 Injection , Enhanced Oil Recovery *  S. I. Abu-Eishah, R. S. Mohammad 1. Introduction Tertiary or enhanced oil recovery processes are associated with the injection of a specific type of fluid or fluids into a reservoir. The fluid injection supplements the natural energy left over in the reservoir and displaces the un-recovered oil. The increased interaction between the injected fluid and the in-place oil re sults in alteratio ns in rock and fluid properties. Flui d i nje ctio n and e vent ual inte ra cti on br ing ab out c han ges li ke a lo werin g in in ter fa- cial tension, oil swelli ng, oil viscosity reductio n, wettability modificat ion, and sometimes favor able phase beha- vior conditio ns. T hese changes are mainly attributed to physics and chemical interaction between the two fluids and also to the fluid injection rate and pressure [1]. The many advantages of CO2 injection over tho se of water and nitrogen injection are summarized in [2]. CO2 flooding is among the most promising enhanced oil recovery (EOR) methods in heavy oil reservoirs and has been successfully used in a number of worldwide basins where other EOR techniques are not applicable [3]. CO2 becomes supercritical when injected under reservoir conditions, and as a consequence it can recover more oil with the additional bene fit of co nside rabl y reduci ng gr eenho use ga s emi ssions . The greatest difference co m- pared to other gases is that CO2 can extract heavier components up to C30. The so lubility of CO2 in hydrocarbon oil causes the oil to swell. CO2 expands oil to a greater extent than methane does. T he swell ing dep ends on t he amou nt of met hane in the oil. B ecause the CO2 does not displace all of the methane when it contacts a reservoir fluid, the more methane there is in t he oil, the less is the swellin g o f the oil [4]. Several facto rs that affect the mobilization efficiency are rock geometry, pore structure, flooding rate and flu- id proper ties [5]. D uring the floo ding pr ocess, CO2 is injected into the formation to highly enhance the mobility of the contacted oil, thus promoting its displacement towards production. Oil mobility is improved because the solubility of CO2 in the oil in creases the oil volume and at the sa me time causes a r eduction in the oil viscosity [5]. Characterization of produced and residual oils in the CO2 flooding process has been recently carried out by [6]. T his kind of stud y provid es a dee p understand ing of t he changes of properties of the produced and residual oils in CO2-EOR processes. The solubilit y of CO2 in oil fractions constitutes a key factor for EOR successful projects and thus, the study of phase behavior of the CO2/crude oil system is the first fundamental step for understanding the oil recovery mechanism in petroleum reservoirs. K nowledge about the phase behavior of solvents of lo w molecular weights (such a s CO2) and petroleum fluids is important for primary oil production, enhanced oil recovery, gas injection [7] and re-injection [5], pipe line transpo rtatio n, deasp haltin g, and petroleum processing and refining [8]. Several literature correlations for CO2-oil physical properties (CO2 solubility, oil swelling due to CO2, CO2-oil density, and CO2-oil viscosity) have been tested by Al-Jarba and Al-Anazi [9] who recommended Emera and Sarma models [10] to be applied over wider data ranges and operating condi tions. Feizabadi et al. [11] observed the formation of a second liquid phase when propane or CO2, was used as sol- vent, with the second liquid phase mainly composed of the solvent itself. They carried out a research to under- stand the importance of the second liquid phase and its effect on oil production. They claimed that the allocation of such a liquid phase through a simulator would allow for prediction of the amount of solvent that can be pro- duced and recycled, which makes a more realistic cost evaluation of the solvent injection processes. T hey added that the relative pe rmeabilit y plays an important ro le in multiphase flow; numerical re sults indicated that, b y in- creasing the number of phases, there will be an increase in the project life. Prior to a ny CO2-EOR project, meticulous laboratory tests have to be conducted to characterize the phase be- havior bet ween CO 2 and the reservoir oil. T he resul ts of t hese are ver y impo rtan t duri ng the p re-inj ecti on phase to establish baseline predic tions of CO2 behavior in the reservoir and oil production [12]. In thi s wo rk, e xpe ri menta l ph ase tr ans itio n data of mixt ure s c omposed of CO2 and live oil are reported over a pressure range of 150 to 330 bar and a CO2 ma ss fraction of to 0.6 at the reservoir bottom hole temperature. Increasing above 0.6 requires a pressure > 500 bar in the syringe pump. At no stabilization was observed and no monophasic system was detected. 2. Field Data and Materials Used The Commercial Service Provider collected and analyzed two bottom-hole samples from wells A#22 and A#33 in the U AE. T he reservoir initial static p ressure, botto m hole te mperature and bubble p oint pressure at that te m- perature are respectively 4687 psia, 235˚F and 2277 psia for well A#22 and 2820 psia, 257˚F and 2377 psia for well A#33. The API gravity of the stock-tank oil at standard conditions are 37.1 and 36.9 for wells A#22 and  S. I. Abu-Eishah, R. S. Mohammad A#33, respectively. The stock-tank oil as supplied has the compositional analysis and characteristics presented in Table 1 and Table 2. The carbon dioxide used in this work was supplied by Air Products Emirates Gas LLC, Duba i (UAE) a nd has a purity > 99.5%. 3. Experimental Setup The experimental scheme used in this work is based on the static-synthetic method shown in Figure 1. It con- sists of a high-pressure, variable-volume PVT view cell (made in Brazil), two syringe pumps (ISCO brand, model 260D) and a heating device with magnetic stirrer (Stuart Magnetic Stirrer CC162/SC162). T he view cell has two sapphire windows for visual observations, an absolute pressure transducer (Smar, LD 301) with a preci- sion of ±0.31 bar, and a portable programmer (Smar, HT 201) for pressure data acquisition. The eq uilibriu m cell Table 1 . Fluid compositions (mol %) for wells A#22 and A#33 as supplied by the commercial service provider (p ≡ pseu- do). Comp onent Well A#22 Well A#33 Flashed liquid flashed gas Monophasic flui d Flashed liqui d Flashed gas Monophasic flui d N2 0.00 0.23 0.119 0.00 0.18 0.101 CO2 0.01 3.58 1.860 0.03 4.86 2.738 CH4 0.06 61.09 31.692 0.08 58.58 32.858 C2H6 0.15 11.80 6.188 0.25 11.73 6.682 C3H8 0.60 10.54 5.752 1.05 10.72 6.468 i-C4H10 0.37 2.24 1.339 0.57 2.39 1.590 n-C4H10 1.38 5.23 3.375 2.06 5.62 4.055 i-C5H10 1.36 1.65 1.510 1.73 1.88 1.814 n-C5H10 2.27 1.92 2.089 2.90 2.24 2.530 p-C6H14 5.51 1.14 3.245 6.56 1.27 3.596 p-C7H16 7.31 0.46 3.760 8.42 0.43 3.943 p-C8H18 8.08 0.11 3.949 9.33 0.09 4.153 p-C9H20 7.42 0.01 3.579 8.49 0.01 3.739 p-C10H22 6.96 0.00 3.353 7.61 0.00 3.346 p-C11H24 5.73 0.00 2.760 6.13 0.00 2.695 p-C12H26 4.92 0.00 2.370 5.00 0.00 2.199 p-C13H28 4.77 0.00 2.298 4.50 0.00 1.979 p-C14H30 4.94 0.00 2.380 3.74 0.00 1.644 p-C15H32 4.42 0.00 2.129 3.41 0.00 1.499 p-C16H34 4.01 0.00 1.932 2.79 0.00 1.227 p-C17H36 3.49 0.00 1.681 2.42 0.00 1.064 p-C18H38 3.05 0.00 1.469 2.15 0.00 0.945 p-C19H40 2.81 0.00 1.354 2.04 0.00 0.897 20.38 0.00 9.817 18.75 0.00 8.244 Molar ratios 0.4817 0.5183 1.00 0.4397 0.5603 1.00 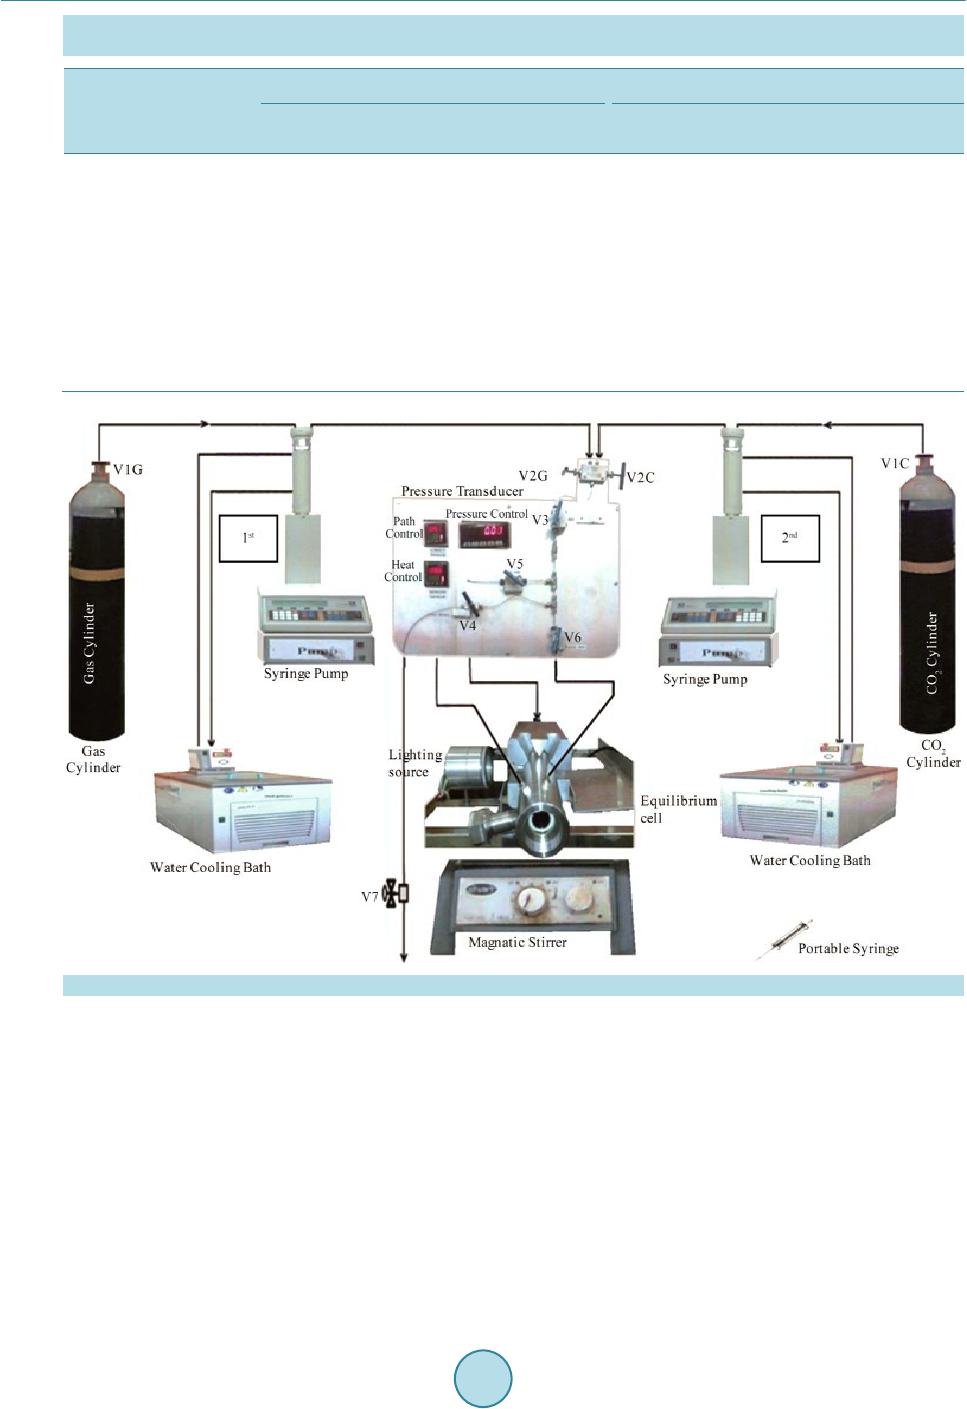 S. I. Abu-Eishah, R. S. Mohammad Table 2 . Some phase properties for wells A#22 and A#33 as supplied by the commercial service provider (NA ≡ not avail- able). Properties Well A#22 Well A#33 Flashed liquid Flashed gas Monophasi c flui d Flashed liqui d Flashed gas Monophasic flui d Fluid molar mass (g/mol) 200.25 28.08 111.02 190 .79 29.06 100.18 molar m ass (g/mol) NA -- NA 212.16 98.34 211.26 molar m ass (g/mol) 4 03.78 -- 403.78 424.48 -- 4 24.48 Fluid density (g/cm3) 0.832 0.001185 -- 0.828 0.001227 -- density (g/cm3) NA -- NA 0.843 -- 0.842 density (g/cm3) 0.909 -- 0.909 0.916 -- 0.916 Gas specific gravity, air = 1 -- 0.970 -- -- 1.003 -- Figure 1 . A visual diagram of the static-synthetic method used in this work. includes a movable piston, which permits the control of pressure inside the cell. Phase transitions are recorded through pressure manipulation using the syringe pump and a solvent (CO2) as a pressurizing fluid. The set of valves used in the unit and their objectives are discussed elsewhere [13]. The equilib rium cell consi sts of a 316 stainle ss-steel cyli nder, with a 17.2 mm internal diameter and 176 mm length. The cell is equipped with a piston for system volume and pressure variation. The equilibrium cell is heated by an automatically controlled electric heating system. The equilibrium cell has two top holes for ther- mocouple connection and feed valve connection or gas removal during the recombination process. The equili- brium cell has also three hole s: a rear hole, lateral and front windows respective ly for piston displac ement, light source and infrared device to detect and record phase transitions (Figure 2). The p isto n ha s t wo O -rings (BUNA N90) that allow smooth slip inside the cell for pressurizing or depressurizing. The O-rings ensure the sealing (insulation) of t he sample (Figure 3).  S. I. Abu-Eishah, R. S. Mohammad Figure 2 . Picture of the equilibrium cell used in this work. Figure 3 . Details of the components of the piston used in the equilibrium cell. For phase eq uilibriu m measure ments throug h the static-s ynt he tic metho d , a sui ta bl e d e vice fo r q ua ntif yi ng t he amount injected into the equilibrium cell and also for handling the system pressure is required. Syr ing e -type pumps are ideally designed for this purpose and they have an inner cylinder connected to an automatic flow and a pressure indicator controller (COEL K484P). Each of the two syringe pumps (ISCO Brand, Model 260D) has an inner cylinder of 266 ml and a discharge pressure of up to 500 bar. T he chamber cylinders of the pumps are jacketed to keep their temperature constant using water circulating baths. The equilibrium assembly of the cell begins with the adjustment of the piston O-rings tight ness. T his ste p re- quires special care, because if the piston tightening is weak it will allow fluid passage into the cell and thus changes the overall composition. At the same time pisto n tightening should not be too strong to avoid pressure drop between the sample and the process line. The system was continuously stirred and the pressure inside the cell was gradually increased until the condi- tion o f a single -phase s ystem was obtained, then the pressure was reduced gradually until the saturation pressure of the system was recorded at the specific reservoir bottom hole temperature. For saturation pressure measure- ments, the light source from the lateral window of the equilibrium cell was turned on and a digital camera (Ge- nius eFace 1325R) with an infrared d evice that provides superio r image quality under any light conditio ns; even in the dark. All the measurements in the above tests were performed using the infrared device which allows phase transition detection with <1 bar (or ±1% error). 4. The Recombination Test Procedure Due to the diffic ulties and c os ts involved i n bo tto m-hole sa mp le s ’ mea s ur e me nts, it wa s inte nde d in t hi s wor k t o reproduce the original reservoir fluid with bubble point pressure and composition as close as possible to the original reservoir fluid under test. Thus, the recombination process was performed here to reproduce the reser- voir fluid for further PVT studies using gas samples from the first-stage separator and oil samples from stock- tank oil (dead oil) with compositions provided by the Commercial Service Provider. The ga s fr o m t he first-stage separator is a mixture of hydrocarbons up to . The detail of recombination test procedure can be found in [13] and it is summarized by the flow chart shown in Figure 4. The experimental procedure for the recombination process using this type of experimental setup, begins with loading the gas from the gas cylinder (at ambient temperature) into the chamber of the 1st syringe pump using valve V1G. The temperature in the chamber of syringe pump is kept constant at 283.15 K using the water- cooled circulating system (Julabo F34, Germany). Then valve V1G was closed and the pressure was raised to 100 bar inside the chamber. T he stabilization of the syste m (zero pump flow) requires about 10 to 15 min, and should be carefully done to avoid any trace flow that might lead to systematic error in the measured volume of the injected gas. 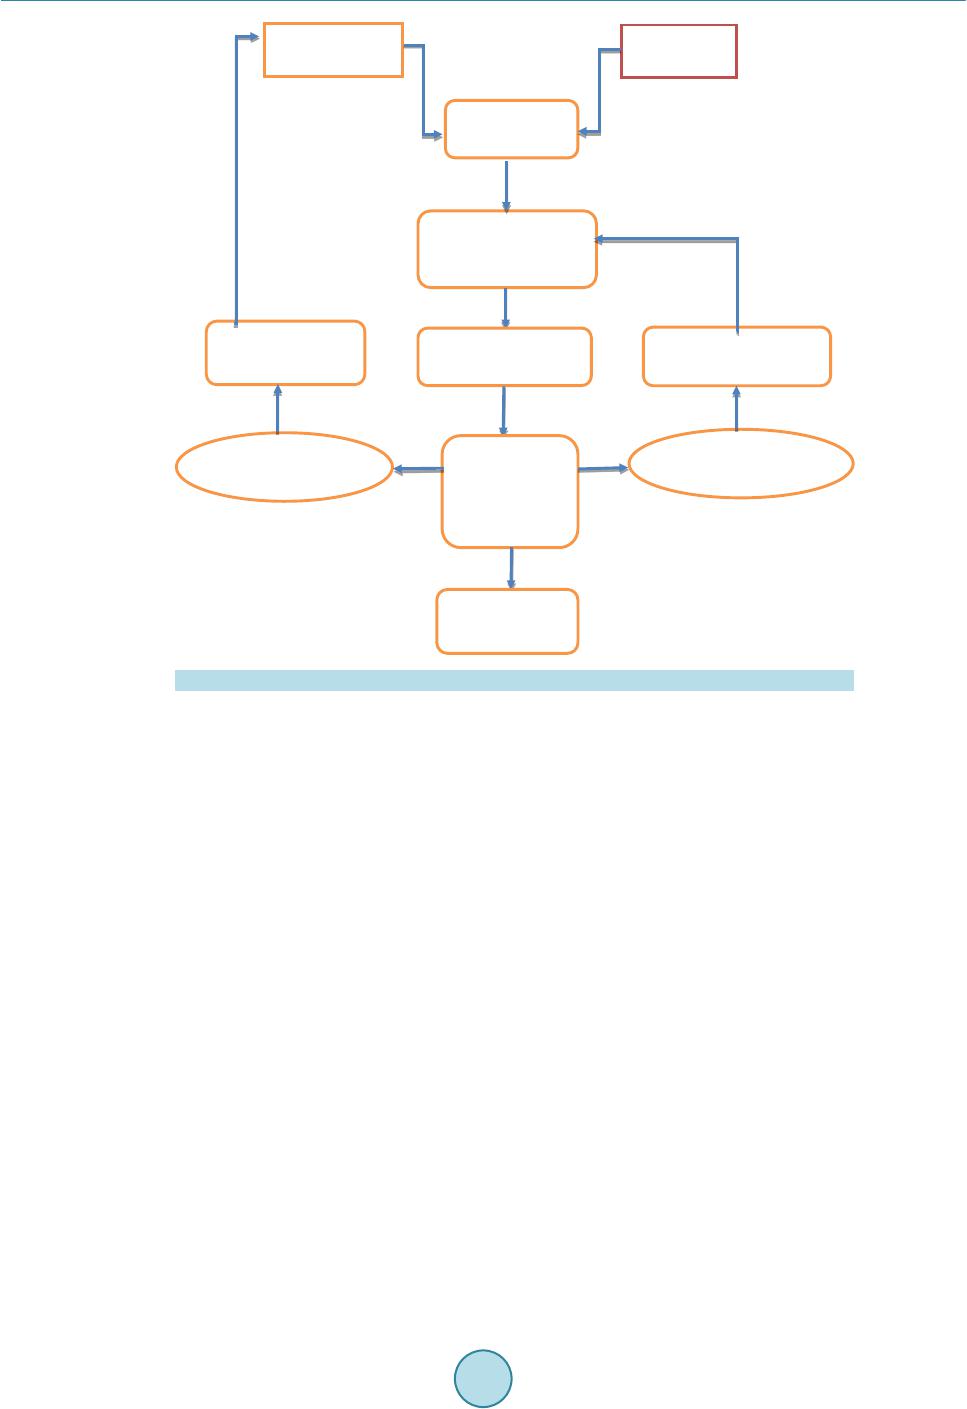 S. I. Abu-Eishah, R. S. Mohammad Figure 4 . Flow chart for the recombination test procedure. A typical recombination process starts by insertion of a precise amount of the stock-tank oil into the equili- brium cell through valve V6 using the portable syringe. The cell is then connected to the process lines (feed, pre ssurizing/ depre ssurizi ng and thermoco uples). Onc e the syste m in the 1 st syringe pump chamber is stabiliz ed, the volume of the gas inside the chamber is recorded and a pre-calculated volume of that gas is inj ected into the equilibrium cell through valves V2G, V3 and V6. Then valves V3 and V6 are closed. The starting temperature inside the equilibr i um cell is t he roo m temperature . The magne t ic sti rr er is t hen s witched o n and the temperature is raised in steps to the reservoir bottom hole temperature. This process usually takes about 15 minutes. The light source from the lateral window on the equilibrium cell is turned on and any phase transition will be de- tected and recorded by the infrared web-cam. The pressure is then raised to a pressure well above the bubble point of the reservoir fluid (i.e., 154.9 bar for well A#22 and 161.7 bar for well #33) until a monophasic fluid is obtained, while maintaining the reservoir bottom hole temperature (235˚F for well A#22 and 257˚F for well A#33). T hen the pressure is gradually reduced until the first bubble is observed. If the recorded bubble pressure is away from the reservoir pressure, then follow the procedure depicted in Figure 4. In all cases, the pressure shall be monitored by the pressure indicator controller. 5. Calculations for the Recombination Process Since the gas composition obtained from the gas c ylinder i s differ ent from that ob t ained by flashing the reservoir monophasic fl uid directl y to standard c onditions, this kind of reco mbination proce ss can lead to a live oil a little different from the reservoir fluid, therefore, the vapor-to-oil molar ratio has to be adjusted until a monophasic fluid is obtained with a fluid composition of minimum deviation from that of the reservoir fluid under test. The optimized vapor-to-oil molar ratios have been found 0.5183 for wells A#22 and 0.5603 for well A#33, which are almost the same as those given by the Commercial Service Provider. For minimum deviation in the methane concentration between the reservoir and the recombined fluids, the vapor-to-oil molar was found to be around Equilibrium (PVT) Cell First-stage separator Gas Dead Oil (Stock Tank) Recombinatio n Process at Reservoir Conditions Constant Composition Expansion (CCE) Test Observed pressure = Reservoir pressure? CO 2 Injection (Swellin g Test) Differential Liberation (DL) Test Observed pressure > Reservoir pressure Observed pressure < Reservoir pressure Inject more gas into the PVT Cell Yes NO NO  S. I. Abu-Eishah, R. S. Mohammad 0.42 for both wel ls. The global composition of component i in the monop hasic fluid is ob ta ined t hrough a global material balance: (1) where β is the vapor-to-oil molar ratio, xi and yi are the mole fractions of component i in the liquid phase and vapor phase, respectively. The values of β, xi and yi for wells A#22 and A#33 were obtained by flashing the monophasic fluid from the well condition to the standard conditions (60˚F and 14.7 p sia). T he re sulting ga s and liquid phases were then analyzed by gas chromatography. F or the project chart, the values of xi and yi were ob- tained by chromatography analysis of the stock-tank oil and the gas from the first-stage separator, respectively. Since the two-stage recombination process is performed by injecting the gas into the stock-tank oil, for the phase behavior measurement of the live oil, the overall composition of the mixture has to be computed. Since the mass of the dead oil is known, the mass of the gas to be injected has to be estimated in order to obtain the mass of the live oil. For these purposes the same molar ratio of the project was used: and (2) where nV and nL are the number of moles in the vapor and liquid phases, respectively, and nt is the total number of moles in both phases. Since (3) where ρL, VL and ML are respectively, the density, volume and average molar weight of the stock-tank oil to be injected in the eq uilibrium cell. Thus, and 0.58 0.724. LL VtL V nn M ρ = = (4) For non-ideal gas, the vapor volume is calculated as [3]: (5) where ZV is the vapor compressibility facto r. Substituting Equation (4) into Equation (5) gives 0.724 0.724 . LL V V L LV L VZ RT VP M mZ RT P M ρ = = (6) In order to calculate VV, the compressibility factor of the gas mixture has to be determined using, for example, the theory of corresponding state which requires the reduced temperature, Trm, and reduced pressure, Prm, of t he gas mixture; which requires the estimation of the mixture critical temperature, Tcm, and critical pressure, Pcm, for exa mple, usi ng the Kay’ s rule ( Equation (7)) and the composition and the c ritical prope rties of the pure compo- nents of the gas mixture presented in Table A1 in the Appendix. and (7) The Z factor was estimated by the Brill and Beggs correlation [14]: (8) where Ppr and Tpr are the pseudo-reduced pressure and temperature, respectively. The other parameters used in Equation (8) are as follows:  S. I. Abu-Eishah, R. S. Mohammad () ()() () ( ) 2 0.5 20.723 1 26 0.715 1.1280.42 1.390.920.36 0.101 0.066 0.620.230.037 +0.32e 0.86 0.1320.32 log e. pr pr pr pr pr T prpr prpr pr pr TT AT T BPT PP T CT D −− −+ = −−− = −+−⋅ − = −∗ = (9) The above correlation (Equation (8)) has been found adequate (±2% error) for a temperature range of 80˚F - 340˚F and pressures < 10,000 psia [7]. The main advantage o f thi s correlatio n is being explicit in Z. In this work, the gas is injected fro m the 1st syringe pump at 283.15 K and 100 bar which correspond to the Trm and Prm values s hown in Ta ble 3 for wells A#22 and A#33. As sumin g the gas used to be a natur al gas [15], then after estimatin g the Z-factor in terms of the mixture pse udo-reduced properties, Equation (6) can be used to estimate VV; the volume of th e gas to be injected into t he equilib rium cell. F urther details o n the recombination resul ts are presented later. 6. The Swelling Test Procedure The swelling test experimental pro c e dure is as follows: 1) Follow all the steps of the recombination process until you obtain almost the same reservoir bubble point pressure at the reservoir bottom hole temperature (235˚F for well A#22 or 257˚F for well A#33). The corres- ponding bubble point pressures should be 154.9 bar for well A#22 and 161.7 bar for well A#33. Wait for t he 2 nd syringe pump to stabilize, t hen record the initial volume of the gas inside its chamber, Vi. 2) Decrease the equilibrium cell pressure gradually starting from the saturation pressure to a lower pressure, say, 60 bar, by pulling the equilibrium cell piston back using the 2nd syringe pump mechanism. In this case, a t wo-phase s ystem is obtained. 3) Close the pressurizing/depressurizing valve, V5, and raise the pressure in the 2nd syringe pump chamber back to saturation pressure and wait until the pump stabilizes, then open valve V5 directly to pressurize the equilibrium cell back to saturation pr essure. In this case, a monophasic fluid is obtained. 4) Let the 2nd syringe pump to stabilize and then record the final volume of the gas in its chamber, Vf. Then the volume of the recombined (live) oil, V0, in the equilibrium cell is eq ual to the disp lace d vo lume in the 2nd sy- ringe pump chamber, i.e., 0disp live oilif V VVV == − . Table 3. Sample result for the volume of the gas to be transferred from the 1st syringe pump chamber to the equilibrium cell for wells A#22 and A#33. Property Well A#22 Well A#33 Vapor-to-oil molar r atio, β 0.4199 0.4196 P, bar (in 1st sy r ing e pump c h a m be r ) 100 100 T, K (in 1st syringe pump chamber) 283.15 283.15 Pcm, bar (stock-tank oil) 46.324 46.862 Tcm, K (stock-tank oil) 231.66 223.25 Prm (stock-tank oil) 2.1 59 2.1339 Trm (stock-tank o il) 1.222 1.2683 ZV (Using Equati on (8)) 0.5804 0.5712 ρL, g/ml ( Fi eld data) 0.825 0.816 ML, g/g-mol (Field data) 2 00.04 190.74 mL, g (mass of injected st ock-tank oi l) 5.70 5.70 VV, ml/g (using Equation (6)) 0.364 0.375  S. I. Abu-Eishah, R. S. Mohammad 5) Decrease the pressure in the equilibrium cell gradually to 60 bar. Then close V5 and raise the pressure in- side the 2nd syringe pump chamber to 240 bar. This pressure is used for CO2 injection at the corresponding re- servoir bottom hole temperature. 6) Let the 2nd syringe pump to stabilize and record the volume of the CO2 inside its chamb er, . The n o pe n val ves V 2 C, V 3 and V6 a nd inj e ct the pr e-calculated volume of CO2, (for each CO2 mass fraction) into the equilibrium cell. The volume of the re maining CO2 insi de the 2nd syringe pump chamber, 2 22 after injecting CObefore injecting COCO injected VV V= − . 7) Close valve V6 and gradually decrease the pressure inside the 2nd syringe pump chamber from 240 bar to 60 bar. 8) Open valve V5 and gradually increase the pressure inside the equilibrium cell until a monophasic fluid is observed and then gradually decrease the pressure until the first phase separation is observed. Record the ob- served phase transition pressure (Pbub or Pdew). 9) Let the 2nd syringe p ump to stabilize a nd then record the initial volume of the CO2 in its chamber, . 10) Gradually reduce the equilibrium cell pressure from the observed phase transition pressure down to 60 bar in order to leave the piston at its maximum position at the ba c kside of the equilibrium cell. 11) Close valve V5 and increase the pressure inside the 2nd syringe pump back to the observed phase transi- tion pres s ure. Re-open valve V5 to pr essurize the equilibrium cell and let the syringe pump to stabilize again and then record the final volume of the CO2 in its chamber, . Thus the displaced volume of the CO2/live oil system, 2 22 01 disp COlive oil,CO,COif VVV V== − . 12) The swelling factor defined as the ratio between the volume of the saturated CO2/live oil mixture a nd the volume of the saturated live oil at the reservoir temperature [16] is then calculated as 2 01 disp COlive oil 0 displive oil . sw VV VVV = = It should b e mentioned t hat the CO2 chart [16] was used to determine the de nsit y o f CO2 a t the give n te mper- ature and pressure in order to calculate the displaced CO2 mass in t he 2nd syringe pump chamber, which has to be placed in the equilibrium cell. The swelling tests results for va rious CO2 mass fractions are presented later. 7. Thermodynamic Modeling and Simulation In designing gas injection schemes and in many reservoir engineering situations, reliable methods are necessary to predict the gas -saturated cr ude oil den sity which i s required for the calculatio n of the oil s welling and the oil formation volume factors. This has led to many prediction methods and correlations which are generally appli- cable to specific cases and often require knowledge of molar volume and solubilit y of the gas in the li ve oil at the reservoir condition s. These correlations are empirical by their nature and thus can lead to large errors when extrapolated beyond the range of variables covered in their study [17]. Equations of state are used for generating the fluid model that can help in predicting the reservoir fluid prop- erties at different pressures/temperatures and compositions and also help in material balance and flash calcula- tions. The use of an equation of state at certain temperature and pressure with known overall composition, al- lows determining whether the fluid exists as a single or a multi-phase system and to estimate the density and composition of the existing phase(s) [18]. For PVT data correlations, the Peng-Robinson equation of state (PR EOS) represents a significant improve- ment over the Soave-Redlich-K wong equation o f state (SRK E OS); while t he SRK EOS pred icts a critical co m- pressibilit y factor, Zc, SRK = 0.333, the corresponding value predicted by PR EOS, Zc, PR = 0.307 which is closer to the repor ted experimental co mpressibilit y factors for hydrocarbons which are usually between 0.2 and 0.29. The PR EO S [19] is gi ven by () () RT a Pvbvvb bvb = − −++ − (10) where (11)  S. I. Abu-Eishah, R. S. Mohammad 22 0.45724 . c cc RT aP = (12) For components with acentric factor ω ≤ 0.49, the fo l lo wing func t io n is use d: 2 0.379642 1.54220.2699m ωω = +− (13) and for components with acentric factor ω > 0.49, t he following function is used: 23 0.379642 1.485020.164423.0.016666m ωω ω =+− − (14) A thir d para meter, usuall y kno wn as the vo lume-shift parameter (ci) ca n be intro duced t hrough t he follo wing relation [20]: (15) where v(2) is the mixture volume predicted by the two-parameter equation of state, v(3) is the mixture corrected volume, and zi is the liquid or vapo r mole fraction (xi or yi) of component i. The shift in volume leads to a con- venient reduction in the Z factor. The values of ci are commonly calculated by comparing the observed liquid molar volume at standard condition ( ) wit h tha t ob tai ned b y t he t wo-para meter EOS at the same conditions ( ). This difference determines the value o f ci for component i. ( )( ) ,, EOS OBS iist stistst c vPTvPT= − (16) The dimensionless volume-shift parameter ( si) is usuall y defined as a ratio between ci and bi (pure-component co-volume defined by Equation (11)). (17) The calculated shift parameters for the reservoir fluid of well A#33 are listed in Table A2 in the Appe ndi x. It should be noted that the volume-shift correction has no effect on the iso-fugacity condition and thus, it does not affect other predicted e quilibrium prop e rties like saturat ion pressure a nd the k values [18]. For flui d mixtures, the van de r Wa als mi xing rules are co mmonly used (18) () () 0.5 1 iji jij a aak = − (19) (20) where kij’s, usually referred to as binary interaction parameters, are calculated by parameterizing the EOS with experimental k values [21]. For hydrocarbon systems, the kij’s are commonly set to zero, except for describing interaction between hydrocarbons and non-hydrocarbons and between light and heavy hydrocarbons. An alter- native method proposed by Chueh and Prausnitz [22] can also be used for evaluating kij’s: ( ) () 12 3 12 12 18 ci cj ij ci cj vv kA vv = − + (21) where vci is the critical molar volume of component i. The coefficient A is usually adjusted to match the meas- ured saturation pressure s o f the mixture. Since correlations for critical pressure are in general less accurate than correlations for critical temperature, the critical pressure of the fraction together with the binary interaction parameter of was used as re- gression variables to fit experimental pressure saturation data with the modified PR EOS, which is built in the PVTi (version 2010.1) and the PVTpro (version 5.1) simulators of the Schlumberger software is used in this work. The PVTi s imulator was used in this work to reproduce the live oil (by co mbining the first -stage separator gas and the stock-tank oil) and also to predict the recombined oil characteristics at the reservoir saturation pressure  S. I. Abu-Eishah, R. S. Mohammad and bottom hole temperature. The PVTpro simulator was used to investigate the oil swelling rate and establish the relationship between saturation pressure and the injected CO2 mass fraction. The results of simulation are presented later. 8. Results and Discussion 8.1. Experimental Results The recombination process was first performed to obtain the same saturation pressure at which the reservoir flu- id was sampled (Psat0) and the corresponding volume of the live oil, V0, which were determined by stabilizing the 2nd syringe p u mp. More than 10 experimental runs were done for each well at the specific reservoir bottom hole temperature (235˚F for well A#22 and 257˚F for well A#33). Ta ble 4 and Table 5 show the recombination tests resul ts. The r esulting live oi ls have been used in t his work as the start ing fluids fo r the subsequent swilling t ests . The static-synthetic method, which consists of preparing a mixture of known overall composition, was used to observe the fluid phase behavior by changing the pressure of the equilibrium cell at the spe cific reser voir b otto m hole temperature. Typical results of the static-synthetic methods are bubble point and dew point curves. Phase changes are determined visually by pressure adjustments at constant temperature. It is important to emphasize Table 4. Recombination results and live oil volume, V0, for well A#22 at 2277 psia and 235˚F. Run mdead oil (g) Vdead oil (ml) Vgas (ml) mgas (g) mlive oil (g) V0 (ml) Psat0 (b a r ) 1 6.14 7.442 0.392 0.484 6.624 6.31 157.3 2 6.19 7.503 0.395 0.488 6.678 6.97 157.8 3 6.15 7.455 0.392 0.485 6.635 7.91 157.4 4 6.22 7.539 0.397 0.491 6.711 6.60 158.0 5 6.20 7.515 0.395 0.489 6.689 7.13 157.9 6 5.70 6.909 0.364 0.450 6.150 6.73 157.2 7 5.84 7.079 0.372 0.461 6.301 7.74 156.9 8 6.18 7.491 0.394 0.488 6.668 7.32 157.6 9 5.95 7.212 0.379 0.469 6.419 7.58 157.1 10 6.17 7.479 0.394 0.487 6.657 - 157.5 Table 5. Recombination results and live oil volume, V0, for well A#33 at 2377 psia and 257˚F. Run mdead oil (g) Vdead oil (ml) Vgas (ml) mgas (g) mlive oil (g) V0 (ml) Psat0 (b a r ) 1 5.94 7.279 0.391 0.492 6.432 7.36 165.2 2 5.68 6.961 0.374 0.470 6.150 8.40 164.7 3 5.61 6.875 0.370 0.464 6.074 9.44 164.5 4 5.46 6.691 0.360 0.452 5.912 8.30 163.8 5 5.63 6.900 0.371 0.466 6.096 8.56 164.6 6 5.48 6.716 0.361 0.453 5.933 8.14 163.9 7 5.70 6.985 0.375 0.472 6.172 9.20 164.2 8 5.39 6.605 0.355 0.446 5.836 9.22 163.4 9 5.90 7.230 0.389 0.488 6.388 8.70 165.0 10 5.58 6.838 0.368 0.462 6.042 - 164.1 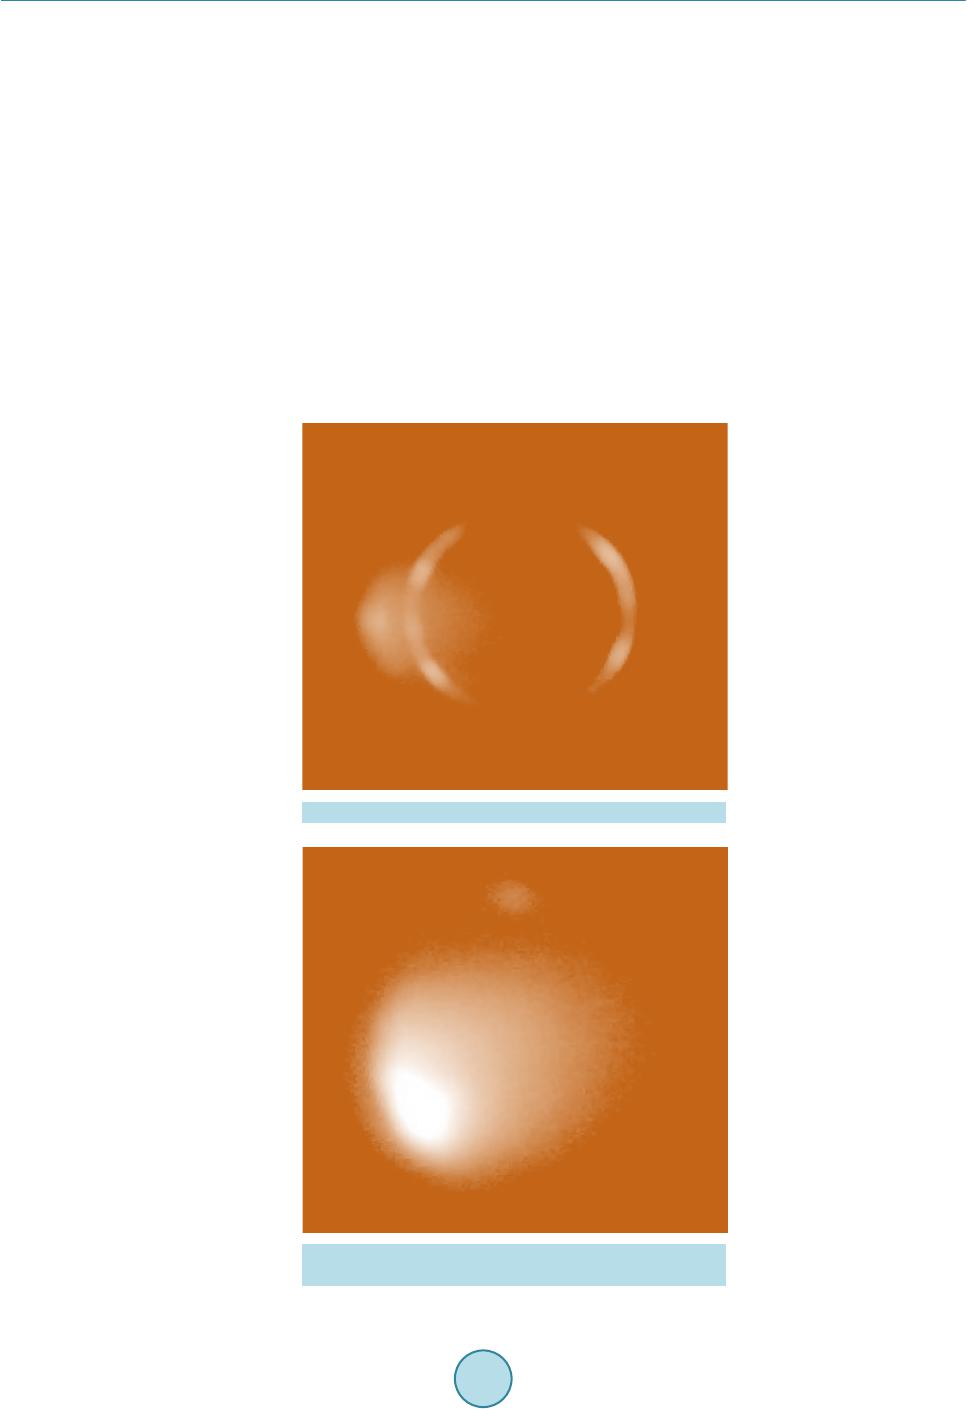 S. I. Abu-Eishah, R. S. Mohammad that for a system with known global composition at a given temperature and pressure, the static-synthetic tech- nique can only determine whether the system is composed of one, two or three phases. The respective phase compositions are still unknown as shown in the photographic image for the single phase (dead oil) system for well A#33 (Figure 5). O n the othe r ha nd, F igure 6 shows the photographic image for initial phase formation in the live oil system for well A#33. In the swellin g tests, the CO 2 was then injec ted into the live oil (recombined oil) to obser ve a two-pha se sys- tem , and sometimes in a narrow range, a three-phase system , depending on the pressure and the mass fraction of CO2 in the CO2/live oil syste m. It is worth mentioning t hat the three-phase observed here was not confirmed by the Commercial Service Provider. The saturation pressure, Psat, and the final volume of the CO 2/live oil system V01, were noted after stabilizing the 2nd syringe pump. T he relative swelling volume (Vsw) was then calculated as Vsw = V01/V0. Table 6 and Ta- ble 7 present the experimentally observed and the calculated swelling test results for wells A#22 and A#33, re- spectively. It is clear that substantial increases in the saturation pressure and the swelling factor are obtained as result of the increase in the CO2 mass fraction in the CO2/live oil system. For example, the swelling factor has increased from 1.0 to about 1.7 upon the increase o f the CO 2 mass fraction from 0.0 to 0.6. In gener al, the h igher the swelling factor the better the enhanced oil recovery. On the other hand, Figure 7 shows the swelling factor Figure 5 . Monophasic fluid for well A#33 at 257˚F. Figure 6. Initial bubble formation in the live oil of well A#33 at 257˚F.  S. I. Abu-Eishah, R. S. Mohammad Table 6. Swelling test results for the CO2/live oil system for well A#22 at 2277 psia and 235˚F. Run From recombination results Swelling results Psat0 (bar) V0 (ml) (ml) (bar) (bar) V01 (ml) Vsw = V01/V0 1 157.3 6.31 0.05 1.117 167.2 - 6.43 1.02 2 157.8 6.97 0.10 2.363 192.6 - 7.90 1.13 3 157.4 7.91 0.15 3.741 205.9 - 9.03 1.14 4 158.0 6.60 0.20 5.343 230.4 - 8.30 1.26 5 157.9 7.13 0.25 7.101 242.6 - 9.29 1.30 6 157.2 6.73 0.30 8.447 253.4 255.9 9.61 1.43 7 156.9 7.74 0.35 10.909 267.0 2 70.9 11.50 1.49 8 157.6 7.32 0.40 14.201 287.3 2 92.0 12.30 1.68 9 157.1 7.58 0.50 20.575 317.1 3 23.3 13.10 1.73 10 157.5 - 0.60 31.902 357.4 - - - Table 7. Swelling test results for the CO2/live oil system for well A#33 at 2377 psia and 257˚F. Run Fr om recombination results Swelling results Psat0 (bar) V0 (ml) (ml) (bar) (bar) V01 (ml) Vsw = V01/V0 1 165.2 7.36 0.05 1.117 178.0 - 7.43 1.01 2 164.7 8.40 0.10 2.263 195.5 - 8.82 1.05 3 164.5 9.44 0.15 3.549 212.0 - 10.86 1.15 4 163.8 8.30 0.20 4.926 235.2 - 10.04 1.21 5 164.6 8.56 0.25 6.728 248.3 - 10.79 1.26 6 163.9 8.14 0.30 8.448 261.1 265.1 11.07 1.36 7 164.2 9.20 0.35 11.041 277.3 2 80.5 12.97 1.41 8 163.4 9.22 0.40 13.012 289.1 2 93.2 14.48 1.57 9 165.0 8.70 0.50 21.083 324.0 3 30.0 15.14 1.74 10 164.1 - 0.60 30.108 400.0 - - - of the CO 2/l i ve o il s yst e m a s func t io n o f sat ur a tio n p r ess ur e for wells A#22 (at 235˚F) and A#33 (at 257˚F). The best fit of the swelling factor vs. saturation pressure is also shown on Figure 7. Figure 8 and Figure 9 show re sp ec tive l y t he p hot o gr ap hi c i ma ge s fo r a mono p ha s ic flui d s ys te m a nd a p has e transition for the CO2/live oil system at a CO2 mass fraction of 0.5 for well A#33. As can be noted from these images, the phase transition detection device used was very suitable. It is important to highlight that this direct measurement of the saturation pressure without any additional treatment of image s is a mong the very fe w times repor te d in litera ture ( e .g. [8]). Figure 10 and Figure 11 show the effect of the injected CO2 mass fraction on the saturation pressure and phase transformation for wells A#22 and A#33, respectively, at the corresponding reservoir bottom hole tem- peratures. At , the interaction between the hydrocarbon molecules is not affected enough by the presence of CO2 and only conventional vapor-liquid transition is observed while a three-phase (vapor-liquid- liquid) system exists at . However, the phase transformations can be explained as follows taking well #33 reservoir fluid as an example. The phase behavior of binary mixtures of CO2 and live oil depends on 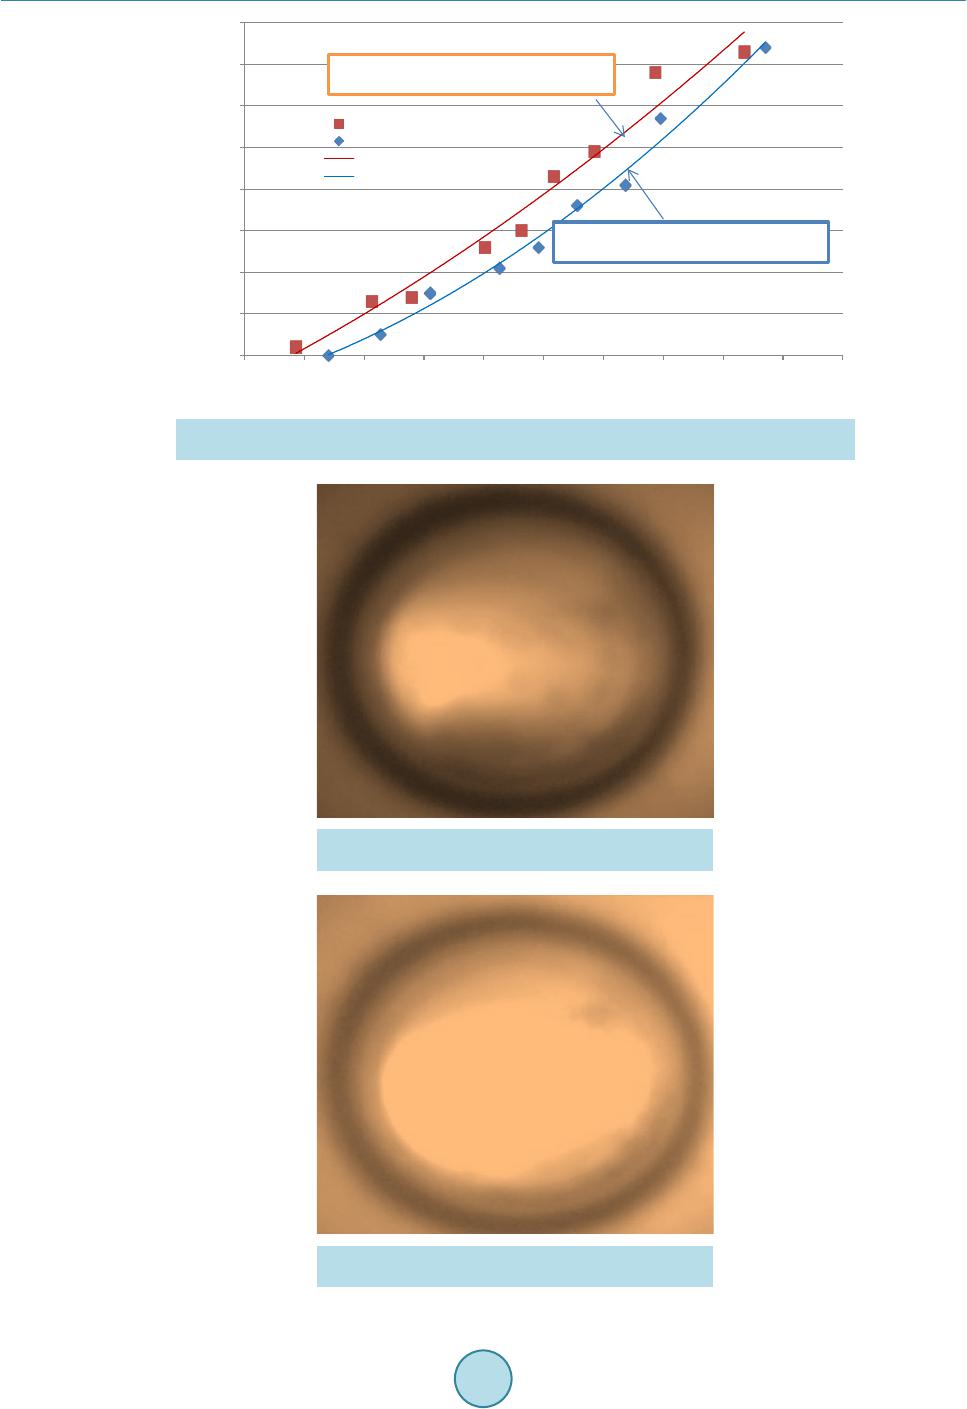 S. I. Abu-Eishah, R. S. Mohammad Figure 7. Swelling factor of the CO2/live oil system as function of saturation pressure for well A#22 (at 235˚F) and well A#33 (at 257˚F). Figure 8. Monophasic fluid of the system CO2/live oil for well A#33 at 257˚F. Figure 9. Phase transition in the CO2/live oil system for well A#33 at 257˚F. Vsw = 8E-06 (Psat)2 + 0.0013 Psat + 0.5684 R² = 0.97 Vsw = 1E-05 (Psat)2 -0.0022 Psat + 0.932 R² = 0.9872 1 1.1 1.2 1.3 1.4 1.5 1.6 1.7 1.8 150 170190 210 230250 270 290310 330 350 Saturation Pressure (P sat , bar)  S. I. Abu-Eishah, R. S. Mohammad Figure 1 0. Measured saturation pressure vs. CO2 mass fraction for well A#22 (235˚F). Figure 1 1. Measured saturat io n pressure vs. CO2 mass fraction for well A#33 (257˚F). the C O2 mass fraction and the s ystem p re ssur e. For i nsta nce, the origi nal li ve oil (i.e ., ) is liquid at P > 164.5 bar, but it transforms into two (liquid + vapor) phases at P < 164.5 bar. For a single liquid phase exists at P ≥ 250 bar while a two phase (liquid + vapor) system forms at P < 199 bar. At , the phase behavior is more complicated. For i nstance, at , a single liq uid p hase e xists a t P ≥ 400 bar, a two phase (liq uid + vapor) system e xists at P = 261.1 bar and as the pressure is slightly increased (P = 265.1 bar), t he vapor phase, which co ns ists of CO 2 and light hydrocarbons, condenses into a second liquid phase, i.e., a (liquid + liquid + vapor) exists. It should be mentioned, as it appears in Figure 10 and Figure 11, that there is a narrow pressure range over which two liquid phases (a CO2-rich liquid + an oil-rich liquid) and a vapor phase coexist. The real observation of the three-phase system is shown in Figure 12 for well A#33 where the CO2/live oil 160 180 200 220 240 260 280 300 320 340 360 380 400 00.05 0.1 0.15 0.2 0.25 0.3 0.35 0.4 0.45 0.5 0.55 0.6 Saturation Pressure (bar) Vapor-Liquid for well A#22 Vapor-Liquid-Liquid for well A#22 160 180 200 220 240 260 280 300 320 340 360 380 400 00.05 0.1 0.15 0.2 0.25 0.3 0.35 0.4 0.45 0.5 0.550.6 Saturation Pressure (bar) Vapor-Liquid phases for well A#33 Vapor-Liquid-Liquid phases for well A#33 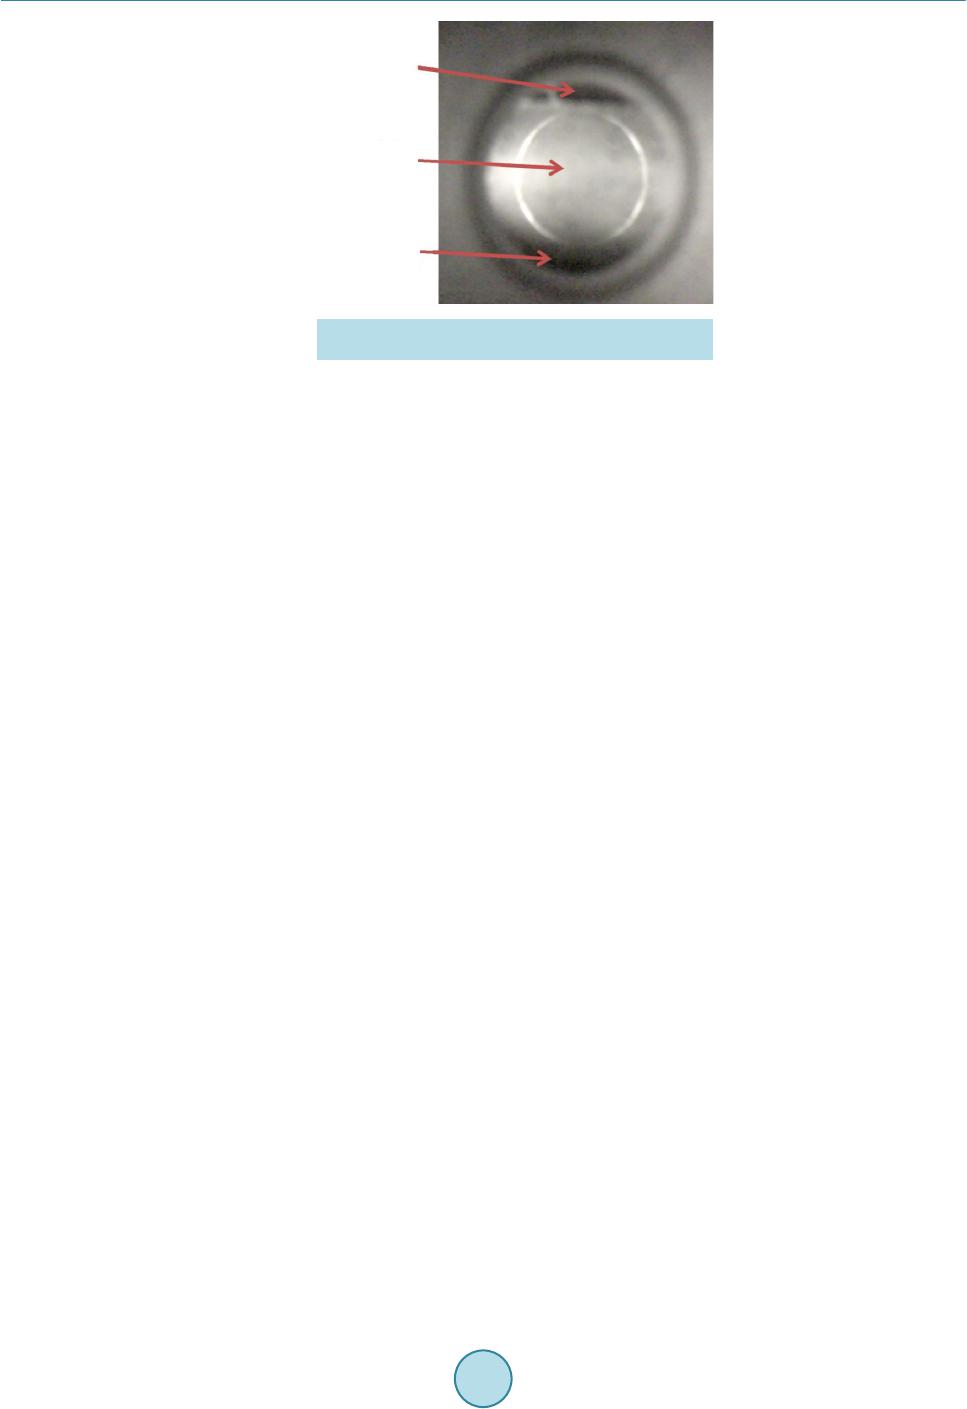 S. I. Abu-Eishah, R. S. Mohammad Figure 12. Example of an experimentally observed vapor-liquid-liquid transiti on for wel l A#33 (257˚F). system is divided into three phase fractio ns: the light phase (gas), the inter mediate phase (liquid) and the heavy oil phase (liquid). The formation of a second liquid phase when propane or CO2 was used as solvent was ob- served by Feizabadi et al. [11]; claiming that the seco nd liquid phase is mainly composed of the solvent itself. 8.2. Modeling and Simulation Results With the objective of getting a monophasic fluid with a composition similar to that of the reservoir fluid, the PVTi si mulation was perfor med on the recombined o il (obtained b y mixing the first-stage separ ator gas and the stock-tank oil) at the reservoir saturation pressure and bottom hole temperature. Noting that the reported va- por-to-oil molar ratios for wells A#22 and A#33 are 0.5183 and 0.5603, respectively. The saturation pressure was obtained for each well at the reservoir conditions by tuning the PVTi simulator, whic h coul d not s ucce ed i n ge ttin g the req uire d vap or phase composition, especially for methane, which has the highe st perc entage i n the rese rvoir fluid . This might be attributed to the fact that we are using the gas available from the first-stage separator rather than the non-available late-stage separator gas. In order to solve such a problem, the monophasic fluid was reproduced by recombining the resulting gas phase from the PVTi simulator with the stoc k-tank oil. The average of the absolute error (AAE) in composition between the fluid data and the reproduced mono- phasic fluid was 0.68% for well A#22 and 0.99% for well A#33, b ut still there is a h igh deviation in the methane content between the field and the reproduced data; 7.4% for well A#22 and 11.0% for well A#33. In order to minimize such deviation, the vapor-to-oil molar was adjusted in this work until a zero deviation in methane content was achieved for each reservoir monophasic fluid. T he converged vapor-to-oil mol ar ratios were 0.4199 for well A#22 and 0.4196 for well A#33. T he resulting average of the absolute erro rs (AAE) in compositio n af- ter these trials became 0.79% for well A#22 and 1.09% for well A#33. Figure 13 and Figure 14 show the co m- positional analysis fo r field data vs. recombined fluid at minimum average absolute errors in co mposition, and at 0% deviation in methane composition for wells A#22 and A#33, respectively. On the other hand, Table 8 shows the experimental vs. predicted (using PVTpro) swelling saturation pres- sures for wells A#22 and A#33. The average of the absolute relative error (AARE) between experimental and predicted saturation pressures was 7.78% for well A#22 and 5.38% for well A#33. I t is also clear from Tab le 8 that the saturation pressure of the system (a t the speci fic r e servoir b ottom hole temp e r a ture) is highly affecte d by the C O2 mass fr a cti o n in the C O2/live oil mixture a nd it is almost d oubled upon increasing the CO2 mass fractio n from 0.0 to 0.6. Table 9 shows the PVTpro predictions of the swelling saturation pressure for CO2 mass fractions above 0.6. A phase transformation from saturated liquid (bubble) to saturated vapor (dew) was predicted at a CO2 mass fraction > 0.7 for well A#22 and ≥0.65 for well A#33. This could not be confirmed experimentally since for a pressure of more than 500 bar is required in the 2nd syringe pump, which is above the limit of that pump. Also at no stabilization was observed and no monophasic system was detected. Lastly, the swelling test was performed using the PVTpro simulator and the predicted saturation pressures vs. CO2 mass fraction were compared with those obtained experimentally as shown in Figure 15. The average of Gas Phase Intermediate Phase (Liquid) Heavy Oil Phase (Liquid) 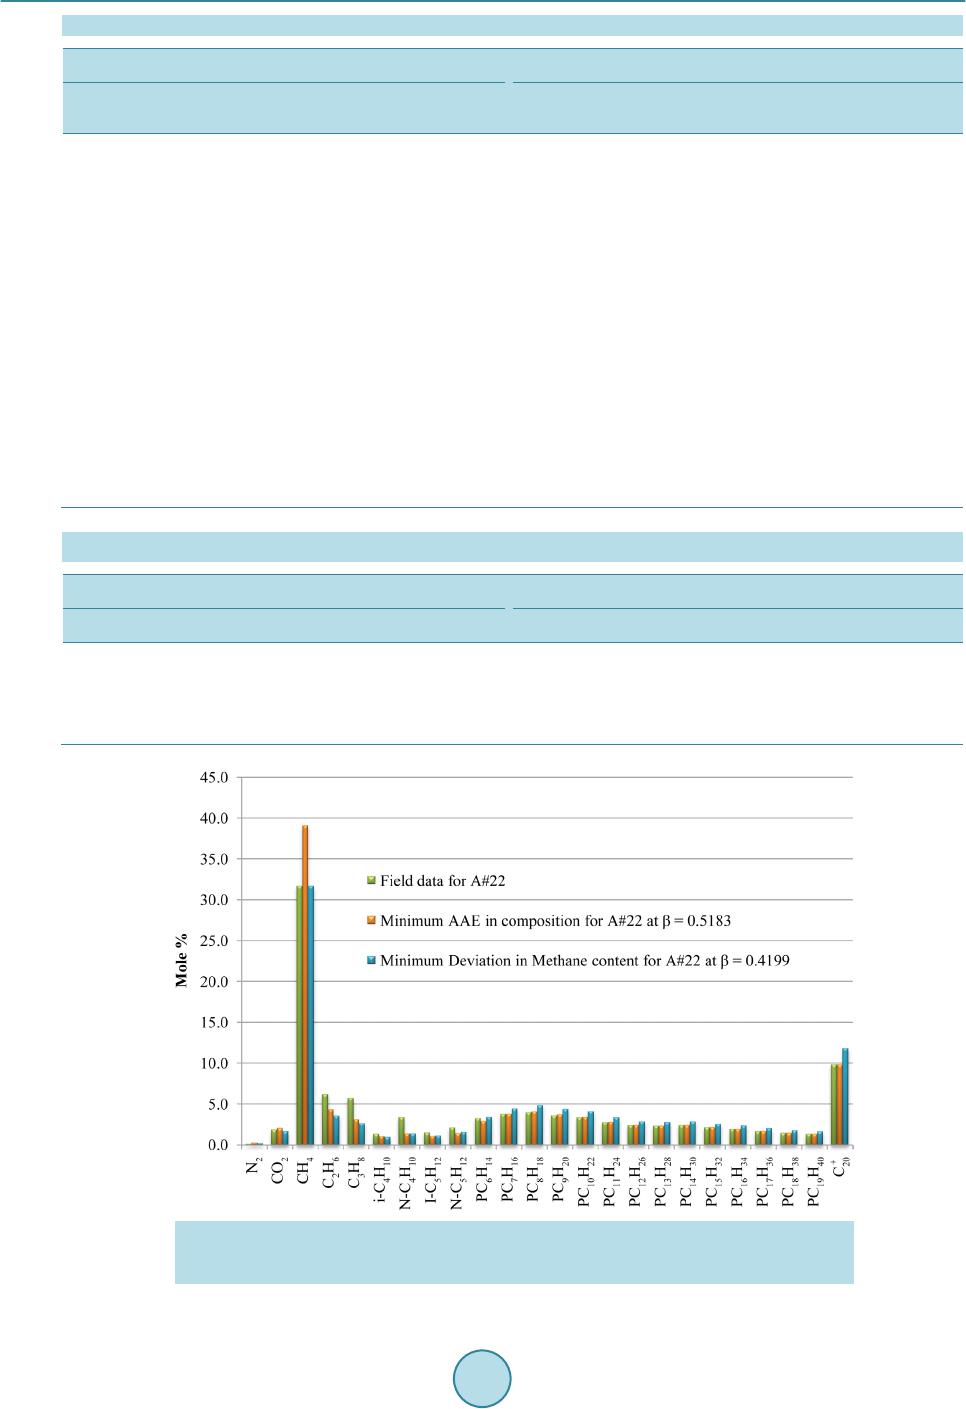 S. I. Abu-Eishah, R. S. Mohammad Table 8. Experimental vs. simulated (using PVTpro) swelling saturation pressures for wells A#22 and A#33. Well A#22 at 235˚F Well A#33 at 257˚F Psat, (Exp.), bar Psat (PVTpro), bar AARE, % Psat, (Exp.), bar Psat (PVTpro), ba r AARE , % 0.00 154.9 157.0 1.36 0.00 161.7 163.9 1.36 0.05 167.2 166.2 0.60 0.05 178.0 173.9 2.30 0.10 192.6 176.1 8.57 0.10 195.5 184.7 5.52 0.15 205.9 186.7 9.32 0.15 212.0 196.7 7.22 0.20 230.4 198.4 13.89 0.20 235.2 209.2 11.05 0.25 242.6 211.4 12.86 0.25 248.3 223.6 9.95 0.30 253.4 226.0 10.81 0.30 261.1 240.1 8.04 0.35 267.0 242.9 9.03 0.35 277.3 259.3 6.49 0.40 287.3 262.8 8.53 0.40 289.1 282.0 2.46 0.50 317.1 316.0 0.35 0.50 324.0 340.6 5.12 0.60 357.4 394.0 10.24 0.60 400.0 420.7 5.18 Average ARE = 7.78 Aver age AR E = 5.88 Table 9. Predicted swelling saturation pressures (using PVTpro) for wells A#22 and A#33 at . Well A#22 at 235˚F Well A#33 at 257˚F injected Pbu b, bar Pdew, bar injected Pbu b, bar Pdew, bar 0.65 446.2 - 0.65 - 471 .8 0.70 511.7 - 0.70 - 533 .5 0.75 - 597 .5 0.75 - 610 .4 Figure 13. Compositional analysis for well A#22: Field data vs. recombined fluid at β = 0.5183 (minimum AAE in composition) and recombined fluid at β = 0.4199 (0% deviation in methane composition). 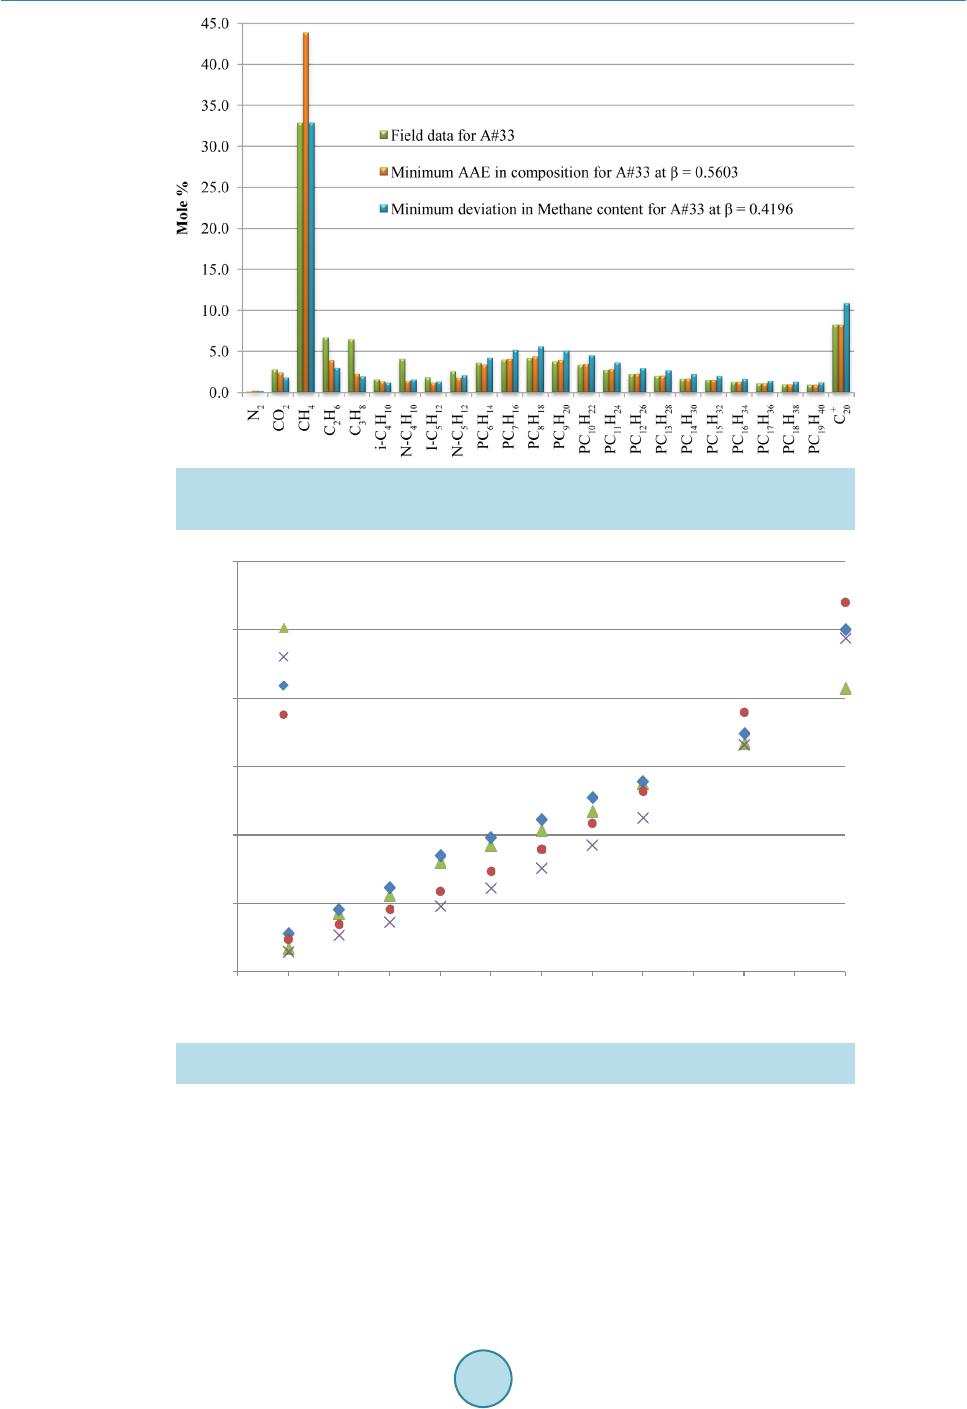 S. I. Abu-Eishah, R. S. Mohammad Figure 14. Compositional analysis for well A#33: Field data vs. recombined fluid at β = 0.5603 (minimum AAE in composition) and recombined fluid at β = 0.4196 (0% deviation in methane composition). Figure 1 5. Experimental vs. predicted swelling sat uration pressure vs. CO2 mass fra ct io n for wells A#22 and A#33. the absolute relative error (AARE) was 7.78% for well A#22 and 5.38% for well A#33 as confirmed in Table 8 above. 9. Conclusion In th is work an experimental phase equilibrium setup for t he recombination of live oil (stock-tank oil a nd first- stage separator gas) and measurement of the corresponding phase behaviors of CO2/live oil mixtures is de- scribed. The experimental setup has been successfully tested in two sets of recombination tests followed by 150 200 250 300 350 400 450 00.05 0.10.15 0.20.25 0.30.35 0.40.45 0.50.55 0.6 Saturation Pressure (bar) Experimental for well A#22 Predicted for well A#22 using PVTpro Experimental for well A#33 Predicted for well A#33 using PVTpro  S. I. Abu-Eishah, R. S. Mohammad swelling tests for various CO 2 mass fractions. T he CO2/live oil system was studied at the reservoir bottom hole temperature and at high pressure ranges starting at the reservoir saturation pressures of two United Arab Emi- rates oil reservoirs (A#22 and A#33). The results showed that the CO2 mass fraction has a strong influence on the swelling saturation pressure and the swelling factors of the systems under study. The swelling saturation pressure has almost doubled and the swelling factor has increased fro m 1.0 to 1.74 upon the increase of the in- jected CO2 mass fraction from 0.0 to 0.6. In general, the higher the swelling factor the better the enhanced oil recovery (EOR). Also it has been noticed that three-phase (liquid-liquid-vapor) transitions were observed at CO2 mass fraction of 0.3 and above. This might have a positive effect on enhanced oil recovery. References [1] P atil, S., Dandekar, A. and Kh atani ar, S. (2008) Phase Behavior, Solid Organic Precipitation, and Mo bility Charact eri- zation Studies in Support of Enhanced Heavy Oil Recovery on the Alaska North Slope. DOE Award No.: DE-FC26- 01NT41248. Prepared for US Department of Energy, National Energy Technology Laboratory, Submitted by Petro- leum Development Laboratory Institute of Northern Engineering, University of Alaska Fairbanks. http://dx.doi.org/10 .2172/963365 [2] Moortgat, J., Firoozab adi, A., Li, Z. and Espósito, R. (2013) CO2 Injection in vertical and horizontal cores: Measure- ments an d numerical simulation. SPE Journal, 18, 1-14. http://dx.doi.org/10.2118/135563-PA [3] Danes h, A. (1998) PVT and Phase Behaviour of Petroleum Reservoir Fluids, Developments in Petroleum Science. El- sevier Science, 47. [4] Mathiassen, O.M. (2003) CO2 as Injection Gas for Enhanced Oil Recovery and Estimation of the Potential on the Norwegian Continental Shelf. M.Sc. Thesis, Norwegian University of Science & Technology (NTNU), Trondheim/ Stavanger, Part I of II. [5] Yuan, S., Ye, J. a nd Sun, Z. (2003) Theo ry and Pract ice in Gas-Condensate Reservoir Development. China Petroleum Industry Press, Beijing. [6] Wang, S., Chen, S. and Li, Z. (2016) Characterization of Produced and Residual Oils in the CO2 Flooding Process. Energ y Fuels, 30, 54-62. http://dx.doi.org/10.1021/acs.energyfuels.5b01828 [7] P edersen, K.S., Fredenslund, A. and Thomassen, P. (1989) Prop erties of Oils and Natu ral Gases. Gulf Publ. Co., H ou- ston. [8] Araujo, C.B.K., Capitelli, F.O., Rajagopal, K., Corazza, M.L. and Ndiaye, P.M. (2012) Phase Behavior of Brazilian Stock-Tank Oil and Carbon Dioxide at Reservoir Conditions: Experimen ts and Thermodynamic Modeling. IX Iberoa- merican Conference on Phase Equilibria and Fluid Properties for Process Design (EquiFase 2012), Puerto Varas, 8-12 Oc tober 2 012 . [9] Al -Jarba, M. and Al-Anazi, B.D. (2009 ) A Comparison Study of the of the CO2-Oil Physical Properties Literature Correlations Accuracy Using Visual Basic Modelling Technique. NAFTA, 60, 287-2 91. [10] Emera, M.K. and Sarma, H.K. (2006) Genetic Algorithm (G A)-Based Correlations Offer More Reliable Prediction of CO2-Oil Physical Properties. Canadian International Petroleum Conference, Calgary, 13-15 June 2006. http://dx.doi.org/10 .2118/2006-197 [11] Feizab adi, S.A., Abedi, J. and Chen, Z. (2012) Import ance of a Second Liquid Phase Formation in CO2 Injection into Bitumen Reservoirs and Its Effect on Production. SPE Improved Oil Recovery Symposium, Tulsa, 14-18 April 2012. http://dx.doi.org/10 .2118/153712-ms [12] CSLF Task Force (2013) Technical Challenges in the Conversion of CO2-EOR Projects to CO2 Storage Proj ects. Final Report, Carbon Sequestration Leadership Forum, September. [13] Mo hammad, R.S. (2012) PVT Study of Selected UAE Reservoir Fluids. M.Sc. Thesis, UAE University, Al Ain. [14] Brill, J.P. and Beggs, H.D. (1974) Two -Phase Flow in Pipes. Uni ver s ity of Tulsa, INTERCOMP Course, The Hague. [15] Rojey, A., Jaffrey, C., Cornot-Gandolphe, S., Durand, B., Jullian, S. and V allais, M. (1997) Natural Gas. Production, Processing, Transport, Édit i o ns T e c hnip, Pari s , 429 p. [16] Angus, S., Armstrong, B., de Reuck, K.M., Altunin, V.V., Gadetskii, O.G., Chapel a, G.A. and Rowlinson, J.S. (1976) International Union of Pure and Applied Chemistry (IUPAC). Carbon Dioxide: International Thermodynamic Tables of the Fluid State, Vol. 3, Pergamon Press, Oxford, 1522-2640. [17] Kokal, S .L. and Sayegh, S.G. (1990) Ga s-Saturated Bitumen Density Predictions Using the Volume-Translated Peng- Robinson Equation of State. Journal of C an adian Petr ol e um Te c hnolo gy , 29, 77-82. http://dx.doi.org/10 .2118/90-05-07 [18] Lielmezs, J., Howell, S.K. and Campbell, H.D. (19 83) Modified Redlich-Kwong Equation of State for Saturated Va-  S. I. Abu-Eishah, R. S. Mohammad por-Liquid Equilibrium. Chemical Engi neering Science, 38, 1293-1301. http://dx.doi.org/10 .1016/0009-2509(83)80049-9 [19] Peng, D.Y. and Robinson, D.B. (1976) A New Two Constant Equation of State. Industrial and Engineering Chemistry, Fundamentals, 15, 59-64. http://dx.doi.org/10.1021/ i 160057a011 [20] Peneloux, A., Rauzy, E. and Freze, R. (1982) A Consistent Correction for Redlich-Kwong-Soave Volumes. Fluid Phase Equilibria, 8, 7-23. http://dx.doi.org/10.1016/0378-3812(82)80002-2 [21] Katz, D. L. and Firoozabadi, A. (1978) Predicting Phase Behavior of Condensate/Crude Oil Systems Using Methane Interaction Coefficients. Journal of Petroleum Technology, 30, 1649-1655. http://dx.doi.org/10.2118/6721-PA [22] Chueh, P.L. and P rausnit z, J.M. (1968) Calculation of High-Pressure V apor-Liquid Equilibria. Industrial & Engineer- ing Chemistry, 60, 34-52. http://dx.doi.org/10.1021/ie50699a007  S. I. Abu-Eishah, R. S. Mohammad Nomenclature a Attraction parameter in the PR EOS ac A parameter defined by Equation (12) i n the P R EOS b Repulsion parameter in the PR EOS ci Volume-shift parameter m A parameter defined by Equation (13) in the PR EOS Pc Critical pressure Pcm Mixture critical pressure Ppr Pseudo-reduced pressure, dimensionless Pr Reduced pressure, dimensionless Psat Saturation pre ssure Pst Pressure at standard conditions R Universal gas constant si Dimensionless volume-shift par ameter Tc Critical tempera ture Tcm Mixture critical temperature Tpr Pseudo-reduced temperature, dimensionless Tres Reservoir bottom hole tempe rature Tr Reduced temperature, dimensionless Tst Temperature at standard conditions v Molar volume in the PR EOS V0 Volume of saturate d live oil, ml V01 Volume of the saturated CO2/live oil mixture, ml Vi Valve number i (= 1 to 6) in the experimenta l setup Vi Initial volume of CO2 in the 2nd syringe pump, ml Vf Final volume of CO2 in the 2nd syringe pump, ml V0 Volume of live oil system (recombination test), ml V01 Volume of CO2/live oil system (swelli ng test), ml Vsw Swelling factor x Liquid mole fraction y Vapor mole fraction z Mole fraction (liquid or vapor) Z Compressibility factor Greek Symbols kij B inar y interaction parameter between components i and j ω Acentric factor Abbreviations AARE Average of Absolute Relative Errors EOR Enhanced Oil Recovery PR Peng-Robinson SRK Soave-Redlich-Kwon g  S. I. Abu-Eishah, R. S. Mohammad Appendix Table A1. Critical properties and composition of the gas mixture of wells A#22 and A#33. Comp onent Critical Properties Mole frac tion, yi Pc, bar Tc, K Well A#22 Well A#33 N2 33.9 126.2 0.0 049 0.0035 CO2 73.9 304 .7 0.0396 0.0426 C1 46.0 190.6 0.7539 0.7820 C2 48.8 305.4 0.0824 0.0672 C3 42.5 369.8 0.0543 0.0318 i-C4 36.5 408.1 0.0173 0.0193 n-C4 38.0 425.2 0.0143 0.0089 i-C5 33.9 460.4 0.0082 0.0070 n-C5 33.7 469.6 0.0061 0.0090 C6 30.1 507.5 0.0051 0.0087 16.8 733.7 0.0140 0.0199 Table A2. Values of the volume-shift parameters calculated by the PVTi si- mulator. Comp onent s-Shifts c-shifts (ft3/lb-mol) N2 −0.0131 −0.0506 CO2 −0.0427 −0.0183 C1 −0.0144 −0.0619 C2 −0.1033 −0.0669 C3 −0.0775 −0.0699 iC4 −0.0620 −0.0719 nC4 −0.0542 −0.0629 iC5 −0.0418 −0.0588 nC5 −0.0303 −0.0437 C6 −0.0073 −0.0127 C7 0.0576 0.1113 C8 0.0319 0.0661 C9 0.0595 0.1412 C10 0.0861 0.2308 C11 0.1140 0.3431 C12 0.1280 0.4259 C13 0.1384 0.5027 C14 0.1417 0.5572 C15 0.1471 0.6268 C16 0.1553 0.7176 C17 0.1578 0.7762 C18 0.1570 0.8154 C19 0.1600 0.8713 0.3052 3.1170
|